• Aperçu
  • Avis (6)
  • Commentaires

Netting Panel RSJ

4.33


Funcionamento:

O Painel Netting Panel RSJ funciona com qualquer ativo e em qualquer tempo gráfico.

Ele funciona em contas do tipo "Netting" e "Hedge", mas gerencia apenas uma posição por ativo, por isso o nome Netting. Se ele for executado em contas do tipo "Hedge", ele fará o gerenciamento e proteção apenas da posição mais antiga, ou seja, da primeira posição que foi aberta por ele.

Em contas "Netting" quando os botões "SELL" ou "BUY" forem pressionados, ocorrerá incremento ou decremento da posição. No caso do incremento em que ocorra preço médio, indiferente se à favor ou contra a posição atual, o Painel fará automaticamente os ajustes necessários sempre baseado nas configurações atuais feitas pelo o usuário.

Em contas "Hedge" quando os botões "SELL" ou "BUY" forem pressionados, ocorrerá a abertura de novas posições, sem que afete a posição atual que está sendo gerenciada pelas configurações do usuário. Caso a posição atual na conta do tipo "Hedge" seja fechada e existam uma ou mais posições abertas pelo Painel no mesmo ativo, automaticamente o Painel irá gerenciar a posição mais antiga.

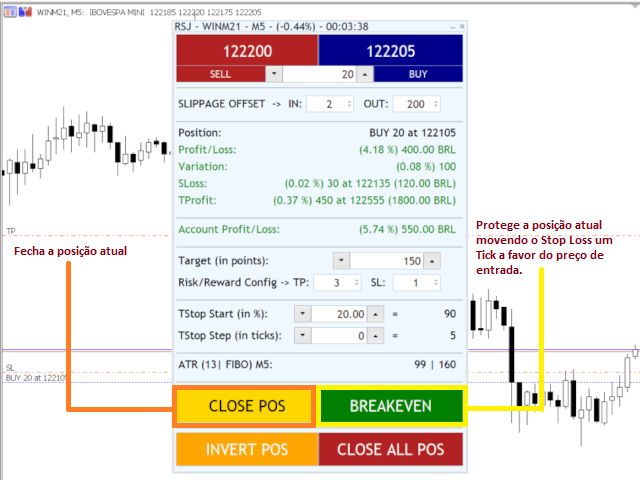
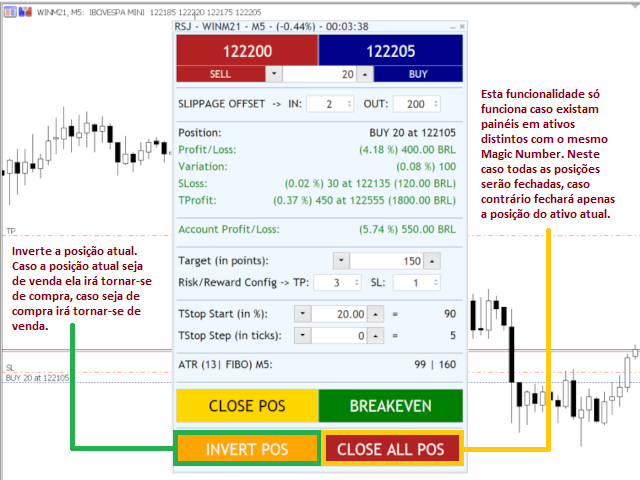
O Painel Netting Panel RSJ possui os seguintes recursos:

  • Variação em % do ativo atual com relação ao seu fechamento do dia anterior.
  • Contador regressivo para fechamento do candle atual (baseado no timeframe do gráfico atual).
  • Valores de "BID" e "ASK" do ativo atual.
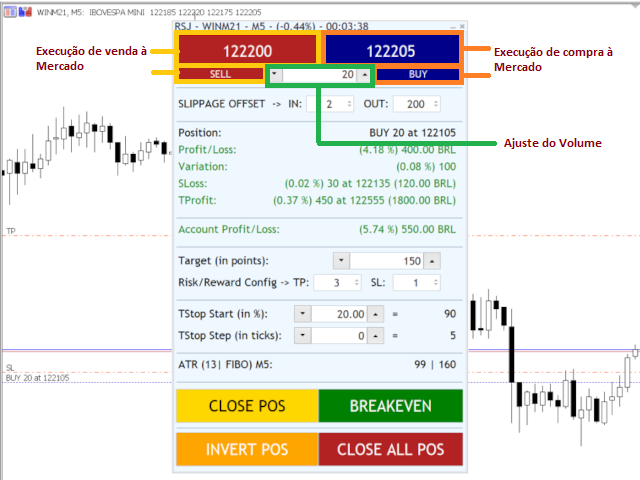
  • Configuração no tamanho do lote aplicado nas operações de compra e venda.
  • Botões de compra e venda à mercado.
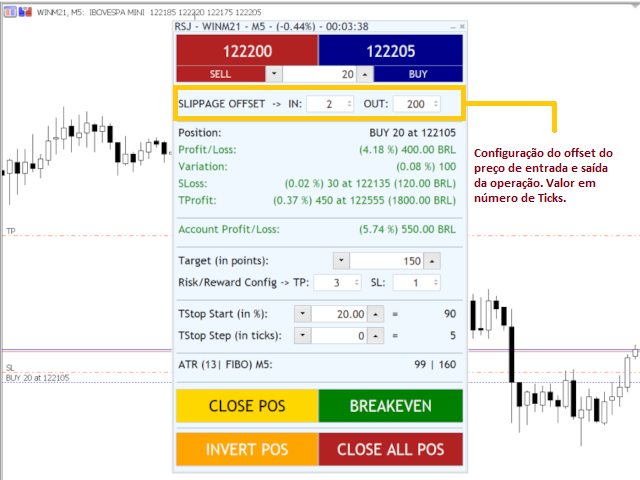
  • Configuração do offset máximo (podendo ser positivo ou negativo) do preço no momento da execução da ordem à mercado.
  • Detalhes da posição atual em gerenciamento (Verde em lucro ou vermelho em prejuízo) :
    • Tipo da posição ("BUY" / "SELL") informando o tamanho em lotes e o preço da mesma.
    • Variação da posição em % com relação ao Saldo da Conta, e valor do lucro ou prejuízo na moeda corrente do ativo.
    • Variação em % e em pontos com relação ao preço de entrada da posição. 
    • Valor do Stop Loss atual com as seguintes informações:
      • Variação em % do preço de entrada.
      • Número de pontos à partir do preço de entrada.
      • Preço de ativação do Stop Loss
      • Valor estimado do lucro ou prejuízo caso seja executado o Stop Loss na moeda corrente do ativo.
    • Valor do Take Profit atual com as seguintes informações :
      • Variação em % do preço de entrada.
      • Número de pontos à partir do preço de entrada.
      • Preço de ativação do Take Profit
      • Valor estimado do lucro caso seja executado o Take Profit na moeda corrente do ativo.
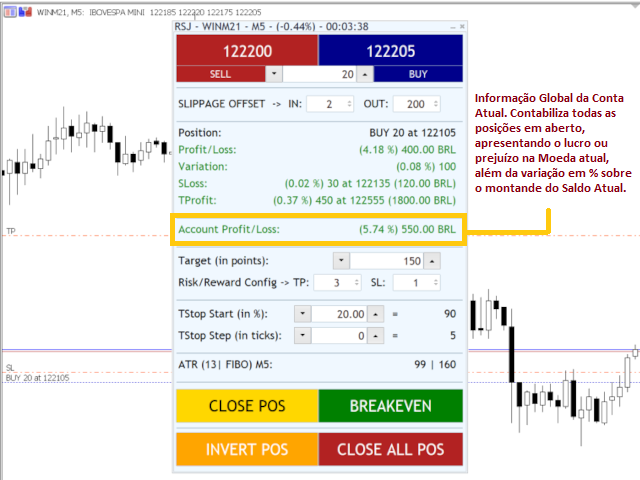
    • Contabilização global do lucro ou prejuízo atual da conta. Soma de todos os resultados das posições em aberto de todos os ativos na conta atual. (Verde em lucro ou vermelho em prejuízo)
    • Configuração do objetivo em pontos do Target da operação à ser aberta.
    • Configuração do Risk & Reward da operação à ser aberta. Esta configuração é um multiplicador a ser aplicado sobre o objetivo configurado no Target. Ela configurará o Take Profit e o Stop Loss.
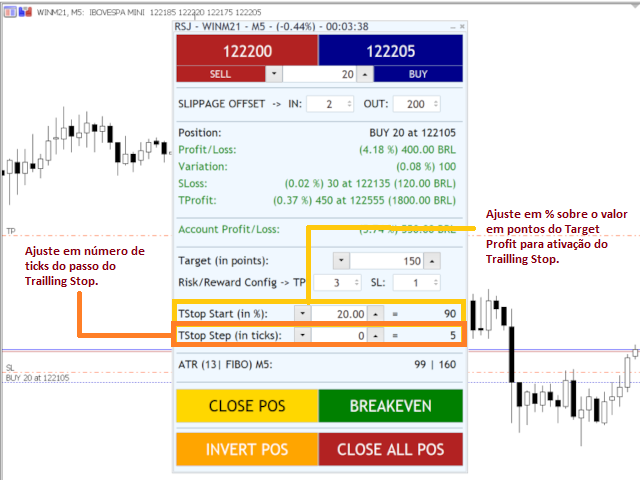
    • Configuração do Trailling Stop em % calculado sobre o Take Profit configurado da operação.
    • Configuração do Step do Trailling Stop caso ele seja ativado.
      • Informação do indicador ATR (Average True Range) automaticamente a cada ciclo de 1 minuto feito sobre o timeframe do gráfico atual e pelo período configurado pelo usuário. Apresenta uma sugestão de ATR FIBO multiplicado pelo fator padrão de Fibonacci.
      • Botão de fechamento da posição atual.
      • Botão de proteção da posição atual chamado "Breakeven". Só irá funcionar se o preço estiver pelo menos um TICK distante e positivo na posição atual.
      • Botão de inversão da posição. Transforma um posição vendida em comprada e uma posição comprada em vendida.
      • Botão de fechamento de todas as posições. No caso de contas "Netting" caso o Painel esteja aberto em vários ativos utilizando o mesmo "Magic Number", também chamado de EA ID, fechará todas as posições abertas por este ID. No caso de contas "Hedge" ele fechará todas as posições abertas no ativo atual, mas apenas as que foram abertas pelo Painel.


      Avis 6
      Renan Fernandes Souza
      187
      Renan Fernandes Souza 2021.07.15 11:00 
       

      Esta boleta é uma ferramenta essencial para o trader que quer otimizar as suas operações. Parabéns Roberto, ficou muito bom.

      Nitirojn Vichaikasampong
      97
      Nitirojn Vichaikasampong 2021.07.25 07:36 
       

      good

      FLX700
      16
      FLX700 2021.06.05 16:49 
       

      Roberto, em primeiro lugar parabéns pelo excelente trabalho. Sua ferramenta é excelente, na minha opinião ela é indiscutivelmente a melhor entre as gratuitas, eu a avalio com 4.5 de 5. Gostaria de fazer 3 sugestões/críticas para o aprimoramento da mesma. Eu senti falta de um recurso que para mim é o mais importante que é abrir ordens pelo risco e não apenas por lote. Gostaria de ter a opção "RISK %" pois no meu modo trabalhar essa opção é essencial. Outra coisa que sinto muita falta é o stop e gain poderem ser baseados no ATR o que facilita bastante no gerenciamento. E a terceira é apenas um pequeno detalhe. Acho que a boleta poderia ser um pouco mais estreita, pois acho que ela ocupa muito espaço. Espero que esse comentário possa ajudar nos aprimoramentos futuros. No mais, parabéns pelo trabalho. Forte abraço e sucesso!

      Produits recommandés
      DataFeeder
      Joao Paulo Euko
      Hi you, I need your help! Be my Patron, let's make it possible! https://www.patreon.com/joaopeuko https://github.com/Joaopeuko/Mql5-Python-Integration Esse Expert Advisor copia os dados("symbol,last,bid,ask") dos ativos que foram colocados na lista e só funciona enquanto o mercado esta aberto. Esse EA não é um link DDE ou RTD, as informações não são passadas em tempo real ao excel. O EA tem um delay de 30 segundos e o Excel tem um delay de 1 minuto. A vantagem desse EA é que ele dispen
      FREE
      PANEL OF TOPOS AND HISTORICAL BACKGROUNDS   This is a panel that does not open orders only manages all Symbols and calculates the tops and bottoms and presents the calculation in relation to the top and bottom in 5 Years, 2 Months and 1 Week. It is ideal for filtering the pairs that are in the good regions to operate. You can filter the range and choose whether to consider the body or shadow of the candle in the monthly. Good luck...
      FREE
      General Clock
      Fernando Lahude Ritter
      A Simple clock that on the left side "Time" shows r espectively the TimeCurrent, followed beneath by the TimeLocal. On the right hand side we have the remaining minutes and seconds of the current candle. TimeLocal is synced every 500 miliseconds however, the TimeCurrent and the time left on the candle are synced every tick, so this can lead to inconsistencies on the readings so keep that in mind. This indicator have no plots or buffers so it cannot be used in any time based EA.
      FREE
      Equidistant bands indicator with calculated moving average, allows you to configure the band size and can be used freely as an entry / exit indicator. Buffer 0 = price, buffer 1 = upper band, buffer 2 = lower band. you can also configure the periods of moving averages used in the calculations and also the shift to previous bars in addition to the price that can CLOSE (default) or OPEN. Excellent for fast daily moving pairs and frequent returns.
      FREE
      Daily VWAP Indicator
      Rafael Gazzinelli
      5 (1)
      Daily VWAP Indicator (Volume Weighted Average Price) Description The Daily VWAP (Volume Weighted Average Price) indicator is an essential tool for traders seeking to identify the true average price of an asset throughout the day, adjusted by traded volume. Primarily used by institutional and professional traders, the daily VWAP serves as a reference point to identify the average price trend based on trading volume, making it a powerful indicator for buy and sell decisions. How It Works The daily
      FREE
      Graphic Alignment Context
      Ricardo Alexandre Laurentino
      The Graphic Alignment Context (GAC) Technical Indicator measures the vertical difference of the simple average price of a financial instrument in the context of three different timeframes determined by a defined number of bars or candles (periods) to determine the strength of the buy or sell trend. sale. Ascending average prices indicate Buying strength (1), Descending average prices indicate Selling strength (-1) and any scenario different from the previous two conditions indicates Neutrality
      FREE
      Donchian Pro
      Paulo Henrique Faquineli Garcia
      5 (3)
      The Donchian Channel Channels are among the most popular tools of technical analysis, as they visually convey to the analyst the limits within which most price movement tends to occur. Channel users know that valuable information can be obtained at any time, whether prices are in the central region of a band or close to one of the border lines. One of the best known techniques to explore these concepts is Bollinger Bands. However, John Bollinger was not the only one to research the applicatio
      FREE
      The most advanced news filter on MQL market This is the demo version of my Expert Advisor " Take a Break ". All EA operations are limited to 1 chart symbol only. Please check the " What's new " tab regularly for a complete and up-to-date list of all improvements + parameters. Take a Break has evolved from a once simple news filter to a full-fledged account protection tool. It pauses any other EA during potentially unfavorable market conditions and will continue trading when the noise is over. Ty
      FREE
      FT ADX Color Candles
      FELIPE MISAEL MORAES KRUGER
      5 (6)
      Trading can be quite tiring when you need to look at several things at the same time. Format of candles, supports, resistances, schedules, news and indicators. This tool aims to facilitate the analysis of the ADX indicator. It colors the candles based on the levels of the indicator and the DI lines. The period, the limit of the indicator and the colors of the candles are customizable. You can also place a visual aid on the lower right side of the graph to view the values of ADX, DI + and
      FREE
      Market tops are characterized by Volume Climax Up bars, High Volume Churn and Low Volume Up bars (also called Testing). Market bottoms are characterized by Volume Climax Down bars, High Volume Churn and Low Volume Down bars (Testing). Pullbacks, in either up or down trends, are similar to market topping or bottoming patterns, but shorter in duration and with simpler volume patterns.
      FREE
      Strong movement levels
      Nikolay Mitrofanov
      5 (2)
      Looks for strong price movements and draws levels upon their completion. You determine the strength of the movement yourself by specifying in the settings the number of points and the number of candles of the same color in a row in one direction. There are 2 types of building in the settings: extrenum - high / low close - close price You can also adjust the number of displayed levels and the number of candles for calculations. By default, the settings indicate 5 levels for 360 candles.
      FREE
      LT Price Change
      Thiago Duarte
      4.88 (17)
      This is an informant indicator, very simple. It shows how much the price has chanded in percentage in certain period (month, week, day and actual period). It is discreet and small, does not visually posslute the chart. If your MT is not on portuguese idiom the indicator will automatically change to english. Check out our most complete tool for the market, the Trade Panel:  https://www.mql5.com/en/market/product/42658 If you have any suggestion or find any bug, please, contact us. Enjoy! This i
      FREE
      Market Momentum
      Flavio Javier Jarabeck
      4.33 (6)
      The Market Momentum indicator is based on the Volume Zone Oscillator (VZO), presented by Waleed Aly Khalil in the 2009 edition of the International Federation of Technical Analysts journal, and presents a fresh view of this market valuable data that is oftenly misunderstood and neglected: VOLUME. With this new approach of "seeing" Volume data, traders can infer more properly market behavior and increase their odds in a winning trade. "The VZO is a leading volume oscillator; its basic usefulnes
      FREE
      INTRODUCTION : The breakout strength meter is a trading tool that is used to identify which currencies are the strongest to breakout, and which currencies are the weakest to breakout. The settings for the indicator are easy, and if you cannot find the settings, please leave a comment The tools are completely free to use Please, if you like the indicator, please leave a comment and rate the indicator in order to develop it
      FREE
      Colored Adaptive Moving Average AMA
      Flavio Javier Jarabeck
      4.86 (7)
      If you like to use traditional Moving Averages (like SMAs and EMAs) to provide your trades for dynamic levels of Support and Resistance, you will love the Adaptive Moving Average (AMA). Created in 1995 by Perry Kaufman and presented to the world in his book " Smarter   Trading :  Improving   Performance   in   Changing   Markets ", the Adaptive Moving Average (also known as KAMA - Kaufman Adaptive Moving Average) has the goal to be the perfect companion for following a trend without noise, but s
      FREE
      Activity Power
      Zoltan Nemet
      4.2 (5)
      Multi time frame, multy currency special swing volume indicator with engulfing waves too. Simpler to use compare to Weis Wave. User don't need to adjust wave size. Just use of the basic or the upper time frames. As a multi time frame indikator user can do  very complex time frame analysyses. As well as a multy currency indicator one can make market sector-segment analysyses. Use with Wckoff principles.
      FREE
      Cybertrade Keltner Channels
      Emanuel Andriato
      4.75 (4)
      Cybertrade Keltner Channels - MT5 Created by Chester Keltner, this is a volatility indicator used by technical analysis. It is possible to follow the trend of financial asset prices and generate support and resistance patterns. In addition, envelopes are a way of tracking volatility in order to identify opportunities to buy and sell these assets. It works on periods longer than the period visible on the chart. All values ​​are available in the form of buffers to simplify possible automations.
      FREE
      Stop Loss with Profit Free Version*. Complete Version here. This utility / expert for MetaTrader 5 modifies the stop loss of all your operations dynamically and automatically to ensure the minimum benefits you want, and be able to operate with or without Take Profit. Maximize your benefits, by being able to trade with Unlimited Take Profit. You will ensure the number of minimum points you want to earn in each operation and the stop loss will be adjusted as long as the benefit of the oper
      FREE
      QuantumAlert Stoch Navigator is a free indicator available for MT4/MT5 platforms, its work is to provide "alerts" when the market is inside "overbought and oversold" regions in the form of "buy or sell" signals. This indicator comes with many customization options mentioned in the parameter section below, user can customise these parameters as needful. Join our   MQL5 group , where we share important news and updates. You are also welcome to join our private channel as well, contact me for the p
      FREE
      Expected Range is a great tool for understanding the possible price deviation from daily open price.  This Indicator can be interpreted as follows --> I want to identify a price level with an "x%" probability of the price revisiting it.  Then you choose these "x%" price levels and the indicator is gonna find them for you.  So for example, if you select value of 15, it means that the indicator is gonna find you a price level which has a 15% chance of price revisiting it.  You can choose up
      FREE
      516/5000 Average volume indicator to calculate the average volume for a given period. Useful as a filter to measure the strength of a trend, or false breaks in support or resistance. It does not give a signal to buy or sell, it only acts as a filter to avoid entering into transactions with a drop in volume, or below-average volume, which may indicate disinterest in trading at the price level. It has only the parameters of period, method of calculating the average and type of volume.
      FREE
      Demo Version of Strategy Manager Plus ! This Demo is a simply view of the Dashboard with the followings strategy :    - if SMA 6 is upper than SMA 18 --> Blue color    - if SMA 6 is lower than SMA 18 --> Red Color No need of the external GUI, Load configuration is not available, no manual trading is available. Visit  https://www.mql5.com/en/market/product/46420  for full version !
      FREE
      Free automatic Fibonacci is an indicator that automatically plots a Fibonacci retracement based on the number of bars you select on the BarsToScan setting in the indicator. The Fibonacci is automatically updated in real time as new highest and lowest values appears amongst the selected bars. You can select which level values to be displayed in the indicator settings. You can also select the color of the levels thus enabling the trader to be able to attach the indicator several times with differe
      FREE
      Logo MT5
      Agus Santoso
      Version MT4 : https://www.mql5.com/fr/market/product/121289 Version MT5 : https://www.mql5.com/fr/market/product/121290 Le script « Logo » est conçu pour afficher un logo ou une image personnalisée en arrière-plan sur un graphique de trading dans MetaTrader 5 (MT5). Ce script permet aux traders de personnaliser leurs graphiques avec des logos ou toute autre image souhaitée. Comment ça marche : Préparation de l'image : Commencez par sélectionner l'image que vous souhaitez afficher comm
      FREE
      VWAP Simple
      Deibson Carvalho
      4.22 (27)
      The Volume Weighted Average Price is similar to a moving average, except volume is included to weight the average price over a period.    Volume-Weighted Average Price [VWAP] is a dynamic, weighted average designed to more accurately reflect  a security’s true average price over a given period . Mathematically, VWAP is the summation of money (i.e., Volume x Price) transacted divided by the total volume over any time horizon, typically from market open to market close. VWAP reflects the capital
      FREE
      This indicator shows colored candles when price are strongly distorted in relation to their averages. A good time for buy can be seen after the closing of a silver candle. The pattern becomes more reliable if the purchase is opened when the price of the candle after the silver   candle is above the maximum price of the silver   candle. A good time for sell can be seen after the closing of a pink candle. The pattern becomes more reliable if the sale is opened when the price of the candle aft
      FREE
      Color Trend
      Bruno Goncalves Mascarenhas
      Combining the best of Price Action , Directional Movement , and Divergence / Convergence analysis, the Candle Color Trend is the easy and reliable way to identify the direction of the trend. The indicator automatically paints the candles according to the premise that the upward trend is defined by prices that form a series of ascending tops and bottoms. On the other hand, the downward trend is defined by prices that form a series of descending tops and bottoms. Color Trend is certainly one
      FREE
      This robot sends Telegram notifications based on the coloring rules of PLATINUM Candle indicator. Example message for selling assets: [SPX][M15] PLATINUM TO SELL 11:45. Example message for buying assets : [EURUSD][M15] PLATINUM TO BUY 11:45 AM. Before enable Telegram notifications  you need to create a Telegram bot, get the bot API Key and also get your personal Telegram chatId. It's not possible to send messages to groups or channels. You can only send messages to your user chatId. You shoul
      FREE
      This indicator measures the largest distance between a price (high or low) and a moving average. It also shows the average distance above and below the moving average. It may come in handy for strategies that open reverse positions as price moves away from a moving average within a certain range, awaiting it to return so the position can be closed. It just works on any symbol and timeframe. Parameters: Moving average period : Period for moving average calculation. Moving average method : You can
      Coral Indi
      Dinh Duong Luong
      Coral trend is   a trend-following indicator that is widely popular among FOREX traders . It is usually used as a confluence with other indicators. It uses combinations of moving averages with complex smoothing formulas! It has two configurable parameters: Coefficient   - smoothing ratio (*) Applied price Calculation: Coral = (-0.064) * B6 + 0.672 * B5 - 2.352 * B4 + 2.744 * B3
      FREE
      Les acheteurs de ce produit ont également acheté
      Trade Assistant MT5
      Evgeniy Kravchenko
      4.38 (165)
      It helps to calculate the risk per trade, the easy installation of a new order, order management with partial closing functions, trailing stop of 7 types and other useful functions. Attention, the application does not work in the strategy tester. Manual, Description, Download demo Line function -   shows on the chart the Opening line, Stop Loss, Take Profit. With this function it is easy to set a new order and see its additional characteristics before opening.   Risk management  - The risk
      Bienvenue sur Trade Manager EA, l’outil ultime de gestion des risques conçu pour rendre le trading plus intuitif, précis et efficace. Ce n’est pas seulement un outil d’exécution d’ordres ; c’est une solution complète pour la planification des trades, la gestion des positions et le contrôle des risques. Que vous soyez débutant, trader expérimenté ou scalpeur ayant besoin d’une exécution rapide, Trade Manager EA s’adapte à vos besoins, offrant une flexibilité sur tous les marchés, des devises et i
      Local Trade Copier EA MT5
      Juvenille Emperor Limited
      4.99 (71)
      Découvrez une expérience exceptionnellement rapide de copie de trades avec le   Local Trade Copier EA MT5 . Avec sa configuration facile en 1 minute, ce copieur de trades vous permet de copier des trades entre plusieurs terminaux MetaTrader sur le même ordinateur Windows ou Windows VPS avec des vitesses de copie ultra-rapides de moins de 0.5 seconde. Que vous soyez un trader débutant ou professionnel, le   Local Trade Copier EA MT5   offre une large gamme d'options pour le personnaliser en fonc
      TradePanel MT5
      Alfiya Fazylova
      4.85 (116)
      Trade Panel est un assistant commercial multifonctionnel. L'application contient plus de 50 fonctions de trading manuel et vous permet d'automatiser la plupart des actions de trading. Avant d'acheter, vous pouvez tester la version Démo sur un compte démo. Démo ici . Instructions complètes ici . Commerce . Vous permet d'effectuer des opérations de trading de base en un clic : Ouvrir les ordres et positions en attente. Ouverture d'une grille d'ordres. Clôturez les ordres et les positions en attent
      Custom Alerts MT5
      Daniel Stein
      5 (2)
      Custom Alerts est un outil polyvalent de surveillance multi-marchés qui identifie les configurations prometteuses sur les huit principales devises (USD, CAD, GBP, EUR, CHF, JPY, AUD et NZD), ainsi que sur le GOLD (XAU), les 28 paires Forex et GOLD basées sur ces devises, et jusqu'à sept indices tels que US30, UK100, WTI, Bitcoin, etc. Il est entièrement personnalisable. L'outil rassemble les données de nos indicateurs FX Power, FX Volume et IX Power et vous informe des événements importants.  
      The product will copy all telegram signal to MT5 ( which you are member) , also it can work as remote copier.  Easy to set up, copy order instant, can work with almost signal formats, image signal,  s upport to translate other language to English Work with all type of channel or group, even channel have "Restrict Saving Content", work with  multi channel, multi MT5 Work as remote copier: with signal have ticket number, it will copy exactly via ticket number. Support to backtest signal. How to s
      Trade Dashboard MT5
      Fatemeh Ameri
      4.96 (52)
      Tired of complex order placement and manual calculations? Trade Dashboard is your solution. With its user-friendly interface, placing orders becomes effortless, by a single click, you can open trades, set stop loss and take profit levels, manage trade lot size, and calculate risk to reward ratios, allowing you to only focus on your strategy. Say goodbye to manual calculations and streamline your trading experience with Trade Dashboard. Download  Demo Version  right now. You can find  Details of
      Telegram To MT5 Receiver
      Levi Dane Benjamin
      4.88 (8)
      Copiez les signaux de n'importe quel canal dont vous êtes membre (y compris les canaux privés et restreints) directement sur votre MT5.  Cet outil a été conçu en pensant à l'utilisateur et offre de nombreuses fonctionnalités nécessaires pour gérer et surveiller les trades. Ce produit est présenté dans une interface graphique conviviale et attrayante. Personnalisez vos paramètres et commencez à utiliser le produit en quelques minutes ! Guide de l'utilisateur + Démo  | Version MT4 | Version Dis
      $450 (-20%) instead of $565 until 11/29 B e sure to watch this video before using A community for users, product discussion, update news, and first line of support  Use Webmoney For payments in cryptocurrencies. How I use this algo tool   Lazy Trader is NOT SUITABLE FOR SCALPING EVERY MINUTE MOVEMENT, ESPECIALLY IN CRYPTO. WITHOUT UNDERSTANDING WHAT IS HAPPENING ON THE CHART, THERE IS NO POINT IN BLINDLY HOPING FOR PROFITS! Lazy Trader does NOT USE openAI chat-gpt-4 technologies, which are ad
      Exp COPYLOT CLIENT for MT5
      Vladislav Andruschenko
      4.08 (24)
      Le copieur commercial pour MT5 est un copieur commercial pour la plate-forme МetaТrader 5   . Il copie les transactions de change   entre       tous les comptes   MT5   -   MT5, MT4   -   MT5 pour la version COPYLOT MT5 (ou MT4   -   MT4 MT5   -   MT4 pour la version COPYLOT MT4) Copieur fiable ! Version MT4 Description complète   +DEMO +PDF Comment acheter Comment installer     Comment obtenir des fichiers journaux     Comment tester et optimiser     Tous les produits de Expforex Vous po
      Trade Manager DaneTrades
      Levi Dane Benjamin
      4.73 (22)
      Trade Manager pour vous aider à entrer et sortir rapidement des transactions tout en calculant automatiquement votre risque. Y compris des fonctionnalités pour vous aider à éviter le sur-trading, le trading de vengeance et le trading émotionnel. Les transactions peuvent être gérées automatiquement et les mesures de performances du compte peuvent être visualisées dans un graphique. Ces fonctionnalités rendent ce panneau idéal pour tous les traders manuels et contribuent à améliorer la plateforme
      MT5 to Telegram Signal Provider est un utilitaire facile à utiliser et entièrement personnalisable qui permet l'envoi de signaux spécifiés vers un chat, un canal ou un groupe Telegram, transformant ainsi votre compte en fournisseur de signaux. Contrairement à la plupart des produits concurrents, il n'utilise pas d'importations DLL. [ Démonstration ] [ Manuel ] [ Version MT4 ] [ Version Discord ] [ Canal Telegram ] Configuration Un guide utilisateur étape par étape est disponible. Aucune connai
      Panneau de trading pour trader en 1 clic.   Travailler avec des positions et des commandes!   Trading à partir du graphique ou du clavier. Avec notre panneau de trading, vous pouvez exécuter des transactions en un seul clic directement depuis le graphique et effectuer des opérations de trading 30 fois plus rapidement qu'avec le contrôle MetaTrader standard. Les calculs automatiques des paramètres et des fonctions rendent le trading plus rapide et plus pratique pour les traders. Des conseils grap
      -25% discount ($149 -> $111) Everything for chart Technical Analysis indicator mt5 in one tool Draw your supply demand zone with rectangle and support resistance with trendline and get alerts to mobile phone or email alert -  Risk reward indicator mt5 Video tutorials, manuals, DEMO download   here .   Find contacts on my   profile . 1.   Extended rectangles and trendlines Object will be extended to the right edge of the chart when price will draw new candles on chart. This is rectangle extend
      Trade Assistant 38 in 1
      Makarii Gubaydullin
      4.89 (18)
      Outil multifonctionnel : plus de 65 fonctions, dont : calcul de lot, price action, facteur R/R, gestionnaire des trades, zones d'offre et de demande Version de démonstration   |   Manuel de l'Utilisateur   |    MT4 L'utilitaire ne fonctionne pas dans le testeur de stratégie : vous pouvez télécharger la version de démonstration ICI pour tester le produit. Contactez-moi   pour toutes questions / idées d'amélioration / en cas de bug trouvé Simplifiez, accélérez et automatisez votre processus de tr
      Cerberus Equity Watcher
      Samuel Bandi Roccatello
      5 (2)
      Cerberus the Equity Watcher est un outil de gestion des risques qui surveille en permanence la valeur de votre compte et empêche les pertes importantes, qu'elles soient causées par des EA défectueux ou des émotions si vous êtes un trader discrétionnaire. Il est extrêmement utile pour les traders systématiques qui s'appuient sur des EA susceptibles de contenir des bogues ou de ne pas fonctionner correctement dans des conditions de marché inattendues. Cerberus vous permet de définir une valeur min
      RiskGuard Management
      MONTORIO MICHELE
      5 (17)
      ATTENTION the expert does not work in strategy tester, for a trial version visit my profile. Manual RiskGuard Management   RiskGuard management was born with the idea of ​​helping traders from their initial journey to becoming expert and aware traders. Compatible with any operating system whether Mac or Windows. The operations panel is integrated into the graph giving the possibility to choose size and position between right and left, while the various buttons light up when they can be used,
      Unlimited Trade Copier Pro MT5 is a tool to copy trade remotely to multiple MT4, MT5 and cTrader accounts at different computers/locations over internet. This is an ideal solution for you if you are a signal provider and want to copy your trades to other receivers globally on your own rules. One provider can copy trades to multiple receivers and one receiver can get trade from multiple providers as well. The provider can even set the subscription expiry for each receiver, so that receiver will n
      YuClusters
      Yury Kulikov
      4.93 (41)
      Attention: You can view the program operation in the free version  YuClusters DEMO .  YuClusters is a professional market analysis system. The trader has unique opportunities to analyze the flow of orders, trade volumes, price movements using various charts, profiles, indicators, and graphical objects. YuClusters operates on data based on Time&Sales or ticks information, depending on what is available in the quotes of a financial instrument. YuClusters allows you to build graphs by combining da
      Trade copier MT5
      Alfiya Fazylova
      4.48 (27)
      Trade Copier est un utilitaire professionnel conçu pour copier et synchroniser les commandesentre les comptes de trading. Les commandes sont copiées du compte/terminal du fournisseur vers le compte/terminal du destinataire, qui sont installés sur le même ordinateur ou vps. Avant d'acheter, vous pouvez tester la version démo sur un compte démo. Version démo ici . Instructions complètes ici . Principales fonctionnalités et avantages: Prend en charge la copie des commandes MT5> MT5, MT4> MT5, MT5>
      DashPlus est un outil de gestion de trading avancé conçu pour améliorer l'efficacité et la performance de vos transactions sur la plateforme MetaTrader 5. Il offre un ensemble complet de fonctionnalités, incluant le calcul des risques, la gestion des ordres, des systèmes de grilles avancés, des outils basés sur les graphiques et des analyses de performance. Fonctionnalités principales 1. Grille de récupération Implémente un système de grille flexible et de moyenne pour gérer les transactions dan
      -25% discount ($199 -> $149) Advanced trading tool: One click smart orders that execute under your conditions Developed by trader for trading community:  position size calculator (lot size), open position after price action, strategy builder, set and forget trading, mobile notifications... Risk Management -  Risk percentage position size calculator, gain percentage, target risk reward ratio, spread and commissions are included in calculations 7 Advanced order types  - Set and forget trading w
      Bots Builder Pro MT5
      Andrey Barinov
      4 (5)
      This is exactly what the name says. Visual strategy builder . One of a kind. Turn your trading strategies and ideas into Expert Advisors without writing single line of code. Generate mql source code files with a few clicks and get your fully functional Expert Advisors, which are ready for live execution, strategy tester and cloud optimization. There are very few options for those who have no programming skills and can not create their trading solutions in the MQL language. Now, with Bots Build
      MT5 To Telegram Copier
      Levi Dane Benjamin
      5 (1)
      Envoyez des signaux entièrement personnalisables de MT5 à Telegram et devenez un fournisseur de signaux ! Ce produit est présenté dans une interface graphique conviviale et visuellement attrayante. Personnalisez vos paramètres et commencez à utiliser le produit en quelques minutes seulement ! Guide de l'utilisateur + Démo  | Version MT4  | Version Discord Si vous souhaitez essayer une démo, veuillez consulter le Guide de l'utilisateur. L'émetteur de MT5 vers Telegram NE fonctionne PAS dans le
      Risk Manager for MT5
      Sergey Batudayev
      4.53 (15)
      Expert Advisor Risk Manager pour MT5 est un programme très important et, à mon avis, nécessaire pour chaque commerçant. Avec cet Expert Advisor, vous pourrez contrôler le risque de votre compte de trading. Le contrôle des risques et des bénéfices peut être effectué à la fois en termes monétaires et en termes de pourcentage. Pour que l'Expert Advisor fonctionne, attachez-le simplement au tableau des paires de devises et définissez les valeurs de risque acceptables dans la devise du dépôt ou
      Grid Manual MT5
      Alfiya Fazylova
      4.88 (16)
      Grid Manual est un panneau de trading permettant de travailler avec une grille d'ordres. L'utilitaire est universel, possède des paramètres flexibles et une interface intuitive. Il fonctionne avec une grille d'ordres non seulement dans le sens des pertes, mais aussi dans le sens de l'augmentation des profits. Le commerçant n'a pas besoin de créer et de maintenir une grille d'ordres, l'utilitaire le fera. Il suffit d'ouvrir une commande et "Grid Manual" créera automatiquement une grille de comman
      KT Equity Protector MT5
      KEENBASE SOFTWARE SOLUTIONS
      5 (1)
      KT Equity Protector EA consistently monitors the account equity and closes all the market and pending orders once the account equity reached a fixed equity stop loss or profit target.  After closing all trading positions, the EA can close all open charts to stop other expert advisors from opening more trading positions. Equity Stop-Loss If your current account balance is $5000 and you set an equity stop loss at $500. In this case, the KT Equity Protector will close all the active and pending
      Le MT5 to Discord Signal Provider est un outil convivial et entièrement personnalisable conçu pour envoyer directement des signaux de trading à Discord. Cet outil transforme votre compte de trading en un fournisseur de signaux efficace. Personnalisez les formats de messages pour qu'ils correspondent à votre style ! Pour plus de facilité, choisissez parmi des modèles pré-conçus et décidez quels éléments du message inclure ou exclure. [ Démo ] [ Manuel ] [ Version MT4 ] [ Version Telegram ] Conf
      Didi Alert Needle Detector
      Alexandre Tadeu Molina
      5 (7)
      EA DIDI  Alert: lecteur d'aiguille du ATM SYSTEMS Êtes-vous à la recherche d’outils pour vous aider à profiter des meilleures opportunités de trading sur les marchés financiers ? Ensuite, DIDI Alert – Agulhadas Detector d'ATM Systems est le seul conseiller sur le marché qui exploite la puissante stratégie de trading Needles Setup de Didi Aguiar avec le DIDI INDEX, contrairement à d'autres conseillers dédiés à cette stratégie. Nous devons savoir que nous disposons d’une variété de ressources.
      Ultimate Trailing Stop EA MT5
      BLAKE STEVEN RODGER
      4.5 (6)
      This EA Utility allows you to manage (with advanced filtering) unlimited open orders (manual or EA) with 16 trailing stop methods: fixed, percent, ATR Exit, Chandelier Exit, Moving Average, Candle High Low Exit, Bollinger Bands, Parabolic, Envelope, Fractal, Ichimoku Kijun-Sen, Alligator, Exit After X Minutes or Bars, RSI and Stochastic. The trailing stop can be either real or virtual, and you can exit fully or with a partial close percent on touch or bar close.  Moreover, you can add (overri
      Plus de l'auteur
      Candle Timer Countdown displays the remaining time before the current bar closes and a new bar forms. It can be used for time management. MT4 version here! Feature Highlights Tracks server time not local time Configurable Text Color and Font Size Optional Visualization of the Symbol Daily Variation Optimized to reduce CPU usage Input Parameters Show Daily Variation: true/false Text Font Size Text Color If you still have questions, please contact me by direct message:  https://www.mql5.com/en
      FREE
      MACD Intraday Trend est un indicateur développé à partir d'une adaptation du MACD original créé par Gerald Appel dans les années 1960. Au cours des années de trading, il a été observé qu'en modifiant les paramètres du MACD avec les proportions de Fibonacci, nous obtenons une meilleure présentation de la continuité des mouvements de tendance, ce qui permet de détecter plus efficacement le début et la fin d'une tendance de prix. En raison de son efficacité à détecter les tendances des prix, il est
      FREE
      Candle Timer Countdown displays the remaining time before the current bar closes and a new bar forms. It can be used for time management. MT5 version here! Feature Highlights Tracks server time not local time Configurable Text Color and Font Size Optional Visualization of the Symbol Daily Variation Optimized to reduce CPU usage Input Parameters Show Daily Variation: true/false Text Font Size Text Color If you still have questions, please contact me by direct message:  https://www.mql5.com/en
      FREE
      La configuration Tabajara a été créée par un trader brésilien connu sous le nom de « L'OGRO de Wall Street ». L'idée de cette configuration est d'indiquer au trader la tendance actuelle des prix et le type d'opération à rechercher dans le graphique. Opération Il le fait par le positionnement de la fermeture des bougies et du VWAP jusqu'à 10h40 et après par la moyenne arithmétique de 20 périodes en peignant les bougies en 4 couleurs possibles : Vert -> Prix en hausse dans une tendance à la h
      FREE
      Pivot Point Fibo RSJ est un indicateur qui trace les lignes de support et de résistance de la journée en utilisant les taux de Fibonacci. Cet indicateur spectaculaire crée jusqu'à 7 niveaux de support et de résistance via Pivot Point en utilisant les taux de Fibonacci. C'est fantastique de voir comment les prix respectent chaque niveau de ce support et de cette résistance, où il est possible de percevoir les points d'entrée/sortie possibles d'une opération. Caractéristiques Jusqu'à 7 nive
      FREE
      MACD Intraday Trend PRO est un indicateur développé grâce à une adaptation du MACD original créé par Gerald Appel dans les années 1960. Au fil des années de négociation, il a été observé qu'en modifiant les paramètres du MACD avec les proportions de Fibonacci, nous obtenons une meilleure présentation de la continuité des mouvements de tendance, ce qui permet de détecter plus efficacement le début et la fin d'une tendance de prix. En raison de son efficacité à détecter les tendances de prix,
      Candle Counter is an indicator that prints the number of candles from the first candle of the day . The first candle of the day will be the number 1 and each new candle will be increased by 1 in this count. Input Parameters Choose from even, odd or all Distance from candle to Print the number Text Font Size Text Font Color If you still have questions, please contact me by direct message:  https://www.mql5.com/en/users/robsjunqueira/
      FREE
      MACD Intraday Trend est un indicateur développé à partir d'une adaptation du MACD original créé par Gerald Appel dans les années 1960. Au cours des années de trading, il a été observé qu'en modifiant les paramètres du MACD avec les proportions de Fibonacci, nous obtenons une meilleure présentation de la continuité des mouvements de tendance, ce qui permet de détecter plus efficacement le début et la fin d'une tendance de prix. En raison de son efficacité à détecter les tendances des prix, il est
      FREE
      Pivot Point Fibo RSJ est un indicateur qui trace les lignes de support et de résistance de la journée en utilisant les taux de Fibonacci. Cet indicateur spectaculaire crée jusqu'à 7 niveaux de support et de résistance via Pivot Point en utilisant les taux de Fibonacci. C'est fantastique de voir comment les prix respectent chaque niveau de ce support et de cette résistance, où il est possible de percevoir les points d'entrée/sortie possibles d'une opération. Caractéristiques Jusqu'à 7 nive
      FREE
      Tabajara Ogro
      JETINVEST
      4.73 (11)
      Setup Tabajara was created by a Brazilian trader known as  "The OGRO of Wall Street" . The idea of this setup is to indicate to the trader the current trend of prices and  the type of operation should be looked for in the graph. Operation It does this through the relation of the closing price position and the     of 20 periods, by painting the candles in 4 possible colors : Green -> Price rising in upward trend (Search entry points for PURCHASE) Black -> Price correcting in Bullish Trend
      FREE
      Weis Waves RSJ
      JETINVEST
      4.5 (8)
      The Weis Waves RSJ Indicator sums up volumes in each wave. This is how we receive a bar chart of cumulative volumes of alternating waves. Namely the cumulative volume makes the Weis wave charts unique. It allows comparing the relation of the wave sequence characteristics, such as correspondence of the applied force (expressed in the volume) and received result (the price progress). If you still have questions, please contact me by direct message:  https://www.mql5.com/en/users/robsjunqueira/
      FREE
      VWAP Fibo Bands RSJ is an indicator that traces the lines of the daily VWAP and from it creates bands using Fibonacci proportions. This spectacular indicator creates 10 band levels through the selected VWAP period using Fibonacci ratios. It is fantastic how the prices respect each level of the bands, where it is possible to realize that almost every time the price closes above / below a level of the bands he will seek the next one. If close above will seek to reach the level above and if close
      FREE
      Vwap RSJ
      JETINVEST
      4.88 (8)
      VWAP RSJ is an indicator that plots the Hourly, Daily, Weekly and Monthly  VWAP Lines. Large institutional buyers and   mutual funds   use the VWAP ratio to help move into or out of stocks with as small of a market impact as possible. Therefore, when possible, institutions will try to buy below the VWAP, or sell above it. This way their actions push the price back toward the average, instead of away from it. Based on this information I developed this indicator that combines 4 types of VWAP T
      FREE
      This simple indicator paints with a darker color on the volume bar when the quantity traded is above the average of select number of periods of the volume itself, highlighting the moments when there was a large volume of deals above the average. It is also possible to use a configuration of four colors where the color tone shows a candle volume strength. The indicator defaults to the simple average of 20 periods, but it is possible to change to other types of averages and periods. If you like
      FREE
      This indicator sums up the difference between the sells aggression and the buys aggression that occurred in each Candle, graphically plotting the waves of accumulation of the aggression volumes.   Through these waves an exponential average is calculated that indicates the direction of the business flow. Note: This indicator DOES NOT WORK for Brokers and/or Markets WITHOUT the type of aggression (BUY or SELL).   Be sure to try our Professional version with configurable features and alerts:  Agr
      FREE
      This indicator calculates the difference between the SELL aggression and the BUY aggression that occurred in each Candle, plotting the balance of each one graphically. Note: This indicator DOES NOT WORK for Brokers and/or Markets WITHOUT the type of aggression (BUY or SELL). Be sure to try our   Professional   version with configurable features and alerts:   Delta Agression Volume PRO Settings Aggression by volume (Real Volume) or by number of trades (Tick Volume) Start of the Aggression De
      FREE
      MACD Intraday Trend PRO est un indicateur développé grâce à une adaptation du MACD original créé par Gerald Appel dans les années 1960. Au fil des années de négociation, il a été observé qu'en modifiant les paramètres du MACD avec les proportions de Fibonacci, nous obtenons une meilleure présentation de la continuité des mouvements de tendance, ce qui permet de détecter plus efficacement le début et la fin d'une tendance de prix. En raison de son efficacité à détecter les tendances de prix,
      This simple indicator paints with a darker color on the volume bar when the quantity traded is above the average of select number of periods of the volume itself, highlighting the moments when there was a large volume of deals above the average. It is also possible to use a configuration of four colors where the color tone shows a candle volume strength. The indicator defaults to the simple average of 20 periods, but it is possible to change to other types of averages and periods. If you like
      FREE
      RENKO PRICE ACTION ATR is an "Expert Advisor" developed through the construction of the Renko Chart where each BRICK has the size calculated through the ATR of the period selected by the user. Renko charts are designed to filter out minor price movements, thus making it easier for traders to focus on important trends. Due to its efficiency in detecting price trends, it is also possible to clearly identify supports and resistances as well as top and bottom divergences, thus making better use of t
      The indicator Supply Demand RSJ PRO calculates and plots the "Supply" and "Demand" zones on the graph, identifying the type of Zone (Weak, Strong, Verified, Proven) and in case of retests of the Zone it shows how many times it was retested. "Supply" Zones are the price zones where more supply than demand has occurred, driving prices down. "Demand" Zones are the price zones where more demand than supply has occurred, pushing prices up. Be sure to try our professional version with configurable f
      Aggression Wave PRO is an indicator developed to monitor the divergence, strength, and continuity of the aggression volume of sell and buy negotiations.  The  Agrression Wave PRO   has features that allow you to view beyond the accumulated delta volume of the day. Note: This indicator DOES NOT WORK for Brokers and/or Markets WITHOUT the type of aggression (BUY or SELL). Cryptocurrencies and Forex do not provide this type of information, that is, it does not work with it. Operation It is pos
      Delta Aggression Volume PRO is an indicator developed to monitor the strength and continuity of the aggression volume of sell and buy negotiations. Note: This indicator DOES NOT WORK for Brokers and/or Markets WITHOUT the type of aggression (BUY or SELL). Cryptocurrencies and Forex do not provide this type of data, that is, it does not work with them. O Delta Agrression Volume PRO has features that allow you to view beyond the delta volume of the day. Operation Multi symbols  (those who pro
      The indicator Supply Demand RSJ PRO calculates and plots the "Supply" and "Demand" zones on the graph, identifying the type of Zone (Weak, Strong, Verified, Proven) and in case of retests of the Zone it shows how many times it was retested. "Supply" Zones are the price zones where more supply than demand has occurred, driving prices down. "Demand" Zones are the price zones where more demand than supply has occurred, pushing prices up. Classification of zones Weak: Price region which, if re-te
      Trend WDO B3
      JETINVEST
      5 (1)
      Trend WDO B3 est un système de trading professionnel créé pour la plate-forme MT5 et optimisé pour fonctionner avec MINI DOLAR INDEX (WDO) sur B3 au BRÉSIL. Le système utilise Fuzzy Logic sur plusieurs périodes (1M, 5M, 15M, 30M, H1, H4, D1) pour identifier la tendance des prix, en appliquant des pondérations dans chaque période en fonction des calculs effectués. Après avoir identifié la tendance, le système positionne un ordre STOP (ACHAT ou VENTE) en fonction de la volatilité moyenne, et lo
      Trend WIN B3
      JETINVEST
      5 (4)
      Trend WIN B3 est un système de trading professionnel créé pour la plate-forme MT5 et optimisé pour fonctionner avec MINI FUTURE INDEX (WIN) sur B3 au BRÉSIL. Le système utilise Fuzzy Logic sur plusieurs périodes (1M, 5M, 15M, 30M, H1, H4, D1) pour identifier la tendance des prix, en appliquant des pondérations dans chaque période en fonction des calculs effectués. Après avoir identifié la tendance, le système positionne un ordre STOP (ACHAT ou VENTE) en fonction de la volatilité moyenne, et l
      SniperBot EURUSD
      JETINVEST
      5 (1)
      L'EA utilise la volatilité, le spread, la fréquence et le timing pour décider quand trader. L'EA utilise la méthode des ordres limités pour ouvrir des positions. Dans ce cas, le Slippage sera au maximum positif à l'exécution des saisies. L'EA utilise la logique Trailing Take Profit, car l'objectif du système est de gagner de l'argent tout en protégeant votre capital. La plupart des transactions sont fermées rapidement, donc comme un tir à la tête d'un tireur d'élite. Caractéristiques principa


      Sniper Major
      JETINVEST
      5 (1)
      L'EA utilise la volatilité, le spread, la fréquence et le timing pour décider quand trader. L'EA utilise la méthode des ordres limités pour ouvrir des positions. Dans ce cas, le Slippage sera au maximum positif à l'exécution des saisies. L'EA utilise la logique Trailing Take Profit, car l'objectif du système est de gagner de l'argent tout en protégeant votre capital. La plupart des transactions sont fermées rapidement, donc comme un tir à la tête d'un tireur d'élite. Caractéristiques princi
      JetBot
      JETINVEST
      This is an EXPERT with a FOCUS on LEARNING and PROFESSIONAL DEVELOPMENT!!! The idea of this product is to commercialize the source code, allowing those who want to develop their own robots, or start a professional activity developing customized experts, to have a reference source code that helps them in the learning and development process. This source code will be increased, that is, new functionalities will be created, thus allowing the project to continue evolving. For every 10 sales a new v
      This is an EXPERT with a FOCUS on LEARNING and PROFESSIONAL DEVELOPMENT!!! The idea of this product is to commercialize the source code, allowing those who want to develop their own robots, or start a professional activity developing customized experts, to have a reference source code that helps them in the learning and development process. This source code will be increased, that is, new functionalities will be created, thus allowing the project to continue evolving. For every 10 sales a new v
      This is an EXPERT with a FOCUS on LEARNING and PROFESSIONAL DEVELOPMENT!!! The idea of this product is to commercialize the source code, allowing those who want to develop their own robots, or start a professional activity developing customized experts, to have a reference source code that helps them in the learning and development process. This source code will be increased, that is, new functionalities will be created, thus allowing the project to continue evolving. For every 10 sales a new v
      Filtrer:
      xingche
      24
      xingche 2023.10.07 09:51 
       

      L'utilisateur n'a laissé aucun commentaire sur la note

      JETINVEST
      281715
      Réponse du développeur Roberto Sant Ana Junqueira 2023.10.08 17:39
      tks
      Nitirojn Vichaikasampong
      97
      Nitirojn Vichaikasampong 2021.07.25 07:36 
       

      good

      JETINVEST
      281715
      Réponse du développeur Roberto Sant Ana Junqueira 2021.07.25 13:36
      tks
      Renan Fernandes Souza
      187
      Renan Fernandes Souza 2021.07.15 11:00 
       

      Esta boleta é uma ferramenta essencial para o trader que quer otimizar as suas operações. Parabéns Roberto, ficou muito bom.

      JETINVEST
      281715
      Réponse du développeur Roberto Sant Ana Junqueira 2021.07.25 13:36
      Muito obrigado.
      Fabio_Novaes
      175
      Fabio_Novaes 2021.06.30 21:40 
       

      L'utilisateur n'a laissé aucun commentaire sur la note

      JETINVEST
      281715
      Réponse du développeur Roberto Sant Ana Junqueira 2021.06.30 23:09
      tks
      Marilise Ravaglio Da Cunha Junqueira
      386
       

      L'utilisateur n'a laissé aucun commentaire sur la note

      JETINVEST
      281715
      Réponse du développeur Roberto Sant Ana Junqueira 2021.06.30 15:59
      Tks for your review.
      FLX700
      16
      FLX700 2021.06.05 16:49 
       

      Roberto, em primeiro lugar parabéns pelo excelente trabalho. Sua ferramenta é excelente, na minha opinião ela é indiscutivelmente a melhor entre as gratuitas, eu a avalio com 4.5 de 5. Gostaria de fazer 3 sugestões/críticas para o aprimoramento da mesma. Eu senti falta de um recurso que para mim é o mais importante que é abrir ordens pelo risco e não apenas por lote. Gostaria de ter a opção "RISK %" pois no meu modo trabalhar essa opção é essencial. Outra coisa que sinto muita falta é o stop e gain poderem ser baseados no ATR o que facilita bastante no gerenciamento. E a terceira é apenas um pequeno detalhe. Acho que a boleta poderia ser um pouco mais estreita, pois acho que ela ocupa muito espaço. Espero que esse comentário possa ajudar nos aprimoramentos futuros. No mais, parabéns pelo trabalho. Forte abraço e sucesso!

      JETINVEST
      281715
      Réponse du développeur Roberto Sant Ana Junqueira 2021.06.05 16:56
      Bom dia. Muito obrigado pelos comentários. Vou rever sobre ser mais estreita, pois na verdade testei com vários ativos de forex, crypto e os daqui do Brasil, e dependendo (principalmente no Dólar e Índice) do tamanho de lote o espaço mínimo era este para que todas as informações ficassem bem visíveis sem ter que reduzir a fonte. Sobre as outras opções elas vão existir na versão PRO que lançarei nos próximos dias.
      Répondre à l'avis