PZ Correlation MT5
- Indicateurs
- PZ TRADING SLU
- Version: 2.2
- Activations: 20
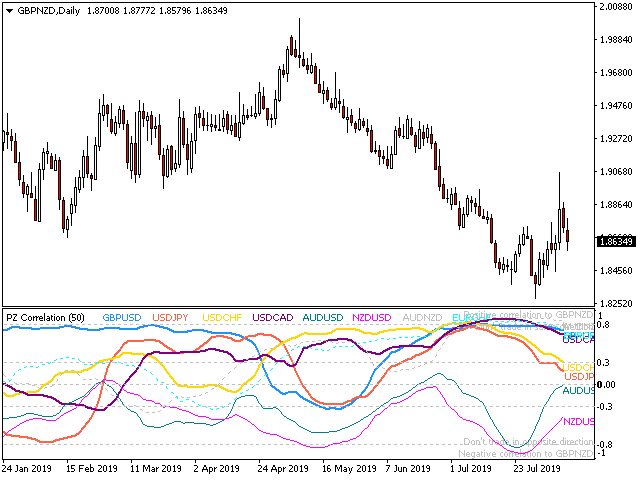
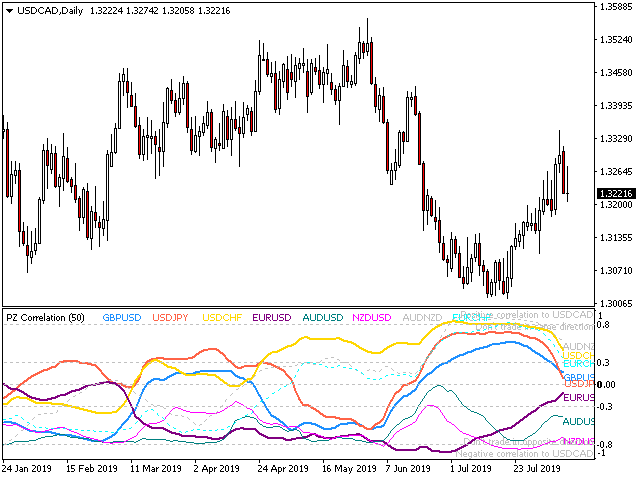
In the world of finance, correlation is a statistical measure of how two securities move in relation to each other. Correlations are used in advanced portfolio management. This indicator measures how different securities move in relation to a reference one, thus making portfolio management easier. [ Installation Guide | Update Guide | Troubleshooting | FAQ | All Products ]
- Avoid concurrent trades in highly correlated instruments
- Find trading opportunities among highly correlated instruments
- Correlation is positive when two securities rise in price together
- Correlation is negative when one security increases and the other decreases
The correlation between two securities is measured by a correlation coefficient.
- A coefficient of zero is neutral correlation
- A coefficient of 0.3 is low positive correlation
- A coefficient over 0.8 is high positive correlation
- A coefficient of -0.3 is low negative correlation
- A coefficient over -0.8 is high negative correlation
The correlation is calculated against the native symbol of the chart, and the symbols to evaluate are entered as parameters.
Input Parameters
- Max History Bars: Amunt of bars to evaluate to the past upon loading.
- Correlation Period: Amount of bars to use to calculate the correlation.
- 1st Symbol to 8th Symbol: Enter the symbols to calculate the correlation.
Author
Arturo López Pérez, private investor and speculator, software engineer and founder of Point Zero Trading Solutions.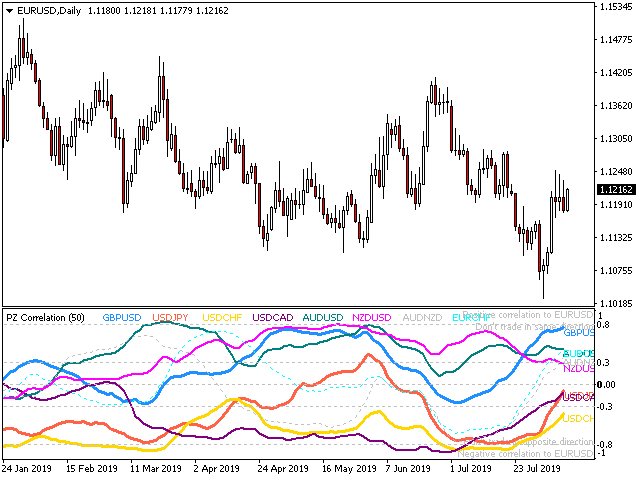

L'utilisateur n'a laissé aucun commentaire sur la note