MR Volume Profile Rectangles 5
- Indicateurs
- Sergey Khramchenkov
- Version: 1.4
- Mise à jour: 6 avril 2023
- Activations: 20
When we settled on the original indicator, we spent a lot of time comparing the volumes with those from the volume profile in NinjaTrader 8 terminal with CQG datafeed. The settings of EURUSD-6E, GBPUSD-6B, AUDUSD-6A and other currency pairs were compared. Over time, we became convinced that we could create an indicator similar to the one in NinjaTrader 8 to meet our needs in the "Masters of Risk" trading system.
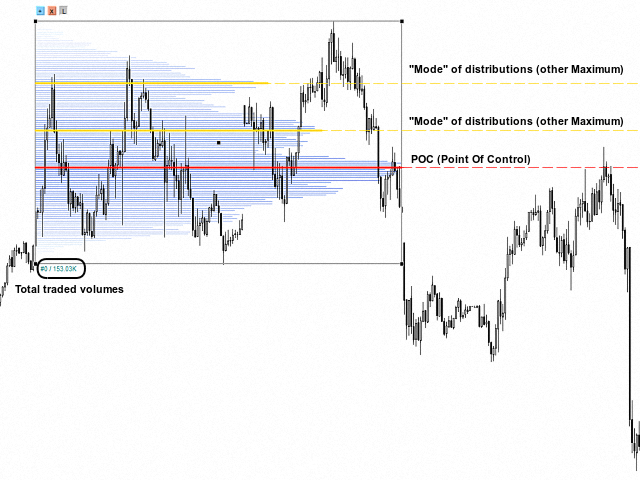
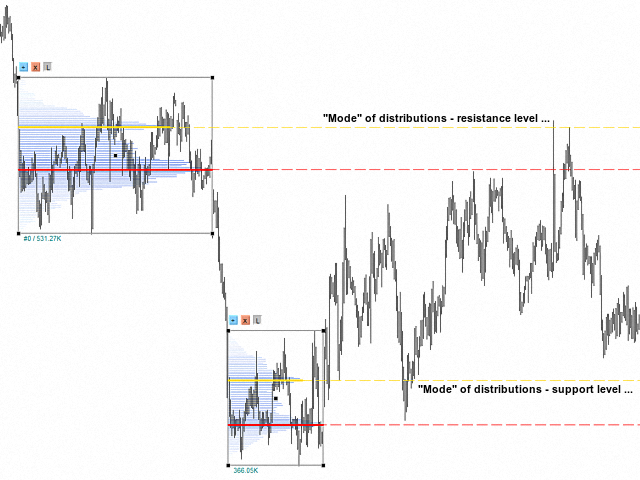
The author of the original indicator, the basis of which we use, chose not to make the indicator according to the classical "Gaussian" distribution, but to show other maximums. These are "Modes" of distributions to use as support and resistance levels. Over time, we became convinced that this approach is quite acceptable and somewhat better than the classical representation of volumes in the "Volume profile". It is important to remember that "Modes" of distributions (other Maximums) over a longer time range have more weight.
The features of our indicator are as follows:
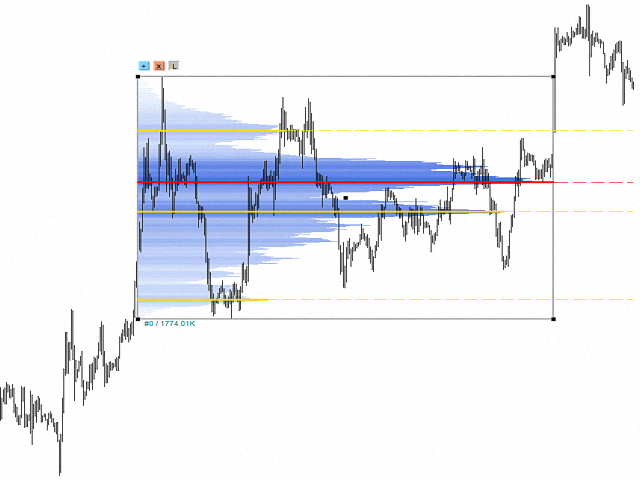
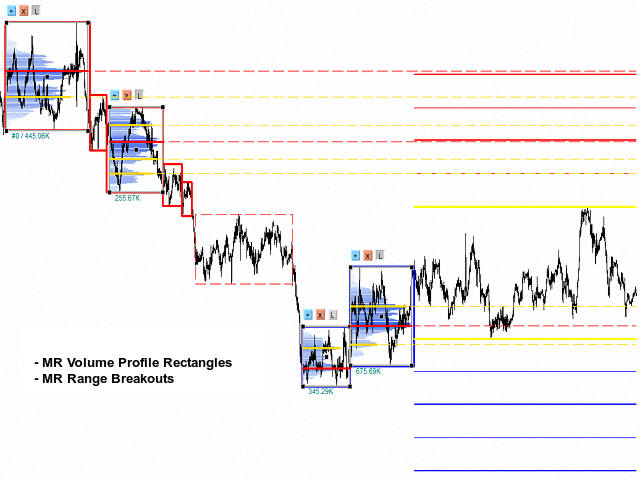
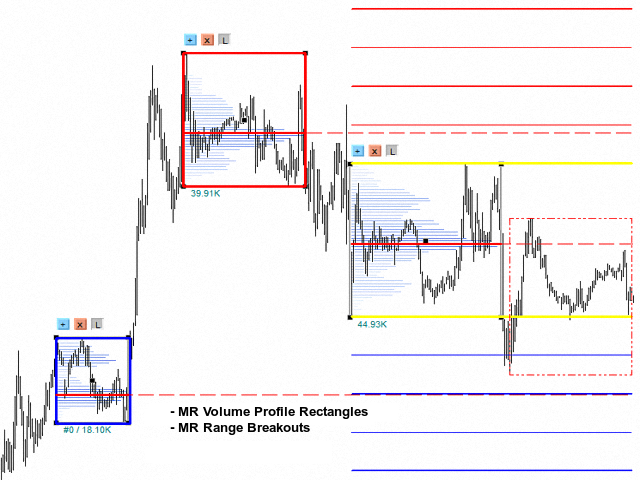
- The indicator shows the total traded volume at each price level that is within the rectangle. The definition of "Point of control" occurs according to the classical formula. VAH and VAL zones are not displayed, but instead we have "Modes" of distributions (other Maximums) to use as support and resistance.
- With the "+" button you can add a profile, and with the "x" button you can delete it.
- Using the "L" button you can continue the levels "POC" and "Modes" of distributions (other Maximums).
- Below the profile rectangle, you can see the sum of the total traded volume in a rectangle.
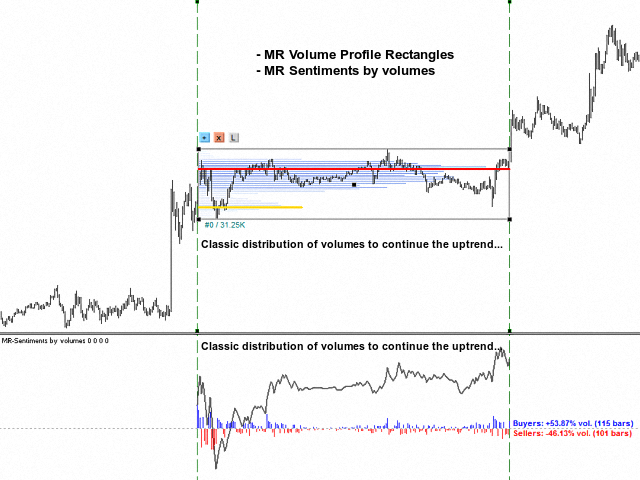
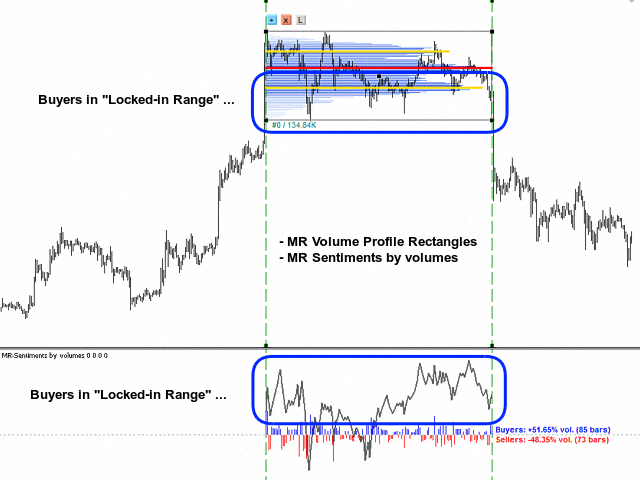
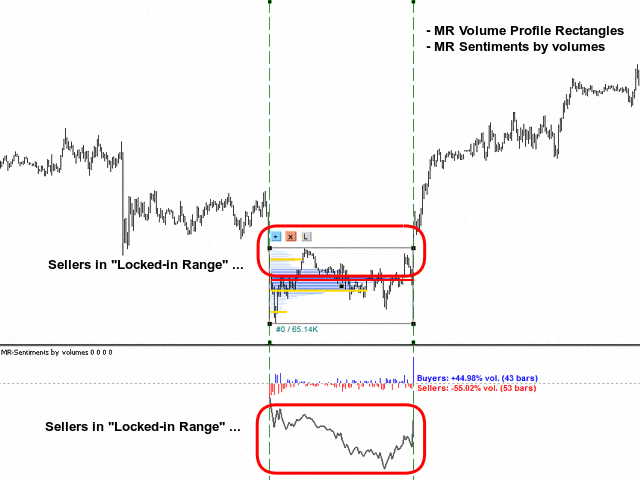
- In combination with the "MR Range Breakouts" indicator, you can see where the places with the highest concentration of open positions in the range are. In "Range of Sellers", buyers remain in "Locked-in Range" - in the area below "POC" volume, while in "Range of Buyers", sellers remain in "Locked-in Range" - in the area above "POC" volume.
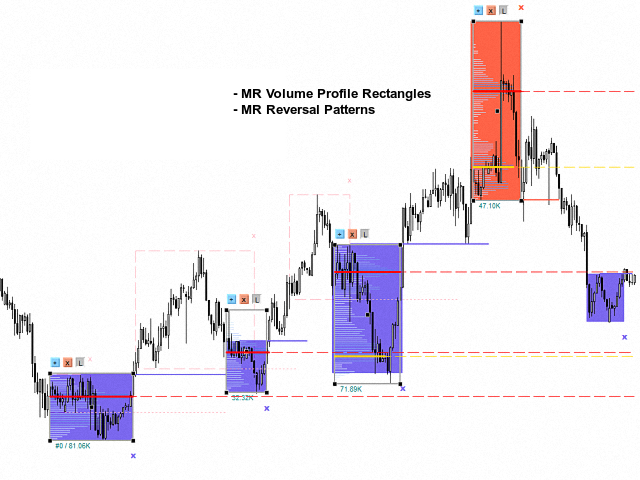
- In combination with the "MR Reversal Patterns" indicator, you can see how the volumes are distributed in the "Reversal Patterns". Volumes in the "Reversal Patterns" structure are like fingerprints.
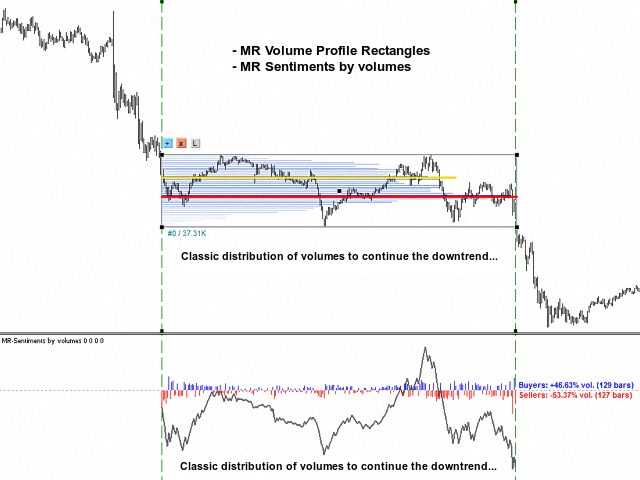
- In combination with the "MR Sentiments by volumes" indicator, you can see the imbalance of volumes in the volume profile.
- "MR Volume Profile Rectangles 5" is based on indicator "VP-Range: Volume Profile (on time range) v6.0. © FXcoder".
If you liked the indicator, please support our work by giving 5 stars!!!
For MetaTrader 4 https://www.mql5.com/en/market/product/63850
Indicator settings:
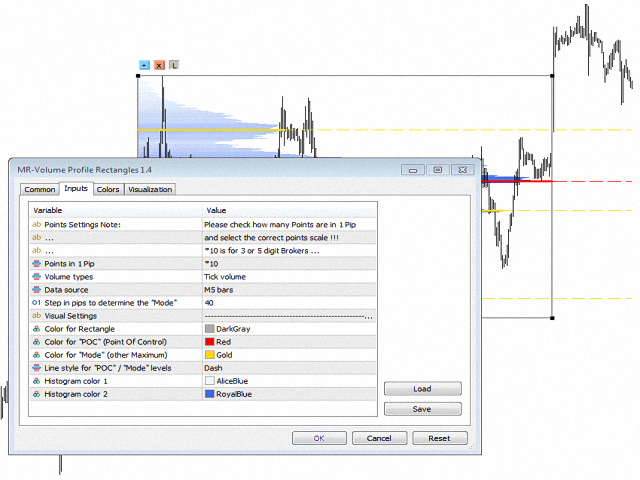
Points in 1 Pip - Provides a choice of the number of Points in 1 Pip.
Volume types - Provides a choice to use "Tic" volumes or "Real" volumes. Note: To use real volumes, your Broker must provide them in the MetaTrader terminal.
Data source - Provides a choice between different data sources. By default, "M5" timeframe data is selected for use. The most accurate data is from the "M1" timeframe, but the amount of this data is limited by the number of bars in the Terminal.
Step in pips to determine the "Mode" - Provides an option to manually enter a pips amount to determine other maximums ("Modes" of distributions). By default, 10 pips is used, but for financial instruments of type NAS100, XAUUSD, BTCUSD and others, you can set the values to 20 or 30 pips. The greater the number of pips to determine the maximums, the more their number is reduced.
Section "Visual Settings"
Color for Rectangle - Color for the rectangle.
Color for "POC" (Point Of Control) - Color for "POC" (Point Of Control).
Color for "Mode" (other Maximum) - Color for "Mode" (other Maximum).
Line style for "POC" / "Mode" levels - Line style for "POC" / "Mode" levels. "Dash" is selected by default.
Histogram color 1 - Histogram color for small amounts of volumes.
Histogram color 2 - Histogram color for large amounts of volumes.

