• Aperçu
  • Avis (2)
  • Commentaires (3)
  • Nouveautés

MR Range Breakouts 5

5
" A trading range occurs when a financial instrument trades between constant high and low prices over a period of time. The upper part of the trading range of a financial instrument often provides price resistance, while the lower part of the trading range usually offers price support.  Traders can enter in the direction of a breakout or breakdown from a trading range... "

This is the "Classical Theory" understanding of ranges. We have a different understanding of the nature of ranges and the processes that occur within them. Therefore, we at "Masters of Risk" created our indicator to cover all our requirements. "MR Range Breakouts" indicator was created from scratch by us according to the author's methodology. It is based on the concept of "Auction Market Theory" developed by J. Peter Steidlmayer and "Locked-in Range" market analysis method developed by Tom Leksey. Both concepts largely overlap with our understanding of the processes in the "Range" and show how market participants interact. Since there is no established terminology for ranges in the "Classical Theory" we will use our own terminology!!!

To give you some idea, we will briefly introduce the processes that take place in the range:
1. When we have two extremes and the price has tested at least 75% of the distance between them in the form of a corrective movement, we say that a “Balance” has been established between buyers and sellers. Usually, the intentions to achieve a "Balance" of prices are known only by the "Big" players in the markets. If the price continues or makes a new impulse, renews one of the extremes and does not return to them again in the form of a correction, we say that the "Balance" is broken and we now have an "Imbalance".
2. If, after reaching a "Balance" between buyers and sellers, the price continues to move between two price extremes, we say that a "Range" has developed between the two price extremes. Here, along with the "Big" market players, the "Professional" traders also enter positions.
3. When the prices remain in the "Range" for a longer time, this "Range" is also seen (perceived) by the "Non-professional" market participants. Usually their stop-losses are placed above or below the boundaries of the "Range". This is where we say we have an "Open Range" because all market participants can actively enter positions and trade the distance between the two extremes that define the upper and lower boundaries of the "Range."
4. When enough participants accumulate in the "Range" with their stop-losses, some of the "Big" players try to close the "Range" of the prices by exiting it at the expense of these stop-losses. If they succeed and then there is a "correction" beyond the "Range", we say that the "Open Range" is locked by these "Big" players and we have a "Range of Buyers" or a "Range of Sellers".
5. If another portion of the "Big" players decide they don't like it and return the price to the "Range" and test a minimum of 75% of the distance between the two extremes that define the boundaries of the "Range", then we say we have an "Extending" of the boundaries of the "Open Range". In this case, the distance between the upper and lower boundaries of the "Open Range" is updated and a new range test distance of 75% is determined.
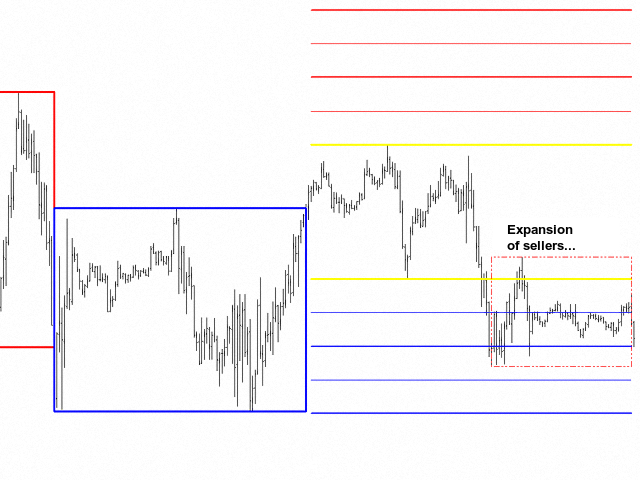
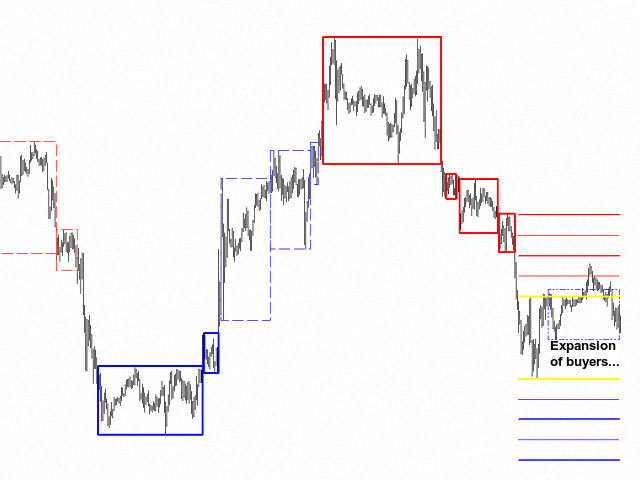
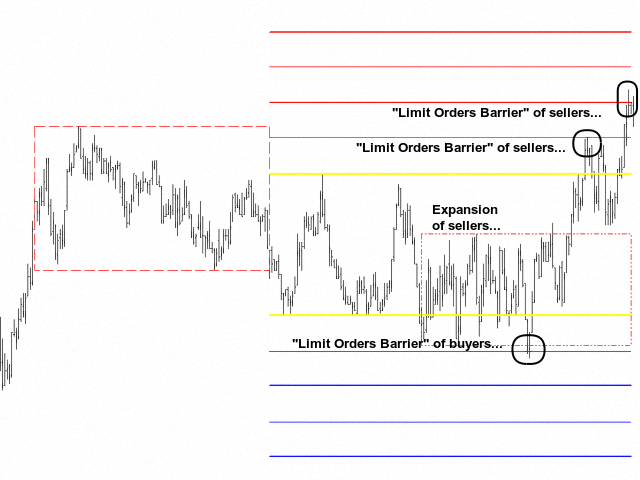
6. If these “Big” players fail to return the price to at least 75% after exiting the range, then we say that there is a struggle for dominance of different groups of "Big" players. This usually happens at the upper or lower boundaries of the "Open Range" and between the "Limit Orders Barriers". Then we say that we have an "Expansion" of sellers or an "Expansion" of buyers.
7. According to our experience with the indicator, the best places to enter a position are in the "Limit Order Barriers" area in the direction of the trend. For example, if we have a downtrend, we are looking for a sell entry in the "Limit Orders Barriers" area of sellers, and accordingly, if we have an uptrend, we are looking for a buy entry in the "Limit Orders Barriers" area of buyers. Of course, all our decisions must be confirmed by other indicators in these zones.

What the indicator shows:
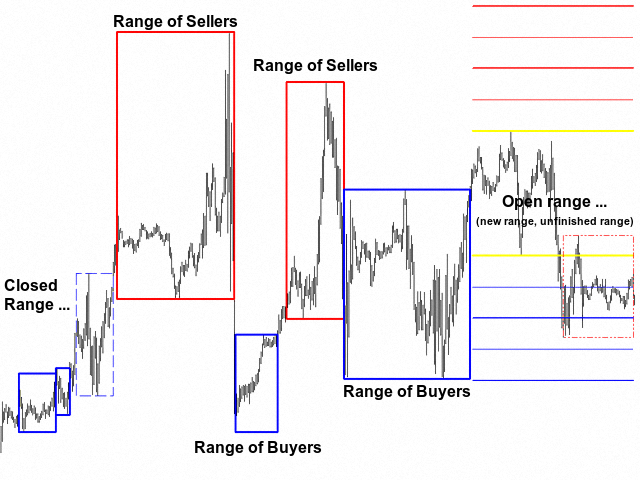
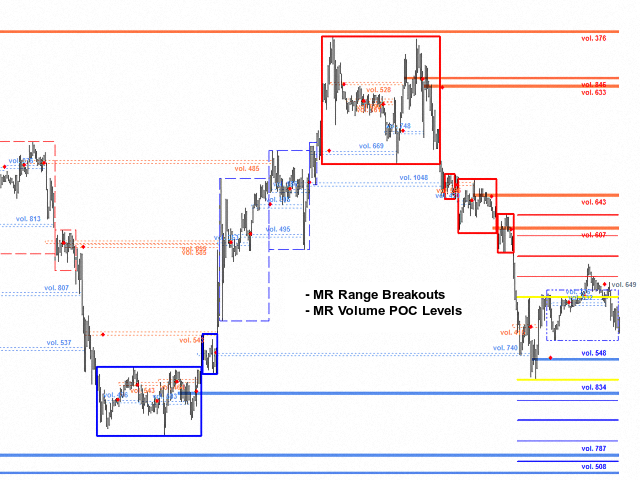
  • "Red" rectangles show "Ranges of Sellers", where buyers remain in "Locked-in Range", and sellers win. If you place a volume profile in "Range of Sellers", in the area below the "POC" volume there are buyers locked in range.
  • "Blue" rectangles show "Ranges of Buyers", where sellers remain in "Locked-in Range", and buyers win. If you place a volume profile in "Range of Buyers", in the area above the "POC" volume there are sellers locked in range.
  • "Dashed" rectangles show closed "Ranges" - the places where the price absorbed the volumes in the Ranges.
  • "Yellow" lines show the upper and lower boundaries of the "Open Range" - it is not yet determined whether this will be a range of buyers or sellers. "Open Range" is a new and not yet finished range. In it, positions are recruited for the "Big" players, there is a struggle for initiative between the "Big" players, various tools are used in the confrontation between them. Unfortunately, this is also the place where "non-professional" market participants lose their money, because they don't understand the processes that go on in the range...
  • "Blue (dash dot dot)" rectangle indicates the beginning of the buyers "Еxpansion" initiative. It shows the struggle between the "Big" players in the market, the potential expansion of the "Open Range" boundary or the possible formation of a new "Open range".
  • "Red (dash dot dot)" rectangle indicates the beginning of the sellers "Еxpansion" initiative. It shows the struggle between the "Big" players in the market, the potential expansion of the "Open Range" boundary or the possible formation of a new "Open range".
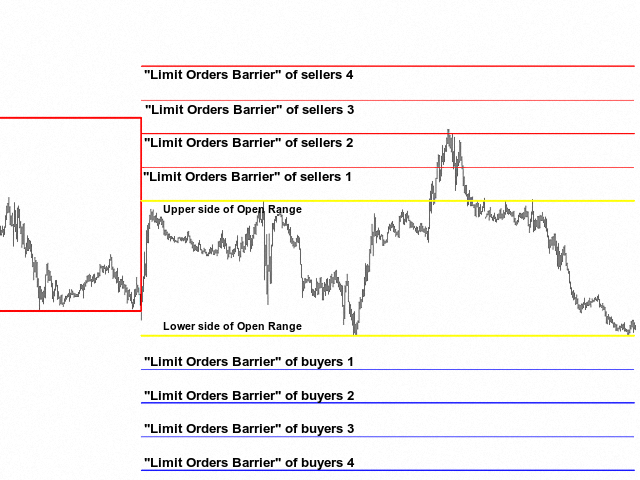
  • "Red" lines above the "Open Range" indicate the possible areas of "Limit Orders Barriers" of sellers.
  • "Blue" lines below the "Open Range" indicate the possible areas of "Limit Orders Barriers" of buyers.
"Limit Orders Barrier is a structure that is designed to restrict price movement in any direction by constantly placing limit orders against the movement. Typically observed above and below accumulation (range, balance)."

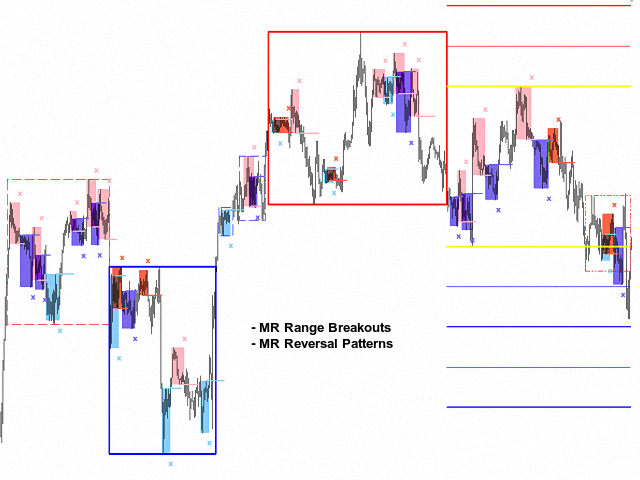
        • In combination with the "MR Reversal Patterns" indicator, you can see how buyers and sellers are distributed in the "Range". Since every trader waits for confirmation that their market entry is correct, the appearance of "Reversal Patterns" in the "Range" forms the accumulation of the open positions in a place, that we define as a "Point of Control" in the Volume Profile of the Range ". During the movement of the price in a trend, you can see how "Balances" are formed according to the "Auction Market Theory".
        • In combination with the "MR Volume POC Levels" indicator, you can see where important volumes are left after the exit from the "Balances" and "Ranges". In addition, you can see how the volumes are absorbed in the "Range" and accumulate positions of buyers and sellers.
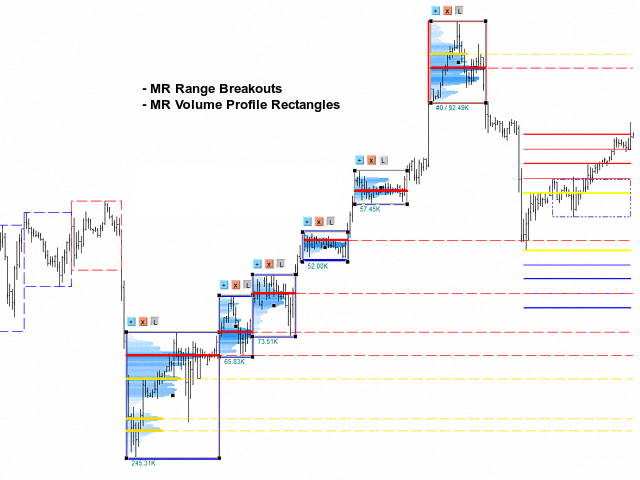
          • In combination with the "MR Volume Profile Rectangles" indicator, you can see where the places with the highest concentration of the open positions. In "Range of Sellers", buyers remain in "Locked-in Range" - in the area below "POC" volume, while in "Range of Buyers", sellers remain in "Locked-in Range" - in the area above "POC" volume.
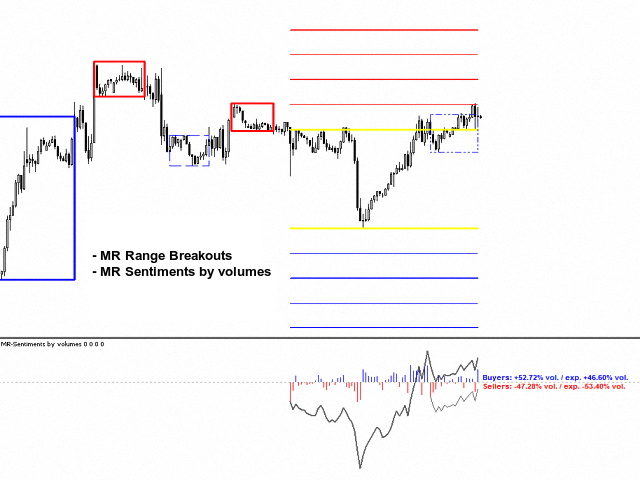
          • In combination with the "MR Sentiments by volumes" indicator, you can see the "Sentiments" inside the range. When we also have an "Expansion" of the sellers or the buyers, you can see the imbalance of all participants in the range to those in the "Expansion".
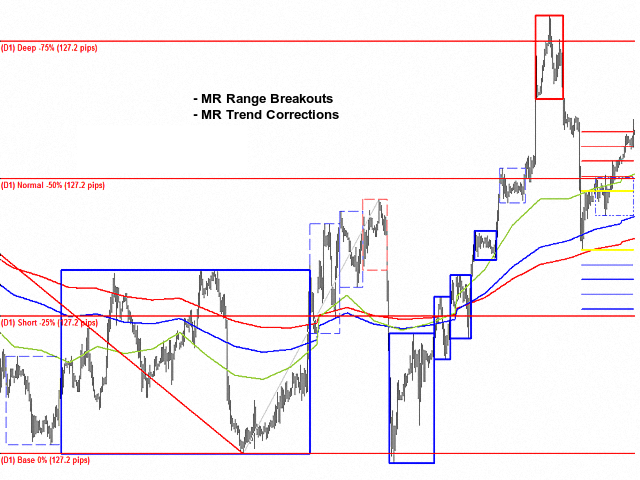
          • In combination with the "MR Trend Corrections" indicator, you can track the places where the volumes accumulate in the "Balances" and "Ranges" along the trend. Then the volumes of these places are absorbed in the "Correction" movements.

          Note:

          The indicator synchronizes the data from the time frames on which it works. Please wait a few seconds when needed...
          There may be slight differences between the figures, that are drawn on the chart of the time frame, that you selected in the indicator settings and the figures, that are drawn on the chart of the smaller time frames. This is related to the decomposition of the bar from the selected time frame to the smaller time frames. The bar of the selected time frame has a different structure of the smaller time frames. This is not a mistake!!! This is the option we have adopted to correctly determine the inputs and outputs of the ranges.

          If you liked the indicator, please support our work by giving 5 stars!!!

          For MetaTrader 4 https://www.mql5.com/en/market/product/63855
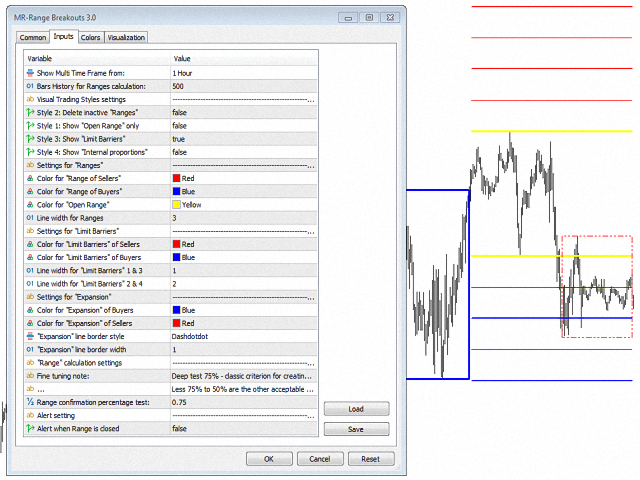

          Indicator settings:

          Show Multi Time Frame from: - Multi time frame on which to calculate the indicator. By default, the indicator works with data from time frame H4.
          Bars History for Ranges calculation: - Number of bars on which the indicator works from multi time frame H4.

          Section "Visual Trading Styles Settings"
          Style 1: Delete inactive "Ranges" - Shows or deletes "Ranges" closed by the price and shown with a dashed line.
          Style 2: Show "Open Range" only - Show only "Open Range" when this option is selected.
          Style 3: Show "Limit Barriers" - Shows or not "Limit Orders Barriers".
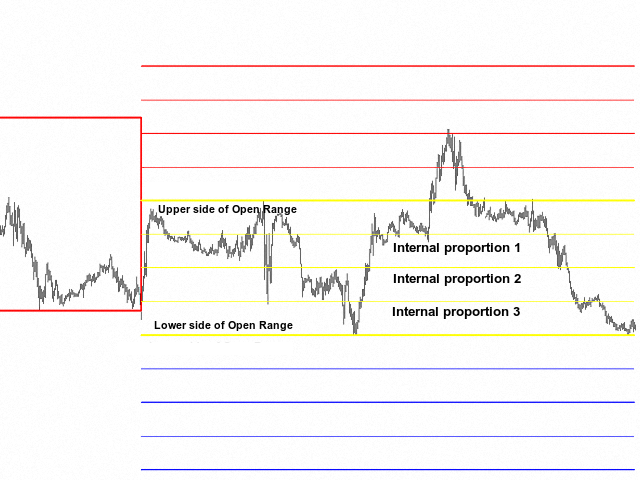
          Style 4: Show "Internal proportions" - Shows or not "Internal proportions" in the "Open Range".

          Section "Settings for Ranges"
          Color for "Range of Sellers" - You can select a color for "Range of Sellers".
          Color for "Range of Buyers" - You can select a color for "Range of Buyers".
          Color for "Open Range" - You can select a color for "Open Range".
          Line width for Ranges - You can select the line width for all non-closed Ranges.

          Section "Settings for Limit Barriers"
          Color for "Limit Barriers" of Sellers - You can select a color for "Limit Orders Barriers" of sellers.
          Color for "Limit Barriers" of Buyers - You can select a color for "Limit Orders Barriers" of buyers.
          Line width for "Limit Barriers" 1 & 3 - You can select the line width for "Limit Orders Barriers" 1 and 3. According to our research, these lines are less important to contain the price movement.
          Line width for "Limit Barriers" 2 & 4 - You can select the line width for "Limit Orders Barriers" 2 and 4. According to our research, these lines are more important to contain the price movement.

          Section "Settings for Expansion"
          Color for "Expansion" of Buyers - You can select a color for "Expansion" of buyers.
          Color for "Expansion" of Sellers - You can select a color for "Expansion" of sellers.
          "Expansion" line border style - You can select the line style for "Expansion".
          "Expansion" line border width - You can select the line width for "Expansion".

          Section "Range calculation settings"
          Range confirmation percentage test: - You can choose another setting to fulfill the "Range" formation criterion. By default, we set the test distance between two extremums equal to 75%. Other acceptable values are to 50%.

          Section "Alert setting"
          Alert when Range is closed - Displays an аlert when a "Range" is closed by the price movement and it is shown with a dashed line.

            Avis 2
            Jason Matthew Scott
            376
            Jason Matthew Scott 2022.07.27 01:02 
             

            Masters of Risk indicators (all 4 in the series) is a serious product for serious traders. MR Reversals are not a quick fix; however, I believe the trading style will work well for any trader willing to put in the work to learn the process and theory behind the indicators and overall trading strategy. More importantly, the developers of the MR indicators stand by their product. Svetoslav has been helping me learn the MR trading strategy - which goes way above and beyond the indicators. We have exchanged nearly 50 emails over the past 30-60 days. I have purchased 25+ indicators to help me get a better handle on institutional-level trading volumes and price action, I believe the MR indicator series is the only product that has put all of the pieces together in one system. As a trader you must still be committed to learning and applying yourself further every day, no tool/indicator will do your job for you. If you want long-term success as a trader - in almost any market - I believe the MR strategy can fill the gaps and provide the solutions for continued success. THANK YOU SVETOSLAV!!

            Enot_B
            46
            Enot_B 2021.11.01 20:12 
             

            Отличный индикатор!

            Produits recommandés
            L'indicateur SMC Venom Model BPR est un outil professionnel pour les traders travaillant dans le concept Smart Money (SMC). Il identifie automatiquement deux modèles clés sur le graphique des prix: FVG   (Fair Value Gap) est une combinaison de trois bougies, dans laquelle il y a un écart entre la première et la troisième bougie. Forme une zone entre les niveaux où il n'y a pas de support de volume, ce qui conduit souvent à une correction des prix. BPR   (Balanced Price Range) est une combinaiso
            Indicateur unique qui met en œuvre une approche professionnelle et quantitative pour signifier le trading de réversion. Il capitalise sur le fait que le prix dévie et revient à la moyenne de manière prévisible et mesurable, ce qui permet des règles d'entrée et de sortie claires qui surpassent largement les stratégies de trading non quantitatives. [ Installation Guide | Update Guide | Troubleshooting | FAQ | All Products ] Des signaux de trading clairs Étonnamment facile à échanger Couleurs et t
            To download MT4 version please click here . - This is the exact conversion from TradingView: "Trend Direction Force Index - TDFI [wm]" By "causecelebre". - The screenshot shows similar results from tradingview and Metatrader when tested on ICMarkets on both platforms. - This indicator uses multiple levels of averaging to detect trend strength. - You can optimize filter low and filter high levels to achieve best results. - You have access to buffers to use in EAs. - This is a light-load processin
            Owl Smart Levels MT5
            Sergey Ermolov
            4 (29)
            Version MT4   |  FAQ L' indicateur Owl Smart Levels est un système de trading complet au sein d'un seul indicateur qui comprend des outils d'analyse de marché populaires tels que les fractales avancées de Bill Williams , Valable ZigZag qui construit la structure d'onde correcte du marché et les niveaux de Fibonacci qui marquent les niveaux exacts d'entrée. sur le marché et les endroits où prendre des bénéfices. Description détaillée de la stratégie Mode d'emploi de l'indicateur Conseiller-Assis
            Noize Absorption Index - is the manual trading system that measures the difference of pressure between bears forces and bulls forces. Green line - is a noize free index that showing curent situation. Zero value of index shows totally choppy/flat market.Values above zero level shows how powerfull bullish wave is and values below zero measures bearish forces.Up arrow appears on bearish market when it's ready to reverse, dn arrow appears on weak bullish market, as a result of reverse expectation.
            Exclusive EA for FOREX HEDGE account The EA (FuzzyLogicTrendEA) is based on fuzzy logic strategies based on the analysis of a set of 5 indicators and filters. Each indicator and filter has a weight in the calculation and, when the fuzzy logic result reaches the value defined in the EA parameter, a negotiation is opened seeking a pre-defined gain. As additional functions it is possible to define maximum spread, stop loss and so on . Recommended Symbol: EURUSD, AUDUSD, GBPUSD, NZDUSD, USDCAD, AUD
            Double HMA MTF for MT5
            Pavel Zamoshnikov
            4 (4)
            This is an advanced multi-timeframe version of the popular Hull Moving Average (HMA) Features Two lines of the Hull indicator of different timeframes on the same chart. The HMA line of the higher timeframe defines the trend, and the HMA line of the current timeframe defines the short-term price movements. A graphical panel with HMA indicator data from all timeframes at the same time . If the HMA switched its direction on any timeframe, the panel displays a question or exclamation mark with a tex
            STRICTLY FOR BOOM INDEX ONLY!!!!! Here I bring the Maximum Trend Arrows OT1.0 MT5 indicator. This indicator is made up of a combination of different trend indicators for entries and exits, for entries an orange arrow will paint on the chart below the current market and a red flag for closing of trades and it produces buy arrows only. When the orange arrow appears, it will appear along with it's sound to notify you. The 1H timeframe is recommended, don't use it anywhere else than on the 1H timefr
            KT Renko Patterns MT5
            KEENBASE SOFTWARE SOLUTIONS
            KT Renko Patterns analyse le graphique Renko brique par brique afin de détecter des figures techniques bien connues, fréquemment utilisées par les traders sur divers marchés financiers. Par rapport aux graphiques basés sur le temps, les Renko offrent une vue épurée, rendant les figures plus faciles à reconnaître et à exploiter. KT Renko Patterns comprend plusieurs figures Renko, dont la majorité sont expliquées en détail dans le livre “Profitable Trading with Renko Charts” de Prashant Shah. Un
            Magic EA MT5
            Kyra Nickaline Watson-gordon
            Magic EA is an Expert Advisor based on Scalping, Elliot Waves and with filters such as RSI, Stochastic and 3 other strategies managed and decided with the robot smartly. Large number of inputs and settings are tested and optimized and embedded in the program thus inputs are limited and very simple. Using EA doesn't need any professional information or Forex Trading Knowledge. EA can trade on all symbols and all time frames, using special and unique strategies developed by the author. The EA w
            Your Trend Friend
            Luigi Nunes Labigalini
            5 (1)
            The trend is your friend! Look at the color of the indicator and trade on that direction. It does not  repaint. After each candle is closed, that's the color of the trend. You can focus on shorter faster trends or major trends, just test what's most suitable for the symbol and timeframe you trade. Simply change the "Length" parameter and the indicator will automatically adapt. You can also change the color, thickness and style of the lines. Download and give it a try! There are big movements w
            Mine Farm
            Maryna Kauzova
            Mine Farm is one of the most classic and time-tested scalping strategies based on the breakdown of strong price levels. Mine Farm is the author's modification of the system for determining entry and exit points into the market... Mine Farm - is the combination of great potential with reliability and safety. Why Mine Farm?! - each order has a short dynamic Stop Loss - the advisor does not use any risky methods (averaging, martingale, grid, locking, etc.) - the advisor tries to get the most
            The Penta-O is a 6-point retracement harmonacci pattern which usually precedes big market movements. Penta-O patterns can expand and repaint quite a bit. To make things easier this indicator implements a twist: it waits for a donchian breakout in the right direction before signaling the trade. The end result is an otherwise repainting indicator with a very reliable trading signal. The donchian breakout period is entered as an input. [ Installation Guide | Update Guide | Troubleshooting | FAQ | A
            Orbit Rage Final 2
            BILLY ARANDUQUE ABCEDE
            Note : i only sell this EA on MQL5, any other sellers is fake. Orbit Rage Final, a cutting-edge trading strategy meticulously designed around the bull/bear candle approach and divergence analysis. This powerful tool is engineered to empower you to shape the life you desire. To embark on this transformative journey, simply download and seamlessly integrate it into your MetaTrader 4 platform by placing it in the experts advisors folder. Orbit Rage Final revolutionizes trading by offering a risk-f
            Le niveau Premium est un indicateur unique avec une précision de plus de 80 % des prédictions correctes ! Cet indicateur a été testé par les meilleurs Trading Specialists depuis plus de deux mois ! L'indicateur de l'auteur que vous ne trouverez nulle part ailleurs ! À partir des captures d'écran, vous pouvez constater par vous-même la précision de cet outil ! 1 est idéal pour le trading d'options binaires avec un délai d'expiration de 1 bougie. 2 fonctionne sur toutes les paires de devises
            - This is the exact conversion from TradingView: "Support/Resistance" By "BarsStallone". - This indicator lets you read the buffers for R/S values. - This is a non-repaint and light processing load indicator. - This is not a multi time frame indicator If you want the multi time frame version you should create a personal order and I deliver two files that you need them both to have the multi time frame indicator running on your system. - The MT4 version of the indicator is not light load from pr
            Matrix Arrow EA MT5
            Juvenille Emperor Limited
            5 (5)
            Matrix Arrow EA MT5  est un conseiller expert unique qui peut échanger les signaux MT5 de l'indicateur Matrix Arrow avec un panneau de commerce sur le graphique, manuellement ou à 100% automatiquement.  Matrix Arrow Indicator MT5  déterminera la tendance actuelle à ses débuts, en rassemblant des informations et des données à partir d'un maximum de 10 indicateurs standard, qui sont: Indice de mouvement directionnel moyen (ADX) Indice de canal de matières premières (CCI) Bougies classiques Heiken
            SolarTrade Suite Financial Robot: LaunchPad Market Expert - conçu pour ouvrir des transactions ! Il s'agit d'un robot de trading qui utilise des algorithmes spéciaux innovants et avancés pour calculer ses valeurs, votre assistant dans le monde des marchés financiers. Utilisez notre ensemble d'indicateurs de la série SolarTrade Suite pour mieux choisir le moment de lancer ce robot. Découvrez nos autres produits de la série SolarTrade Suite en bas de la description. Vous souhaitez naviguer en
            Ola trading 1
            Jose Gabriel Ola
            ¡Gracias a todos por el increíble apoyo que hemos recibido en nuestros canales y redes sociales! Nos enorgullece presentar OLA TRADING 1 , una estrategia patentada y aprobada por la prestigiosa plataforma MetaTrader 5 , herramienta líder en el mundo del trading. Este programa ha sido diseñado con un enfoque avanzado para traders experimentados, combinando lo mejor del análisis técnico con herramientas de inteligencia artificial, permitiendo gestionar capitales y asegurar el éxito en fondeos inde
            To download MT4 version please click here . This is the exact conversion from TradingView: "WaveTrend [LazyBear]" By "zeusuk3". One of the coolest indicators out there to detect overbought and oversold zones. It can be used as a part of more complicated strategy and for confirming a potential trade setup. There are buffers to use in EAs also. The indicator is loaded light and non-repaint. - You can message in private chat for further changes you need. Thanks for downloading 
            The new update makes this indicator a complete tool for studying, analyzing and operating probabilistic patterns. It includes: On-chart Multi-asset percentage monitor. Configurable martingales. Twenty-one pre-configured patterns, including Mhi patterns and C3. An advanced pattern editor to store up to 5 custom patterns. Backtest mode to test results with loss reports. Trend filter. Hit operational filter. Martingale Cycles option. Various types of strategies and alerts. Confluence between patter
            Trend Sentry Pro
            K2021665571 (SOUTH AFRICA)
            Product Description Trend Sentry Pro est un Expert Advisor (EA) entièrement automatisé et sophistiqué, conçu pour tirer parti des tendances haussières grâce à un indicateur de ligne de tendance avancé. L'EA ouvre des positions d'achat lorsque le prix clôture au-dessus de la ligne de tendance, signalant une tendance haussière confirmée, et clôture les transactions lorsque le prix tombe en dessous de la ligne de tendance, indiquant un renversement potentiel de la tendance. Cette approche permet à
            How to use Pair Trading Station Pair Trading Station is recommended for H1 time frame and you can use it for any currency pairs. To generate buy and sell signal, follow few steps below to apply Pair Trading Station to your MetaTrader terminal. When you load Pair Trading Station on your chart, Pair Trading station will assess available historical data in your MetaTrader platforms for each currency pair. On your chart, the amount of historical data available will be displayed for each currency pai
            | Fully-automated Smart Money Concept (ICT) inspired trading solution with multi-strategy capabilities | Built by a grid trader >> for grid traders.  This is MT5 version, click  here  for  Blue CARA MT4  (settings and logics are same in both versions)     Real monitoring signal  -->  Cara Gold Intro Blue CARA EA   ('CARA') - short for  C omprehensive  A lgorithmic   R esponsive   A dvisor is a next-gen  multi-currency    multi-timeframe  EA base on the widely known (and perhaps the most popul
            Wave Trend MT5
            Diego Arribas Lopez
            MT4 Version Wave Trend MT5 Wave Trend is an oscillator, which helps identifing in a extremely accurate manner market reversals. The Oscillator being obove the overbought level and a cross down of the fast into the slow MA usually indicates a good SELL signal. If the oscillators is below the oversold level and the fast MA crosses over the slower MA usually highlights a good BUY signal. The Wave Trend indicator can be also used when divergences appear against the price, indicating the current move
            WanaScalper
            Isaac Wanasolo
            1 (1)
            A scalping indicator based on mathematical patterns, which on average gives signals with relatively small SL, and also occasionally helps to catch big moves in the markets (more information in the video) This indicator has three main types of notifications: The first type warns of a possible/upcoming signal on the next bar The second type indicates the presence of a ready signal to enter the market/open a position The third type is for SL and TP levels - you will be notified every time price re
            The Antique Trend Indicator is a revolutionary trend trading and filtering solution with all the important features of a trend tool built into one tool! The Antique Trend indicator is good for any trader, suitable for any trader both for Forex and binary options. There is no need to configure anything, everything has been perfected by time and experience, it works great during flats and trends. The Antique Trend indicator is a tool for technical analysis of financial markets, reflecting curren
            Range Directional Force Indicator – Designed for You to Optimize! The Range Directional Force Indicator is a cutting-edge tool designed to empower traders by visualizing market dynamics and directional strength. Built to offer insights into market trends and reversals, this indicator is an invaluable asset for traders seeking precision in their strategies. However, it is important to note that this indicator is not optimized, leaving room for you to tailor it to your unique trading preferences.
            Crash 1000 Scalping Indicator for the Crash 1000 Deriv Synthetic Index. Introduction The Crash 1000 Scalping Indicator is a specialized tool designed for the Crash 1000 index on the Deriv Synthetic market. This indicator is particularly useful for scalping on the M1 timeframe, helping traders to identify precise entry and exit points for buy positions. It is designed to be non-repainting, providing clear signals with audible alerts and push notifications, and is compatible with mobile devices th
            ATrend
            Zaha Feiz
            4.77 (13)
            ATREND ATREND : Comment ça fonctionne et comment l'utiliser Comment ça fonctionne L'indicateur "ATREND" pour la plateforme MT5 est conçu pour fournir aux traders des signaux d'achat et de vente robustes en utilisant une combinaison de méthodologies d'analyse technique. Cet indicateur s'appuie principalement sur la plage vraie moyenne (ATR) pour mesurer la volatilité, ainsi que sur des algorithmes de détection de tendance pour identifier les mouvements potentiels du marché. Laissez un message ap
            Les acheteurs de ce produit ont également acheté
            TPSpro RFI Levels MT5
            Roman Podpora
            4.55 (20)
            INSTRUCTIONS       RUS   -   ANGLAIS       Il   est recommandé de l'utiliser avec un indicateur       -       TPSpro   TENDANCE PRO -   Version MT4         Bonus: 6 months of  "RFI SIGNALS"  subscription with your purchase! Un élément clé du trading est constitué par les zones ou les niveaux à partir desquels les décisions d'achat ou de vente d'un instrument de trading sont prises. Malgré les tentatives des principaux acteurs de dissimuler leur présence sur le marché, ils laissent inévitable
            CBT Quantum Maverick Système de Trading Binaire Haute Efficacité CBT Quantum Maverick est un système de trading binaire hautement performant, conçu pour les traders recherchant précision, simplicité et discipline. Aucune personnalisation n'est nécessaire : ce système est optimisé pour des résultats efficaces dès son installation. Avec un peu de pratique, il est facile de maîtriser les signaux. Caractéristiques principales : Précision des signaux : Signaux basés sur la bougie actuelle, ciblant
            Visual Heatmap Book Analyzer
            Alexandre Moraes De Souza Lima
            Visual Heatmap Book Analyser This indicator monitors the market liquidity and generates colors based on order patterns, quantities, and renewal activities in the book. This allows you to visualize the order flow and identify areas of high and low liquidity and activity. The indicator uses machine learning techniques to analyze the order behavior in the book, enabling it to detect patterns and trends in orders, allowing you to make informed decisions about your trading operations. The color pale
            Pro Thunder V10 : L’indicateur ultime pour le trading d’options binaires ! Élevez votre trading à un niveau supérieur avec Pro Thunder V10 , l'apogée du trading d'options binaires ! Propulsé par la technologie avancée de réseaux neuronaux IA , cet indicateur révolutionnaire est conçu pour offrir une précision et une fiabilité inégalées. Des signaux en temps réel qui ne se repeignent pas jusqu’à des performances impeccables, même sur des marchés volatils, Pro Thunder V10 est votre allié
            MetaForecast M5
            Vahidreza Heidar Gholami
            5 (3)
            MetaForecast prédit et visualise l'avenir de n'importe quel marché en se basant sur les harmoniques des données de prix. Bien que le marché ne soit pas toujours prévisible, s'il y a un motif dans les prix, MetaForecast peut prédire l'avenir aussi précisément que possible. Comparé à d'autres produits similaires, MetaForecast peut générer des résultats plus précis en analysant les tendances du marché. Paramètres d'entrée Past size (Taille passée) Spécifie le nombre de barres que MetaForecast util
            PZ Trend Trading MT5
            PZ TRADING SLU
            3.8 (5)
            Capture every opportunity: your go-to indicator for profitable trend trading Trend Trading is an indicator designed to profit as much as possible from trends taking place in the market, by timing pullbacks and breakouts. It finds trading opportunities by analyzing what the price is doing during established trends. [ Installation Guide | Update Guide | Troubleshooting | FAQ | All Products ] Trade financial markets with confidence and efficiency Profit from established trends without getting whip
            RelicusRoad Pro MT5
            Relicus LLC
            4.78 (18)
            Maintenant 147 $ (augmentant à 499 $ après quelques mises à jour) - Comptes illimités (PCS ou Mac) Manuel d'utilisation RelicusRoad + Vidéos de formation + Accès au groupe Discord privé + Statut VIP UNE NOUVELLE FAÇON DE REGARDER LE MARCHÉ RelicusRoad est l'indicateur de trading le plus puissant au monde pour le forex, les contrats à terme, les crypto-monnaies, les actions et les indices, offrant aux traders toutes les informations et tous les outils dont ils ont besoin pour rester rentables
            This indicator is based on the mathematics of the great trader W.D. Ganna. With its help, you can easily find strong levels by analyzing swings to find the optimal entry point. The indicator works on all instruments and all timeframes. The indicator is fully manual and has control buttons. All you need to do is press the NEW button, a segment will appear, which you can place on any movement, swing or even 1 candle that you want to analyze. By placing the segment, press the OK button. A grid (th
            CONTACT US  after purchase to get the Indicator Manual. Try Now—Limited Discount for the next 10 Buyers! Download the  Metatrader 4 Version Read the product description carefully before purchasing the product.  Due to regulatory restrictions, our service is unavailable in certain countries such as India, Pakistan, and Bangladesh. Disclaimer: • Our products are available only on mql5.com. • We never contact anyone or sell our products privately. • We do not provide any personal trading advice.
            This indicator identifies and displays zones, as it were areas of strength, where the price will unfold. The indicator can work on any chart, any instrument, at any timeframe. The indicator has two modes. The indicator is equipped with a control panel with buttons for convenience and split into two modes. Manual mode: To work with manual mode, you need to press the NEW button, a segment will appear. This segment is stretched over the movement and the LVL button is pressed. The level is displayed
            PZ Swing Trading MT5
            PZ TRADING SLU
            5 (5)
            Protect against whipsaws: revolutionize your swing trading approach Swing Trading is the first indicator designed to detect swings in the direction of the trend and possible reversal swings. It uses the baseline swing trading approach, widely described in trading literature. The indicator studies several price and time vectors to track the aggregate trend direction and detects situations in which the market is oversold or overbought and ready to correct. [ Installation Guide | Update Guide | Tro
            LIMITED! JUST 10 COPIES AVAILABLE!  BONUS AUX VIP Club 2024 : Include EA CAP, CEP, LDH, PSC307 & AO4C to enhance the performance of this tool to its maximum potential  Click Here to Download Files   ( for users only ) FREE Trading Education Available Daily via Zoom --- For More Info or Instant Message Click link ---  https://t.me/abcdwave Transform your trading with the "Five Magic Bullets" Indicator, tailored for traders who embrace the power of Elliott Wave Chaos Theory. Spec
            TPA True Price Action indicator reveals the true price action of the market makers through 100% non-repainting signals strictly at the close of a candle! TPA shows entries and re-entries, every time the bulls are definitely stronger than the bears and vice versa. Not to confuse with red/green candles. The shift of power gets confirmed at the earliest stage and is ONE exit strategy of several. There are available now two free parts of the TPA User Guide for our customers. The first "The Basics"
            Elliott Wave Trend was designed for the scientific wave counting. This tool focuses to get rid of the vagueness of the classic Elliott Wave Counting using the guideline from the template and pattern approach. In doing so, firstly Elliott Wave Trend offers the template for your wave counting. Secondly, it offers Wave Structural Score to assist to identify accurate wave formation. It offers both impulse wave Structural Score and corrective wave Structure Score. Structural Score is the rating to sh
            Introduction to Fractal Pattern Scanner Fractal Indicator refers to the technical indicator that makes use of the fractal geometry found in the financial market. Fractal Pattern Scanner is the advanced Fractal Indicator that brings the latest trading technology after the extensive research and development work in the fractal geometry in the financial market. The most important feature in Fractal Pattern Scanner is the ability to measure the turning point probability as well as the trend probabil
            Hello I Want to introduce The Forex Buy Sell Arrow Premium MT5 i recently release this premium indicator! its 1000% Non Repaint Indicator, It Work Perfectly Well,, i tested it day by day, Just mind blowing Result,  Including Powerful trend Algorithm! How It Work? well, it work market trend formula, when trend Bullish Or when trend Bearish,  Recommend Timeframe M30, H1 it work all timeframe, and all currency pair, 100% non repaint, How to take signal From Forex Buy Sell Arrow Premium Ind
            Volume by Price MT5
            Brian Collard
            3.25 (4)
            Volume Profile, Footprint and Market Profile TPO (Time Price Opportunity). Volume and TPO histogram bar and line charts. Volume Footprint charts. TPO letter and block marker collapsed and split structure charts. Static, dynamic and flexible range segmentation and compositing methods with relative and absolute visualizations. Session hours filtering and segment concatenation with Market Watch and custom user specifications. Graphical layering, positioning and styling options to suit the user's a
            Happy entries
            Godwill Fortune Otieno Juma
            The  product gives optimized entries for 3min ,1 hr and day timeframes  Does well with indices  ASIAN- HK50 AND CHINA A50 USA-US30,US100,US500 GER40 ,UK100 For stocks trade with the day timeframes Happy Entry employs advanced algorithms and real-time data analysis to identify optimal entry points with unprecedented accuracy. Its adaptive nature allows it to seamlessly adjust to changing market conditions, ensuring you never miss out on profitable opportunities. Whether you're a beginner or seas
            FxaccurateLS
            Shiv Raj Kumawat
            WHY IS OUR FXACCCURATE LS MT5 THE PROFITABLE ? PROTECT YOUR CAPITAL WITH RISK MANAGEMENT Gives entry, stop and target levels from time to time. It finds Trading opportunities by analyzing what the price is doing during established trends. POWERFUL INDICATOR FOR A RELIABLE STRATEGIES We have made these indicators with a lot of years of hard work. It is made at a very advanced level. Established trends provide dozens of trading opportunities, but most trend indicators completely ignore them! The
            AT Forex Indicator MT5
            Marzena Maria Szmit
            5 (5)
            The AT Forex Indicator MT5 is a sophisticated trading tool designed to provide traders with a comprehensive analysis of multiple currency pairs. This powerful indicator simplifies the complex nature of the forex market, making it accessible for both novice and experienced traders. AT Forex Indicator uses advanced algorithms to detect trends, patterns and is an essential tool for traders aiming to enhance their forex trading performance. With its robust features, ease of use, and reliable signal
            Trade smarter, not harder: Empower your trading with Harmonacci Patterns This is arguably the most complete harmonic price formation auto-recognition indicator you can find for the MetaTrader Platform. It detects 19 different patterns, takes fibonacci projections as seriously as you do, displays the Potential Reversal Zone (PRZ) and finds suitable stop-loss and take-profit levels. [ Installation Guide | Update Guide | Troubleshooting | FAQ | All Products ] It detects 19 different harmonic pri
            TrendMaestro5
            Stefano Frisetti
            note: this indicator is for METATRADER4, if you want the version for METATRADER5 this is the link:  https://www.mql5.com/it/market/product/108106 TRENDMAESTRO ver 2.4 TRENDMAESTRO recognizes a new TREND in the bud, he never makes mistakes. The certainty of identifying a new TREND is priceless. DESCRIPTION TRENDMAESTRO identifies a new TREND in the bud, this indicator examines the volatility, volumes and momentum to identify the moment in which there is an explosion of one or more of these data a
            Elliot Waves Analyzer Pro
            Viktor Weidenthal
            2.67 (3)
            Elliot Waves Analyzer Pro calculates Elliot Waves to Help Identify Trend direction and Entry Levels. Mainly for Swing Trading Strategies. Usually one would open a Position in trend direction for Wave 3 or a Correction for Wave C . This Indicator draws Target Levels for the current and next wave. Most important Rules for Elliot Wave Analysis are verified by the Indicator.  The Pro version analyzes Multiple Timeframes and shows the Subwaves and Target-Levels.   For an Overview  " Elliot Waves Anal
            Introduction to X3 Chart Pattern Scanner X3 Cherart Pattern Scanner is the non-repainting and non-lagging indicator detecting X3 chart patterns including Harmonic pattern, Elliott Wave pattern, X3 patterns, and Japanese Candlestick patterns. Historical patterns match with signal patterns. Hence, you can readily develop the solid trading strategy in your chart. More importantly, this superb pattern scanner can detect the optimal pattern of its kind. In addition, you can switch on and off individu
            VIP Buy Sell Signals
            Hapu Arachchilage Tharindu Lakmal
            Contact me through this email aaddress to download the FREE strategy PDF for this indicator tharindu999lakmal@gmail.com Introduction   The   "Buy Sell Signals"   is designed to provide BUY and SELL trade signals based on the current market conditions.   A   Trading Strategy   (Chee sheet)  has been  provided for this trading indicator.   (Read the description). This indicator has time tuned e ntry signals . so,   you will enter the market at the very best price level   with this indicator .  
            Seconds Charts
            Aleksandr Goryachev
            Micro  ******************* Секундные графики MT5 ********************** Более точного инструмента для входа в сделку вы не найдёте. Входные параметры: Timeframe, sek - период построения графика, секунды Displayed bars - отображаемые бары Step of price levels, pp, 0-off - шаг отрисовки ценовых уровней, пункты Scale points per bar, 0-off - масштаб в пунктах на бар Show lines - отображение текущих уровней Show comment - отображение комментария Standard color scheme - стандартная цветовая сх
            Weis Wave with Alert MT5
            Trade The Volume Waves Single Member P.C.
            4.94 (16)
            Rental/Lifetime Package Options and Privileges  Rent Monthly Six Months   Yearly/Lifetime Weis Wave with Speed with Alert+Speed Index x x x Manual  x x x Quick Set up Video x x x Blog x x x Lifetime Updates x x x Setup and Training Material x x Discord Access Channel "The SI traders"          x Rectangle Break Alert Tool      x How to trade with it:    http://www.tradethevolumewaves.com   ** If you purchase please contact me to setup your  : Two hour  webinar and  training Room and  complet
            DESCRIPTION ICSM (Impulse-Correction SCOB Mapper) est l'indicateur qui analyse le mouvement des prix et identifie les impulsions valides, les corrections et les SCOB (Single Candle Order Block). C'est un outil puissant qui peut être utilisé avec tout type d'analyse technique car il est flexible, informatif, facile à utiliser et améliore considérablement la conscience du trader des zones d'intérêt les plus liquides. PARAMÈTRES Général | Visuels Thème de couleur — définit le thème de couleur
            VTrende Pro
            Andrii Diachenko
            5 (1)
            VTrende Pro - MTF indicator for trend trading with a display panel for MT5 *** Videos can be translated into any language using subtitles (video language - Russian) Although the signals of the VTrende Pro indicator can be used as signals of a full-fledged trading system, it is recommended to use them in conjunction with the Bill Williams TS. VTrende Pro is an extended version of the VTrende indicator. Difference between Pro version and VTrende: - Time zones - Signal V - signal 1-2 waves -    S
            Introduction to Chart Pattern MT Chart Pattern MT is a chart pattern scanner to detect the triangle pattern, falling wedge pattern, rising wedge pattern, channel pattern and so on. Chart Pattern MT uses highly sophisticated chart pattern detection algorithm. However, we have designed it in the easy to use with intuitive user interface. Chart Pattern MT will show all the patterns in your chart in the most efficient format for your trading. You do not have to do tedious manual pattern detection an
            Plus de l'auteur
            MR Reversal Patterns 4
            Sergey Khramchenkov
            5 (2)
            In the "Masters of Risk" trading system, one of the main concepts is related to places where markets change direction. In fact, this is a change in priority and a violation of the trend structure at the extremes of the market, where supposedly there are or would be stop-losses of "smart" participants who are outside the boundaries of the accumulation of volume. For this reason, we call them "Reversal Patterns" - places with a lot of weight for the start of a new and strong trend. Some of the imp
            MR Volume POC Levels 4
            Sergey Khramchenkov
            5 (3)
            The most crucial price level in any "Volume Profile" is the "Point of Control" . Is the price level with the highest traded volume. And mainly, is the level where the big guys start there their positions, so it's an accumulation/distribution level for smart money. The idea of the indicator arose after the "MR Volume Profile Rectangles" indicator was made. When creating the "MR Volume Profile Rectangles" indicator, we spent a lot of time comparing the volumes with those from the volume profile
            The most crucial price level in any "Volume Profile" is the "Point of Control" . Is the price level with the highest traded volume. And mainly, is the level where the big guys start there their positions, so it's an accumulation/distribution level for smart money. The idea of the indicator arose after the "MR Volume Profile Rectangles" indicator was made. When creating the "MR Volume Profile Rectangles" indicator, we spent a lot of time comparing the volumes with those from the volume profile
            MR Reversal Patterns 5
            Sergey Khramchenkov
            5 (2)
            In the "Masters of Risk" trading system, one of the main concepts is related to places where markets change direction. In fact, this is a change in priority and a violation of the trend structure at the extremes of the market, where supposedly there are or would be stop-losses of "smart" participants who are outside the boundaries of the accumulation of volume. For this reason, we call them "Reversal Patterns" - places with a lot of weight for the start of a new and strong trend. Some of the imp
            A "Volume Profile" is an advanced charting indicator that displays total volume traded at every price level over a user specified time period. The main components of the volume profile are POC ( Point Of Control - the price level, at which the maximum number of contracts were executed during a selected period), VAH ( Value Area High - the highest price in the Value Area) and VAL ( Value Area Low - the lowest price in the Value Area). When we settled on the original indicator, we spent a lot of
            MR Range Breakouts 4
            Sergey Khramchenkov
            5 (1)
            " A trading range occurs when a financial instrument trades between constant high and low prices over a period of time. The upper part of the trading range of a financial instrument often provides price resistance, while the lower part of the trading range usually offers price support.  Traders can enter in the direction of a breakout or breakdown from a trading range... " This is the "Classical Theory" understanding of ranges. We have a different understanding of the nature of ranges and the
            MR Dynamic POC 4
            Sergey Khramchenkov
            The most crucial price level in any "Volume Profile" is the "Point of Control" . Is the price level with the highest traded volume. And mainly, is the level where the big guys start there their positions, so it's an accumulation/distribution level for smart money. The idea of the indicator arose after the "MR Volume Profile Rectangles" indicator was made. When creating the "MR Volume Profile Rectangles" indicator, we spent a lot of time comparing the volumes with those from the volume profile
            We publish the indicator as a useful tool in trading and call this indicator the "Swiss Army Knife" because it provides many possibilities and combinations to help understand the material on the "Masters of Risk" trading system. The indicator itself is not part of the tools used in the "Masters of Risk" trading system. The indicator consists of 3 separate multi-timeframe indicators, which in combination with each other help to reduce the "noise" of false signals. The first of the indicators are
            "Sentiments of traders" in the financial markets is a topic that has been of interest to us for a long time. In time, we could not find the right formula to define these sentiments. We went through many stages in the search for the right methodology - from taking data from external sources to calculate open positions of buyers and sellers to calculating tick volumes, but still we were not satisfied with the results. The calculation of open positions of buyers and sellers from external sources ha
            A "Volume Profile" is an advanced charting indicator that displays total volume traded at every price level over a user specified time period. The main components of the volume profile are POC ( Point Of Control - the price level, at which the maximum number of contracts were executed during a selected period), VAH ( Value Area High - the highest price in the Value Area) and VAL ( Value Area Low - the lowest price in the Value Area). When we settled on the original indicator, we spent a lot of
            MR Dynamic POC 5
            Sergey Khramchenkov
            The most crucial price level in any "Volume Profile" is the "Point of Control" . Is the price level with the highest traded volume. And mainly, is the level where the big guys start there their positions, so it's an accumulation/distribution level for smart money. The idea of the indicator arose after the "MR Volume Profile Rectangles" indicator was made. When creating the "MR Volume Profile Rectangles" indicator, we spent a lot of time comparing the volumes with those from the volume profile
            We publish the indicator as a useful tool in trading and call this indicator the "Swiss Army Knife" because it provides many possibilities and combinations to help understand the material on the "Masters of Risk" trading system. The indicator itself is not part of the tools used in the "Masters of Risk" trading system. The indicator consists of 3 separate multi-timeframe indicators, which in combination with each other help to reduce the "noise" of false signals. The first of the indicators are
            "Sentiments of traders" in the financial markets is a topic that has been of interest to us for a long time. In time, we could not find the right formula to define these sentiments. We went through many stages in the search for the right methodology - from taking data from external sources to calculate open positions of buyers and sellers to calculating tick volumes, but still we were not satisfied with the results. The calculation of open positions of buyers and sellers from external sources ha
            Filtrer:
            Jason Matthew Scott
            376
            Jason Matthew Scott 2022.07.27 01:02 
             

            Masters of Risk indicators (all 4 in the series) is a serious product for serious traders. MR Reversals are not a quick fix; however, I believe the trading style will work well for any trader willing to put in the work to learn the process and theory behind the indicators and overall trading strategy. More importantly, the developers of the MR indicators stand by their product. Svetoslav has been helping me learn the MR trading strategy - which goes way above and beyond the indicators. We have exchanged nearly 50 emails over the past 30-60 days. I have purchased 25+ indicators to help me get a better handle on institutional-level trading volumes and price action, I believe the MR indicator series is the only product that has put all of the pieces together in one system. As a trader you must still be committed to learning and applying yourself further every day, no tool/indicator will do your job for you. If you want long-term success as a trader - in almost any market - I believe the MR strategy can fill the gaps and provide the solutions for continued success. THANK YOU SVETOSLAV!!

            Sergey Khramchenkov
            2273
            Réponse du développeur Sergey Khramchenkov 2022.07.28 12:22
            Thank you Jason,
            We try to help as much as we can.
            Enot_B
            46
            Enot_B 2021.11.01 20:12 
             

            Отличный индикатор!

            Sergey Khramchenkov
            2273
            Réponse du développeur Sergey Khramchenkov 2021.11.01 20:56
            Спасибо !!!
            Répondre à l'avis
            Version 3.1 2023.03.29
            - Corrected text in indicator settings.
            Version 3.0 2023.03.28
            - Part of the terminology has been changed.
            - "New Range" has been renamed to "Open Range".
            - The "Open Range" is visualized by upper and lower lines.
            - Added more "Limit Barriers".
            - Added "Expansion of Buyers" and "Expansion of Sellers".
            - Improved some technical details.
            Version 2.0 2021.11.01
            Major upgrade of the indicator.
            The formula for determining the ranges has been rewritten.

            Added:
            1. Automatic determination of the area of limit barriers.
            2. Show a potential new range or potential extension of the existing one.