Hot Level Lines
- Utilitaires
- Mahmood Chazavizadeh
- Version: 2.1
- Mise à jour: 27 février 2021
- Activations: 5
About this indicator
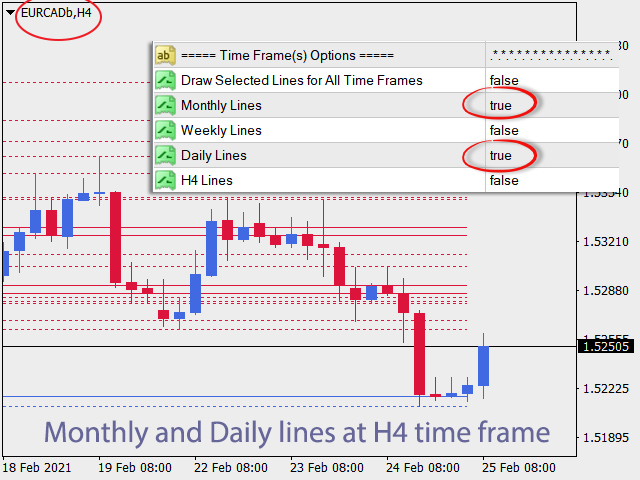
This indicator displays the OHLC values of all selected timeframes for the specified candles number in the form of lines.
____________________________________________________________________________________________________________
What is the idea behind this indicator?
As you know, support/resistance areas provide good trading opportunities for traders.
One of the best ways to detect these areas is to use the High, Low, Close (or even Open) values of the previous candles.
Areas obtained from higher timeframes usually have more power and credibility.
By using this indicator, you can have OHLC values for any number of previous candles, as lines, on your chart.
You can find the area with more credibility by choosing to do the calculation for more candles and overlap the different lines and the density created by them.
____________________________________________________________________________________________________________
Will the chart get too crowded?
Personally, I hate crowded charts!
So after identifying the area, you can easily hide the drawn lines
And
Even better, shift the lines to the left side of the chart as desired.
____________________________________________________________________________________________________________
More customization
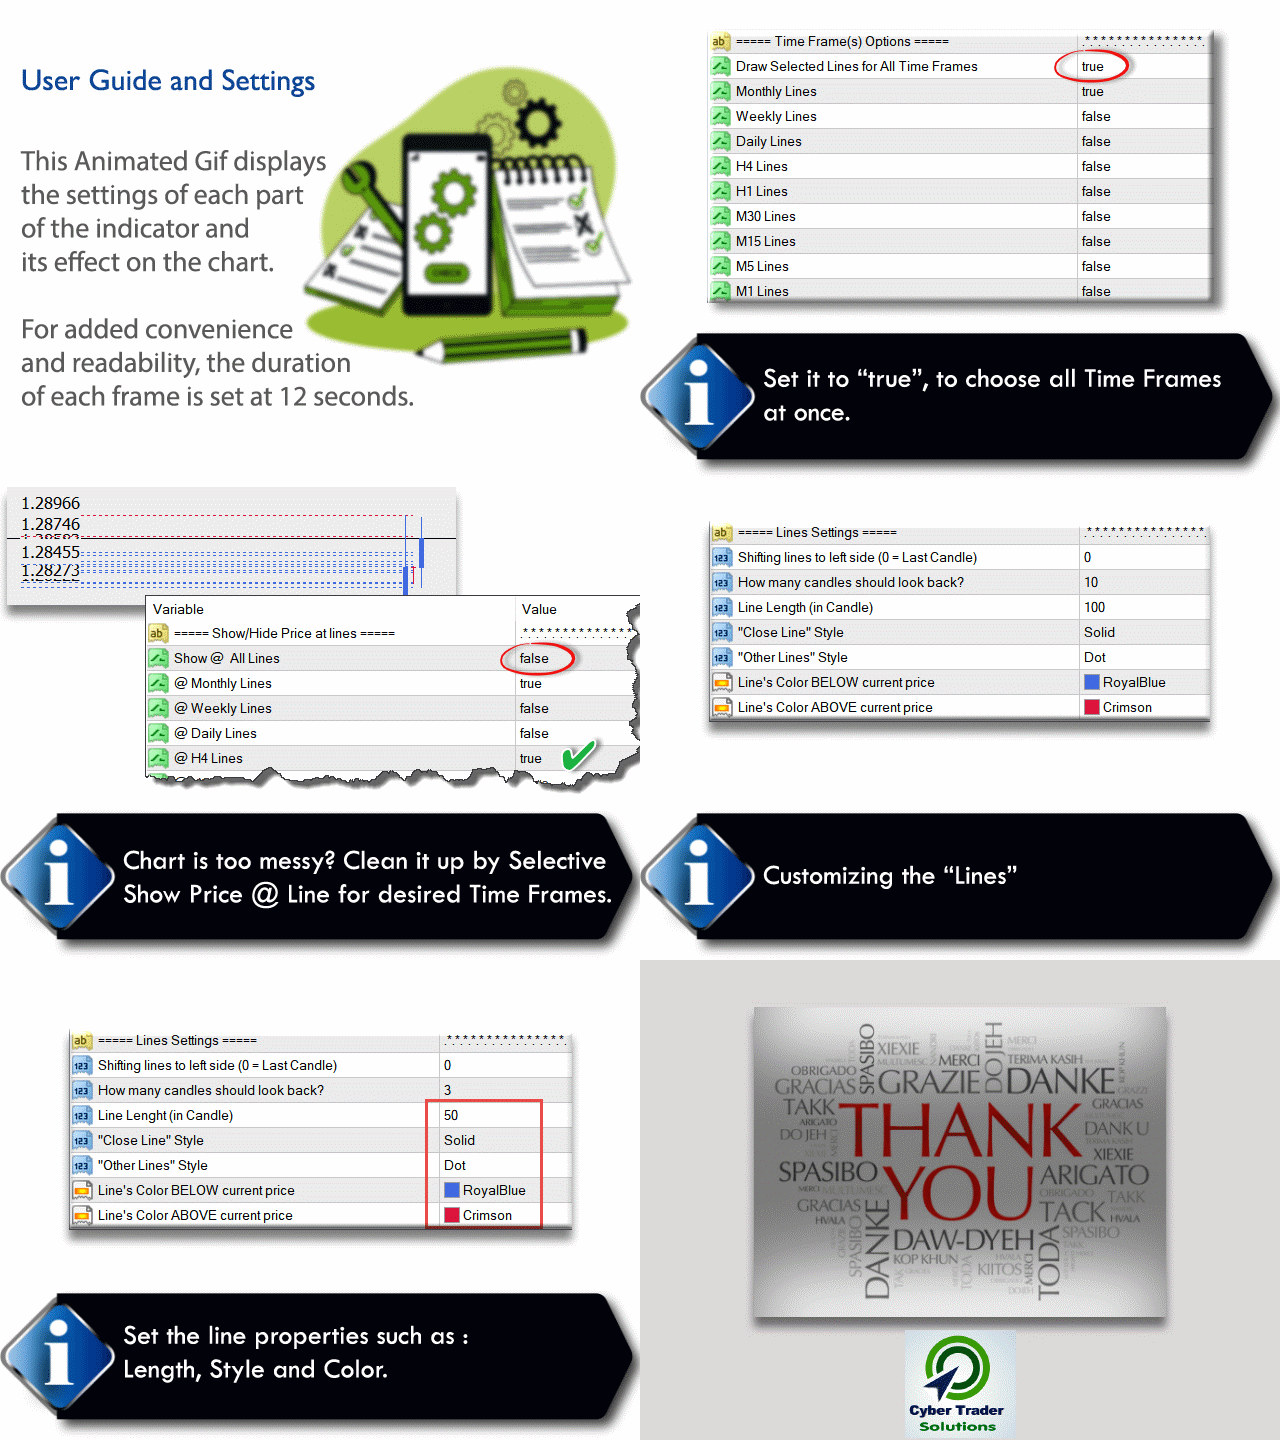
You can customize the drawn lines.
Determine its color, size and length.
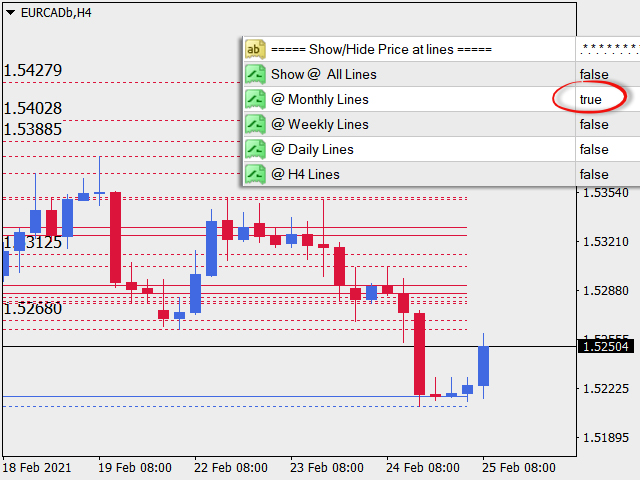
You can also display the price on each of the lines.
____________________________________________________________________________________________________________
How to use?
For this indicator, I have uploaded an Animated Gif file in the Screenshots section and in it,
I have shown the description of each section.
For more convenience and readability, I set the time of each frame to 12 seconds.
