Panda Fractal Breakout
- Indicateurs
- Brian P Cusack
- Version: 3.40
- Mise à jour: 4 mars 2023
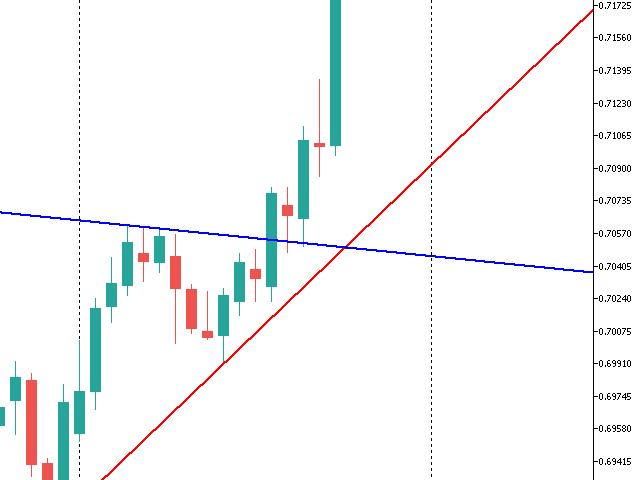
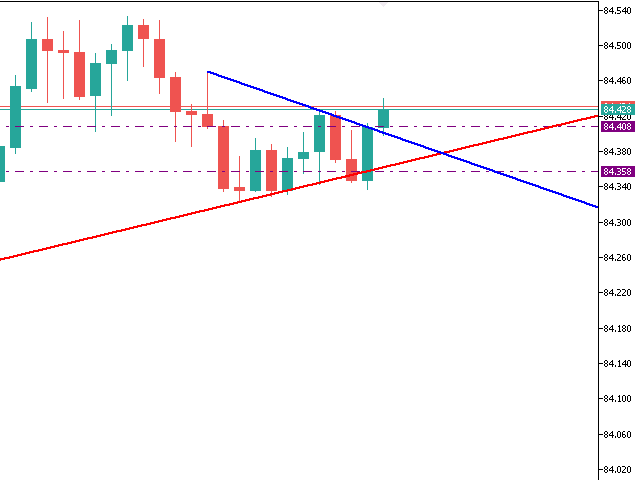
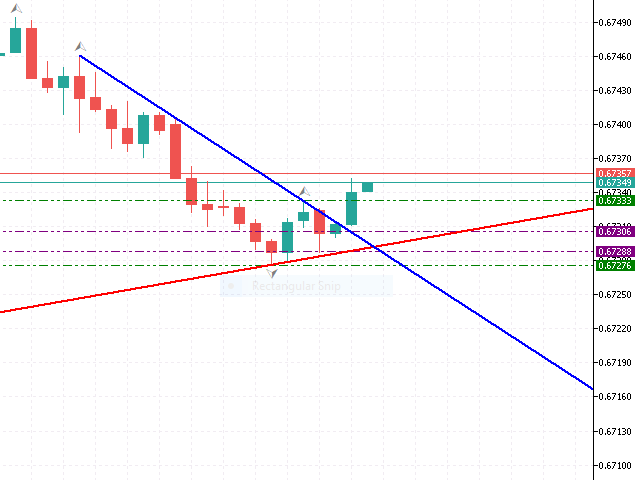
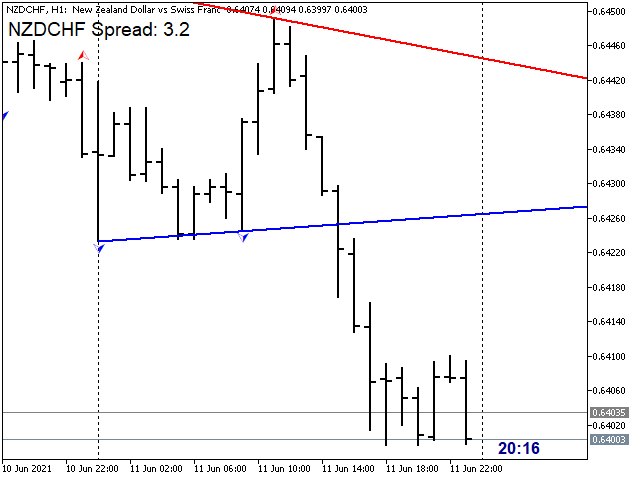
This indicator shows Fractal Breakout Trendlines and Support and Resistance
The Fractal Ascending Trendline and Fractal Descending Trendline are drawn from the last valid fractals. Breakouts can be taken above or below these trendlines. Horizontal lines are drawn from the Last upper and Last lower fractal to show support and resistance levels. Horizontal Upper and Lower Intersection lines are drawn where a fractal trendline has been last intersected, to show where to place a buy or sell order and a stoploss.
-
Easy visualization of fractal lines
-
Fractals show price reversal points
-
Joins two fractal points to show a breakout line
-
Choose how many bars back for fractals
-
Last upper and Last lower fractal horizontal lines
-
Horizontal Intersection upper and lower lines
-
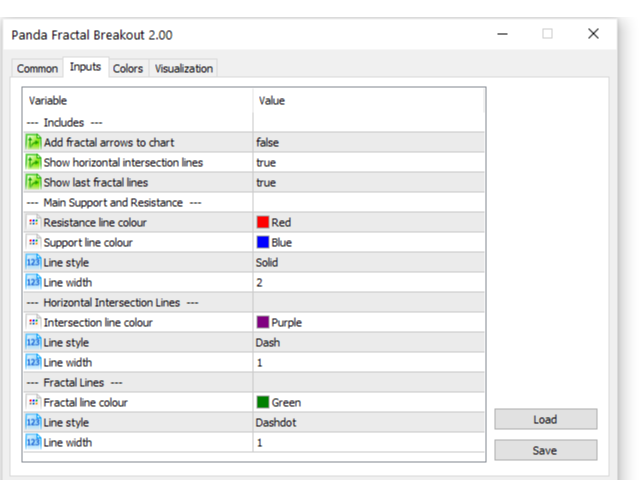
Fractal arrows can be hidden
-
Change the line style, color or width
-
EA access to fractal and line values
How to use
Buys:
-
Fractal Ascending Trendline - Price is above
-
Upper Intersection line - Price is above
-
Upper Fractal line - Place BUY order above
-
Lower Intersection line or Lower Fractal line - Place a stoploss
-
Trailing stop options:
- Lower Fractal line;
- Lower Intersection line; or
- Fractal Ascending Trendline
Sells:
-
Fractal Descending Trendline - Price is below
-
Lower Intersection line - Price is below
-
Upper Fractal line - Place a SELL order below
-
Upper Intersection line or Upper Fractal line - Place a stoploss
-
Trailing stop options:
- Upper Fractal line;
- Upper Intersection line; or
- Fractal Descending Trendline
To read more about fractals see this resource: https://www.investopedia.com/articles/trading/06/fractals.asp
| Panda toolbox: https://www.mql5.com/en/users/briancus/seller |



ok