• Aperçu
  • Avis (10)
  • Commentaires (16)
  • Nouveautés

Candle Counter RSJ

5

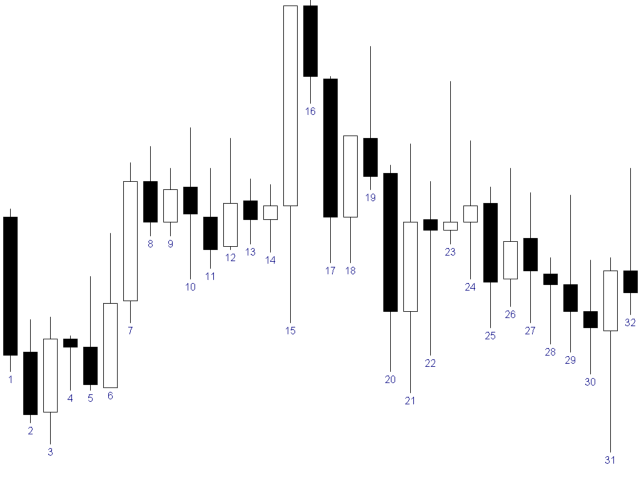
Candle Counter is an indicator that prints the number of candles from the first candle of the day.

The first candle of the day will be the number 1 and each new candle will be increased by 1 in this count.


    Input Parameters

    • Choose from even, odd or all
    • Distance from candle to Print the number
    • Text Font Size
    • Text Font Color


    If you still have questions, please contact me by direct message: https://www.mql5.com/en/users/robsjunqueira/


    Avis 10
    hud_nacar
    14
    hud_nacar 2024.08.07 04:34 
     

    Muito bom cumpriu o objetivo com louvor.

    Eliel Soares
    68
    Eliel Soares 2024.06.10 00:18 
     

    amigo você pode colocar esse contador com o zigzag, no caso ele contando as barras da onda do zigzag, seria excelente pra quem trabalha com a teoria do tempo no mercado, desde já agradeço.

    Σάκης Καρανικόλας
    33
     

    I recently downloaded an indicator for MT5, and I must say it's proven to be an incredibly useful tool for my trading endeavors. What I appreciate most about this indicator is its simplicity and functionality. It has streamlined my trading process and made it much more efficient. The user-friendly interface and straightforward design make it easy for even beginners to navigate. It doesn't overwhelm me with unnecessary features or complex settings, which is a common issue with many trading apps. Instead, it provides the essential tools and information I need to make well-informed decisions. However, if I could suggest one improvement, it would be to have the option to change the starting point for the count. To start from the normal opening of the market (RTH). Overall, I'm quite pleased with this indicator!

    Produits recommandés
    Noize Absorption Index - is the manual trading system that measures the difference of pressure between bears forces and bulls forces. Green line - is a noize free index that showing curent situation. Zero value of index shows totally choppy/flat market.Values above zero level shows how powerfull bullish wave is and values below zero measures bearish forces.Up arrow appears on bearish market when it's ready to reverse, dn arrow appears on weak bullish market, as a result of reverse expectation.
    Double HMA MTF for MT5
    Pavel Zamoshnikov
    3.67 (3)
    This is an advanced multi-timeframe version of the popular Hull Moving Average (HMA) Features Two lines of the Hull indicator of different timeframes on the same chart. The HMA line of the higher timeframe defines the trend, and the HMA line of the current timeframe defines the short-term price movements. A graphical panel with HMA indicator data from all timeframes at the same time . If the HMA switched its direction on any timeframe, the panel displays a question or exclamation mark with a tex
    Owl Smart Levels MT5
    Sergey Ermolov
    4.31 (39)
    Version MT4   |  FAQ L' indicateur Owl Smart Levels est un système de trading complet au sein d'un seul indicateur qui comprend des outils d'analyse de marché populaires tels que les fractales avancées de Bill Williams , Valable ZigZag qui construit la structure d'onde correcte du marché et les niveaux de Fibonacci qui marquent les niveaux exacts d'entrée. sur le marché et les endroits où prendre des bénéfices. Description détaillée de la stratégie Mode d'emploi de l'indicateur Conseiller-Assis
    An indicator of pattern #31 ("Long Island") from Encyclopedia of Chart Patterns by Thomas N. Bulkowski. The second gap is in the opposite direction. Parameters: Alerts - show alert when an arrow appears   Push - send a push notification when an arrow appears (requires configuration in the terminal) GapSize - minimum gap size in points ArrowType - a symbol from 1 to 17 ArrowVShift - vertical shift of arrows in points   ShowLevels - show levels ColUp - color of an upward line ColDn - color of a
    The Penta-O is a 6-point retracement harmonacci pattern which usually precedes big market movements. Penta-O patterns can expand and repaint quite a bit. To make things easier this indicator implements a twist: it waits for a donchian breakout in the right direction before signaling the trade. The end result is an otherwise repainting indicator with a very reliable trading signal. The donchian breakout period is entered as an input. [ Installation Guide | Update Guide | Troubleshooting | FAQ | A
    Stochastic R
    Antony Augustine
    Stochastic  Reversal  allows you to recognize reversals professionally. Stochastic Indicator: This technical indicator was developed by George Lane more than 50 years ago. The reason why this indicator survived for so many years is because it continues to show consistent signals even in these current times. The Stochastic indicator is a momentum indicator that shows you how strong or weak the current trend is. It helps you identify overbought and oversold market conditions within a trend.  Rules
    This indicator uses the metaquotes ZigZag indicator as base to plot fibonacci extension and fibonacci retracement based in the Elliot waves. A fibonacci retracement will be plotted on every wave draw by the ZigZag. A fibonacci extension will be plotted only after the 2nd wave. Both fibonacci will be updated over the same wave tendency. Supporting until 9 consecutive elliot waves. Parameters: Depth: How much the algorithm will iterate to find the lowest and highest candles Deviation: Amoun
    Trend Monitor MT5
    Pavel Zamoshnikov
    3.67 (3)
    The indicator generates early signals basing on ADX reading data combined with elements of price patterns. Works on all symbols and timeframes. The indicator does not redraw its signals. You see the same things on history and in real time. For better visual perception signals are displayed as arrows (in order not to overload the chart). Features The best results are obtained when the indicator works on two timeframes. For example: M30 – the indicator shows the main trend; M5 – the indicator ge
    The new update makes this indicator a complete tool for studying, analyzing and operating probabilistic patterns. It includes: On-chart Multi-asset percentage monitor. Configurable martingales. Twenty-one pre-configured patterns, including Mhi patterns and C3. An advanced pattern editor to store up to 5 custom patterns. Backtest mode to test results with loss reports. Trend filter. Hit operational filter. Martingale Cycles option. Various types of strategies and alerts. Confluence between patter
    The Antique Trend Indicator is a revolutionary trend trading and filtering solution with all the important features of a trend tool built into one tool! The Antique Trend indicator is good for any trader, suitable for any trader both for Forex and binary options. There is no need to configure anything, everything has been perfected by time and experience, it works great during flats and trends. The Antique Trend indicator is a tool for technical analysis of financial markets, reflecting curre
    Time And Sales Delta
    Evgeny Shevtsov
    5 (2)
    The indicator displays the delta and the cumulative delta based on the "Time & Sales" deals list data. In addition to the standard timeframes, the indicator displays data regarding the seconds timeframes (S5, S10, S15, S20, S30) to choose from. Using the rectangle, user can select an arbitrary area in the indicator subwindow to view the ratio of the volumes of deals of buyers and sellers within this area. Indicator features: The indicator works correctly only on those trading symbols for whi
    Renko Gold
    Ignacio Agustin Mene Franco
    Renko Gold! clearly indicates the floors and ceilings where it goes from 4 lines, the line below that marks the floor in green confirming with the thinnest line clarifies the purchase entry, the same is for sale, the top line marks the ceiling and the thinnest red line marks the sale, This indicator works for all temporalities! For Forex and Synthetic Indices markets! It also works for crypto markets! Good profit! World Investor.
    VR Cub MT 5
    Vladimir Pastushak
    VR Cub est un indicateur permettant d'obtenir des points d'entrée de haute qualité. L'indicateur a été développé pour faciliter les calculs mathématiques et simplifier la recherche de points d'entrée dans un poste. La stratégie de trading pour laquelle l'indicateur a été rédigé prouve son efficacité depuis de nombreuses années. La simplicité de la stratégie de trading est son grand avantage, qui permet même aux traders débutants de négocier avec succès avec elle. VR Cub calcule les points d'ouve
    Supply and Demand Indicator + FREE Currency Strength Meter ADD-ON Looking for a powerful tool that can help you identify the most reactive zones in the forex market? Our supply and demand indicator for MetaTrader 4 and 5 is exactly what you need. With its advanced algorithms and real-time analysis, this indicator helps traders of all experience levels make informed trading decisions. The supply and demand indicator is a cutting-edge tool that helps traders identify areas where buyers and sellers
    To download MT4 version please click here . This is the exact conversion from TradingView: "WaveTrend [LazyBear]" By "zeusuk3". One of the coolest indicators out there to detect overbought and oversold zones. It can be used as a part of more complicated strategy and for confirming a potential trade setup. There are buffers to use in EAs also. The indicator is loaded light and non-repaint. - You can message in private chat for further changes you need. Thanks for downloading 
    Supertrend indicator uses a combination of a moving average and average true range to detect the trend of a trading instrument. Supertrend indicator for MetaTrader 5 easily shows the trend as a line following the price. Triple SuperTrend Histo indicator  calculate  three supertrends to show the trend as a histogram. Changing the color from red to green means you can BUY , from green to red means you can SELL . Description of the method of drawing a histogram. The price is above the EMA 20
    Swing Tracer
    Ely Alsedy
    5 (2)
    it depends on ATR period to get swing points to help make better trading decisions  blue dot and red dot is the default color scheme of course you can change it later if you'd like  you can change the following : ATR PERIOD  sending notifications number of times to send notifications  sending notifications to your smart phone that's it very simple to use just drag and drop and follow the trend 
    up down v6 for mt5 is no repaint all timeframe and all pairs indicator. red histogram cros trigger that is up point,and put a red point on histogram. and blue histogram cros trigger that is deep point.and put blue point on histogram. this indicator need to sometimes zoom out .for thise pres + button. if newly comes signal is too high makes before invisible.red and blue points are there.to see the signals. indicator is no repaint and can use all time frame and all pairs. only need minimum 500 bar
    Terra Infinity is a flat indicator. This improved version of the CalcFlat indicator has three additional lines that significantly increase its effectiveness. Unlike its predecessor with two static levels, Terra Infinity adds three dynamic lines above the main histogram, which are interpreted as follows: base signal line, minimum signal line, maximum signal line. These lines are formed using the additional parameter Avg, which is the average value of the histogram. Averaging produces a line
    Il s'agit d'un indicateur MTF des niveaux de support et de résistance basé sur les   extremums de l'indicateur Advanced ZigZag Dynamic   et/ou   Extended Fractals   avec des étiquettes de prix (peut être désactivé). Des TF plus élevés peuvent être sélectionnés pour le mode MTF. Par défaut, les niveaux sont générés en fonction des points indicateurs ZigZag. Les points indicateurs de fractales peuvent également être utilisés avec ZigZag ou à sa place. Afin de simplifier l'utilisation et d'économis
    Liquidity Oscillator
    Paolo Scopazzo
    5 (1)
    A powerful oscillator that provide Buy and Sell signals by calculating the investor liquidity. The more liquidity the more buy possibilities. The less liquidity the more sell possibilities. Please download the demo and run a backtest! HOW IT WORKS: The oscillator will put buy and sell arrow on the chart in runtime only . Top value is 95 to 100 -> Investors are ready to buy and you should follow. Bottom value is 5 to 0 -> Investors are ready to sell and you should follow. Alert + sound will app
    Indicator and Expert Adviser  EA Available in the comments section of this product. Download with Indicator must have indicator installed for EA to work. Mt5 indicator alerts for bollinger band and envelope extremes occurring at the same time. Buy signal alerts occur when A bullish candle has formed below both the lower bollinger band and the lower envelope  Bar must open and close below both these indicators. Sell signal occur when A bear bar is formed above the upper bollinger band and upp
    Le niveau Premium est un indicateur unique avec une précision de plus de 80 % des prédictions correctes ! Cet indicateur a été testé par les meilleurs Trading Specialists depuis plus de deux mois ! L'indicateur de l'auteur que vous ne trouverez nulle part ailleurs ! À partir des captures d'écran, vous pouvez constater par vous-même la précision de cet outil ! 1 est idéal pour le trading d'options binaires avec un délai d'expiration de 1 bougie. 2 fonctionne sur toutes les paires de de
    MetaCOT 2 is a set of indicators and specialized utilities for the analysis of the U.S. Commodity Futures Trading Commission reports. Thanks to the reports issued by the Commission, it is possible to analyze the size and direction of the positions of the major market participants, which brings the long-term price prediction accuracy to a new higher-quality level, inaccessible to most traders. These indicators, related to the fundamental analysis, can also be used as an effective long-term filter
    The indicator Supply Demand RSJ PRO calculates and plots the "Supply" and "Demand" zones on the graph, identifying the type of Zone (Weak, Strong, Verified, Proven) and in case of retests of the Zone it shows how many times it was retested. "Supply" Zones are the price zones where more supply than demand has occurred, driving prices down. "Demand" Zones are the price zones where more demand than supply has occurred, pushing prices up. Be sure to try our professional version with configurable f
    Candlestick Pattern Detector
    Adhemar Braganca Correa Travassos
    This indicator can identify more than 60 candlestick patterns on the chart, including their bullish and bearish variants. Just choose the pattern you want in the settings. Available Patterns 2 Crows Gravestone Doji On Neck 3 Black Crows Hammer Piercing 3 Inside Hanging Man Rick Shawman 3 Line Strike Harami Rising and Falling Three Method 3 Outside Harami Cross Separating Lines 3 Stars in South High Wave Shooting Star 3 White Soldiers Hikkake Short Line Abandoned Baby Hikkake Modified Spinning
    Tout d'abord, il convient de souligner que cet outil de trading est un indicateur non repeint, non redessiné et non retardé, ce qui le rend idéal pour le trading professionnel. Cours en ligne, manuel utilisateur et démonstration. L'indicateur Smart Price Action Concepts est un outil très puissant à la fois pour les nouveaux et les traders expérimentés. Il regroupe plus de 20 indicateurs utiles en un seul, combinant des idées de trading avancées telles que l'analyse du trader Inner Circle et
    KT Horizontal Lines MT5
    KEENBASE SOFTWARE SOLUTIONS
    In MetaTrader, plotting multiple   horizontal lines   and then tracking their respective price levels can be a hassle. This indicator automatically plots multiple horizontal lines at equal intervals for setting price alerts, plotting support and resistance levels, and other manual purposes. This indicator is suitable for Forex traders who are new and looking for chances to make quick profits from buying and selling. Horizontal lines can help traders find possible areas to start trading when the
    This indicator obeys the popular maxim that: "THE TREND IS YOUR FRIEND" It paints a Blue line for BUY and also paints a RED line for SELL. (you can change the colors). It gives alarms and alerts of all kinds. IT DOES NOT REPAINT COLOR and can be used for all currency pairs and timeframes. Yes, as easy and simple as that. Even a newbie can use it to make great and reliable trades. https://www.mql5.com/en/market/product/115553
    Ichimoku Aiko MTF
    Michael Jonah Randriamampionontsoa
    Ichimoku Aiko MTF is a collection of technical indicators that show support and resistance levels, as well as momentum and trend direction. It is a multi-timeframe indicator so you don't need to change the chart timeframe when you want to see the ichimoku clouds on a higher timeframe.  eg. The chart timeframe is M15 and you want to see on the M15 timeframe chart the H1 ichimoku indicators (the ichimoku in Metatrader can't do that) that's why you need to use Ichimoku Aiko MTF.
    Les acheteurs de ce produit ont également acheté
    Atomic Analyst MT5
    Issam Kassas
    4.79 (19)
    Tout d'abord, il convient de souligner que cet indicateur de trading n'est ni repainting, ni redrawing et ne présente aucun délai, ce qui le rend idéal à la fois pour le trading manuel et automatisé. Manuel de l'utilisateur : réglages, entrées et stratégie. L'Analyste Atomique est un indicateur d'action sur les prix PA qui utilise la force et le momentum du prix pour trouver un meilleur avantage sur le marché. Équipé de filtres avancés qui aident à éliminer les bruits et les faux signaux, et à
    Tout d'abord, il convient de souligner que ce système de trading est un indicateur non repeint, non redessiné et non retardé, ce qui le rend idéal pour le trading manuel et automatisé. Cours en ligne, manuel et téléchargement de préréglages. Le "Système de Trading Smart Trend MT5" est une solution de trading complète conçue pour les traders débutants et expérimentés. Il combine plus de 10 indicateurs premium et propose plus de 7 stratégies de trading robustes, ce qui en fait un choix polyvalent
    Gold Stuff mt5
    Vasiliy Strukov
    4.9 (183)
    Gold Stuff mt5 est un indicateur de tendance conçu spécifiquement pour l'or et peut également être utilisé sur n'importe quel instrument financier. L'indicateur ne se redessine pas et ne traîne pas. Délai recommandé H1. Contactez-moi immédiatement après l'achat pour obtenir les réglages et un bonus personnel !   Vous pouvez obtenir une copie gratuite de notre indicateur Strong Support et Trend Scanner, veuillez envoyer un message privé. moi!   RÉGLAGES Dessiner la flèche - on off. dessine
    TPSpro RFI Levels MT5
    Roman Podpora
    4.67 (9)
    Reversal First Impulse levels (RFI)      INSTRUCTIONS        RUS       -       ENG              R ecommended to use with an indicator   -   TPSpro  TREND PRO -  Version MT4                 A key element in trading is zones or levels from which decisions to buy or sell a trading instrument are made. Despite attempts by major players to conceal their presence in the market, they inevitably leave traces. Our task was to learn how to identify these traces and interpret them correctly. Main functi
    TPSproTREND PrO MT5
    Roman Podpora
    4.89 (9)
    TPSpro TREND PRO  - is a trend indicator that automatically analyzes the market and provides information about the trend and each of its changes, as well as giving signals for entering trades without redrawing! The indicator uses each candle, analyzing them separately. referring to different impulses - up or down impulse. Exact entry points into transactions for currencies, crypto, metals, stocks, indices!  Version MT4               DETAILED DESCRIPTION               R ecommended to use with an
    Trend Screener Pro MT5
    STE S.S.COMPANY
    4.88 (67)
    Indicateur de tendance, solution unique révolutionnaire pour le trading et le filtrage des tendances avec toutes les fonctionnalités de tendance importantes intégrées dans un seul outil ! Il s'agit d'un indicateur multi-période et multi-devises 100 % non repeint qui peut être utilisé sur tous les symboles/instruments : forex, matières premières, crypto-monnaies, indices et actions. Trend Screener est un indicateur de suivi de tendance efficace qui fournit des signaux de tendance fléchés avec des
    Quantum Trend Sniper
    Bogdan Ion Puscasu
    4.92 (48)
    Présentation       Quantum Trend Sniper Indicator   , l'indicateur révolutionnaire MQL5 qui transforme la façon dont vous identifiez et négociez les inversions de tendance ! Développé par une équipe de traders expérimentés avec une expérience commerciale de plus de 13 ans,       Indicateur Quantum Trend Sniper       est conçu pour propulser votre parcours de trading vers de nouveaux sommets grâce à sa manière innovante d'identifier les inversions de tendance avec une précision extrêmement élevée
    Atbot
    Zaha Feiz
    4.95 (20)
    AtBot : Comment ça fonctionne et comment l'utiliser ### Comment ça fonctionne L'indicateur "AtBot" pour la plateforme MT5 génère des signaux d'achat et de vente en utilisant une combinaison d'outils d'analyse technique. Il intègre la Moyenne Mobile Simple (SMA), la Moyenne Mobile Exponentielle (EMA) et l'indice de la Plage Vraie Moyenne (ATR) pour identifier les opportunités de trading. De plus, il peut utiliser des bougies Heikin Ashi pour améliorer la précision des signaux. Laissez un avis ap
    FX Power MT5 NG
    Daniel Stein
    5 (6)
    Obtenez votre mise à jour quotidienne du marché avec des détails et des captures d'écran via notre Morning Briefing ici sur mql5 et sur Telegram ! FX Power MT5 NG est la nouvelle génération de notre très populaire indicateur de force des devises, FX Power. Et qu'est-ce que ce compteur de force de nouvelle génération offre ? Tout ce que vous avez aimé de l'original FX Power PLUS Analyse de la force de l'OR/XAU Des résultats de calcul encore plus précis Périodes d'analyse configurables individuel
    IX Power MT5
    Daniel Stein
    4.17 (6)
    IX Power   apporte enfin la précision imbattable de FX Power aux symboles non-Forex. Il détermine avec précision l'intensité des tendances à court, moyen et long terme de vos indices, actions, matières premières, ETF et même crypto-monnaies préférés. Vous pouvez   analyser tout ce que   votre terminal a à offrir. Essayez-le et découvrez comment   votre timing s'améliore considérablement   lors de vos transactions. Caractéristiques principales d'IX Power Résultats de calcul précis à 100 %,
    Ce tableau de bord affiche les derniers   modèles harmoniques   disponibles pour les symboles sélectionnés, ce qui vous permettra de gagner du temps et d'être plus efficace /   version MT4 . Indicateur gratuit:   Basic Harmonic Pattern Colonnes de l'indicateur Symbol :   les symboles sélectionnés apparaissent Trend   :   haussière ou baissière Pattern :   type de motif (gartley, papillon, chauve-souris, crabe, requin, cypher ou ABCD) Entry:   prix d'entrée SL:   prix du stop loss TP1:   1
    Top indicator for MT5   providing accurate signals to enter a trade without repainting! It can be applied to any financial assets:   forex, cryptocurrencies, metals, stocks, indices .  Watch  the video  (6:22) with an example of processing only one signal that paid off the indicator! MT4 version is here It will provide pretty accurate trading signals and tell you when it's best to open a trade and close it. Most traders improve their trading results during the first trading week with the help of
    Maintenant 147 $ (augmentant à 499 $ après quelques mises à jour) - Comptes illimités (PCS ou Mac) Manuel d'utilisation RelicusRoad + Vidéos de formation + Accès au groupe Discord privé + Statut VIP UNE NOUVELLE FAÇON DE REGARDER LE MARCHÉ RelicusRoad est l'indicateur de trading le plus puissant au monde pour le forex, les contrats à terme, les crypto-monnaies, les actions et les indices, offrant aux traders toutes les informations et tous les outils dont ils ont besoin pour rester renta
    ICT, SMC, SMART MONEY CONCEPTS, SMART MONEY, Smart Money Concept, Support and Resistance, Trend Analysis, Price Action, Market Structure, Order Blocks, BOS/CHoCH,   Breaker Blocks ,  Momentum Shift,   Supply&Demand Zone/Order Blocks , Strong Imbalance,   HH/LL/HL/LH,    Fair Value Gap, FVG,  Premium  &   Discount   Zones, Fibonacci Retracement, OTE, Buy Side Liquidity, Sell Side Liquidity, BSL/SSL Taken, Equal Highs & Lows, MTF Dashboard, Multiple Time Frame, BigBar, HTF OB, HTF Market Structure
    Easy By Sell is a market indicator for opening and closing positions. It becomes easy to track market entries with alerts. It indicates trend reversal points when a price reaches extreme values ​​and the most favorable time to enter the market. it is as effective as a Fibonacci to find a level but it uses different tools such as an algorithm based on ATR indicators and Stochastic Oscillator. You can modify these two parameters as you wish to adapt the settings to the desired period. My othe
    Blahtech Supply Demand MT5
    Blahtech Limited
    4.54 (13)
    Was: $299  Now: $99   Supply Demand uses previous price action to identify potential imbalances between buyers and sellers. The key is to identify the better odds zones, not just the untouched ones. Blahtech Supply Demand indicator delivers functionality previously unavailable on any trading platform. This 4-in-1 indicator not only highlights the higher probability zones using a multi-criteria strength engine, but also combines it with multi-timeframe trend analysis, previously confirmed swings
    Advanced Supply Demand MT5
    Bernhard Schweigert
    4.53 (15)
    La meilleure solution pour tout commerçant débutant ou expert ! Cet indicateur est un outil de trading unique, de haute qualité et abordable car nous avons intégré un certain nombre de fonctionnalités propriétaires et une nouvelle formule. Avec cette mise à jour, vous pourrez afficher des zones à double horaire. Vous pourrez non seulement afficher un TF plus élevé, mais afficher les deux, le graphique TF, PLUS le TF supérieur : AFFICHAGE DES ZONES NICHÉES. Tous les traders Supply Demand vont ado
    Introduction to X3 Chart Pattern Scanner X3 Cherart Pattern Scanner is the non-repainting and non-lagging indicator detecting X3 chart patterns including Harmonic pattern, Elliott Wave pattern, X3 patterns, and Japanese Candlestick patterns. Historical patterns match with signal patterns. Hence, you can readily develop the solid trading strategy in your chart. More importantly, this superb pattern scanner can detect the optimal pattern of its kind. In addition, you can switch on and off individu
    AW Trend Predictor MT5
    AW Trading Software Limited
    4.78 (58)
    La combinaison des niveaux de tendance et de panne dans un seul système. Un algorithme d'indicateur avancé filtre le bruit du marché, détermine la tendance, les points d'entrée, ainsi que les niveaux de sortie possibles. Les signaux indicateurs sont enregistrés dans un module statistique, qui vous permet de sélectionner les outils les plus appropriés, montrant l'efficacité de l'historique des signaux. L'indicateur calcule les marques Take Profit et Stop Loss. Manuel et instruction ->   ICI   / v
    FX Trend MT5
    Daniel Stein
    4.68 (37)
    Vous voulez devenir un trader forex 5 étoiles constamment rentable ? 1.   Lisez la description de base de notre   système de   trading simple et   la mise à jour majeure de sa stratégie en 2020 2.   Envoyez une capture d'écran de votre achat pour recevoir votre invitation personnelle à notre chat de trading exclusif FX Trend   affiche la direction de la tendance, sa durée, son intensité et l'évaluation de la tendance qui en résulte pour tous les cadres temporels en temps réel. Vous verrez d'u
    Présentation       Quantum Breakout PRO   , l'indicateur révolutionnaire MQL5 qui transforme la façon dont vous négociez les zones d'évasion ! Développé par une équipe de traders expérimentés avec une expérience commerciale de plus de 13 ans,       Évasion quantique PRO       est conçu pour propulser votre parcours commercial vers de nouveaux sommets grâce à sa stratégie de zone de discussion innovante et dynamique. Quantum Breakout Indicator vous donnera des flèches de signalisation sur le
    Auto Order Block with break of structure based on ICT and Smart Money Concepts (SMC) Futures Break of Structure ( BoS )             Order block ( OB )            Higher time frame Order block / Point of Interest ( POI )    shown on current chart           Fair value Gap ( FVG ) / Imbalance   -  MTF      ( Multi Time Frame )    HH/LL/HL/LH  -  MTF      ( Multi Time Frame )  Choch  MTF      ( Multi Time Frame )  Volume Imbalance     ,  MTF          vIMB Gap’s Power of 3 Equal High
    AT Forex Indicator MT5
    Marzena Maria Szmit
    5 (4)
    The AT Forex Indicator MT5 is a sophisticated trading tool designed to provide traders with a comprehensive analysis of multiple currency pairs. This powerful indicator simplifies the complex nature of the forex market, making it accessible for both novice and experienced traders. AT Forex Indicator uses advanced algorithms to detect trends, patterns and is an essential tool for traders aiming to enhance their forex trading performance. With its robust features, ease of use, and reliable signal
    Matrix Arrow Indicator MT5
    Juvenille Emperor Limited
    5 (14)
    Matrix Arrow Indicator MT5   est une tendance unique 10 en 1 suivant un indicateur multi-période   100% non repeint   qui peut être utilisé sur tous les symboles/instruments:   forex ,   matières premières ,   crypto-monnaies ,   indices ,  actions .  Matrix Arrow Indicator MT5  déterminera la tendance actuelle à ses débuts, en rassemblant des informations et des données à partir d'un maximum de 10 indicateurs standard, qui sont: Indice de mouvement directionnel moyen (ADX) Indice de canal de m
    Gold TMAF MTF - il s'agit d'un meilleur indicateur technique boursier. L'algorithme de l'indicateur analyse le mouvement du prix d'un actif et reflète la volatilité et les zones d'entrée potentielles. Les meilleurs signaux de l'indicateur: - Pour VENDRE = limite supérieure rouge de la TMA2 au-dessus de la limite supérieure rouge de la TMA1 + indicateur fractal rouge au-dessus + flèche jaune du signal SR dans la même direction. - Pour l'ACHAT = limite inférieure bleue de la TMA2 en desso
    Automated Trendlines MT5
    Georgios Kalomoiropoulos
    Les lignes de tendance sont l'outil d'analyse technique le plus essentiel dans le trading forex. Malheureusement, la plupart des commerçants ne les dessinent pas correctement. L'indicateur Automated Trendlines est un outil professionnel pour les traders sérieux qui vous aide à visualiser le mouvement de tendance des marchés. Il existe deux types de lignes de tendance, les lignes de tendance haussières et les lignes de tendance baissières. Dans la tendance haussière, la ligne de tendance
    Elliott Wave Trend was designed for the scientific wave counting. This tool focuses to get rid of the vagueness of the classic Elliott Wave Counting using the guideline from the template and pattern approach. In doing so, firstly Elliott Wave Trend offers the template for your wave counting. Secondly, it offers Wave Structural Score to assist to identify accurate wave formation. It offers both impulse wave Structural Score and corrective wave Structure Score. Structural Score is the rating to sh
    Gartley Hunter Multi
    Siarhei Vashchylka
    5 (8)
    Gartley Hunter Multi - An indicator for searching for harmonic patterns simultaneously on dozens of trading instruments and on all possible timeframes. Manual (Be sure to read before purchasing) | Version for MT4 Advantages 1. Patterns: Gartley, Butterfly, Shark, Crab. Bat, Alternate Bat, Deep Crab, Cypher 2. Simultaneous search for patterns on dozens of trading instruments and on all possible timeframes 3. Search for patterns of all possible sizes. From the smallest to the largest 4. A
    Golden Spikes Premium
    Kwaku Bondzie Ghartey
    Golden Spikes Detector Overview: The Golden Spikes Premium is a groundbreaking trading indicator meticulously crafted for the Boom and Crash indices on the Deriv market. Tailored to meet the needs of discerning traders, this powerful tool operates exclusively on the one-minute timeframe, providing timely and precise signals to maximize your trading potential. The Golden Spikes Detector stands out in its ability to deliver accurate signals, ensuring that you capitalize on market opportunities wit
    FX Volume MT5
    Daniel Stein
    4.94 (17)
    Obtenez votre mise à jour quotidienne du marché avec des détails et des captures d'écran via notre Morning Briefing ici sur mql5 et sur Telegram ! FX Volume est le PREMIER et SEUL indicateur de volume qui fournit un VRAI aperçu du sentiment du marché du point de vue d'un courtier. Il fournit des informations impressionnantes sur la façon dont les acteurs institutionnels du marché, comme les courtiers, sont positionnés sur le marché des changes, bien plus rapidement que les rapports COT. Voir c
    Plus de l'auteur
    Candle Timer Countdown displays the remaining time before the current bar closes and a new bar forms. It can be used for time management. MT4 version here! Feature Highlights Tracks server time not local time Configurable Text Color and Font Size Optional Visualization of the Symbol Daily Variation Optimized to reduce CPU usage Input Parameters Show Daily Variation: true/false Text Font Size Text Color If you still have questions, please contact me by direct message:  https://www.mql5.com/en
    FREE
    MACD Intraday Trend est un indicateur développé à partir d'une adaptation du MACD original créé par Gerald Appel dans les années 1960. Au cours des années de trading, il a été observé qu'en modifiant les paramètres du MACD avec les proportions de Fibonacci, nous obtenons une meilleure présentation de la continuité des mouvements de tendance, ce qui permet de détecter plus efficacement le début et la fin d'une tendance de prix. En raison de son efficacité à détecter les tendances des prix, il est
    FREE
    Candle Timer Countdown displays the remaining time before the current bar closes and a new bar forms. It can be used for time management. MT5 version here! Feature Highlights Tracks server time not local time Configurable Text Color and Font Size Optional Visualization of the Symbol Daily Variation Optimized to reduce CPU usage Input Parameters Show Daily Variation: true/false Text Font Size Text Color If you still have questions, please contact me by direct message:  https://www.mql5.com/en
    FREE
    La configuration Tabajara a été créée par un trader brésilien connu sous le nom de « L'OGRO de Wall Street ». L'idée de cette configuration est d'indiquer au trader la tendance actuelle des prix et le type d'opération à rechercher dans le graphique. Opération Il le fait par le positionnement de la fermeture des bougies et du VWAP jusqu'à 10h40 et après par la moyenne arithmétique de 20 périodes en peignant les bougies en 4 couleurs possibles : Vert -> Prix en hausse dans une tendance à la h
    FREE
    Pivot Point Fibo RSJ est un indicateur qui trace les lignes de support et de résistance de la journée en utilisant les taux de Fibonacci. Cet indicateur spectaculaire crée jusqu'à 7 niveaux de support et de résistance via Pivot Point en utilisant les taux de Fibonacci. C'est fantastique de voir comment les prix respectent chaque niveau de ce support et de cette résistance, où il est possible de percevoir les points d'entrée/sortie possibles d'une opération. Caractéristiques Jusqu'à 7 nive
    FREE
    MACD Intraday Trend est un indicateur développé à partir d'une adaptation du MACD original créé par Gerald Appel dans les années 1960. Au cours des années de trading, il a été observé qu'en modifiant les paramètres du MACD avec les proportions de Fibonacci, nous obtenons une meilleure présentation de la continuité des mouvements de tendance, ce qui permet de détecter plus efficacement le début et la fin d'une tendance de prix. En raison de son efficacité à détecter les tendances des prix, il est
    FREE
    Pivot Point Fibo RSJ est un indicateur qui trace les lignes de support et de résistance de la journée en utilisant les taux de Fibonacci. Cet indicateur spectaculaire crée jusqu'à 7 niveaux de support et de résistance via Pivot Point en utilisant les taux de Fibonacci. C'est fantastique de voir comment les prix respectent chaque niveau de ce support et de cette résistance, où il est possible de percevoir les points d'entrée/sortie possibles d'une opération. Caractéristiques Jusqu'à 7 nive
    FREE
    Tabajara Ogro
    JETINVEST
    4.75 (12)
    Setup Tabajara was created by a Brazilian trader known as  "The OGRO of Wall Street" . The idea of this setup is to indicate to the trader the current trend of prices and  the type of operation should be looked for in the graph. Operation It does this through the relation of the closing price position and the     of 20 periods, by painting the candles in 4 possible colors : Green -> Price rising in upward trend (Search entry points for PURCHASE) Black -> Price correcting in Bullish Trend
    FREE
    Weis Waves RSJ
    JETINVEST
    4.67 (9)
    The Weis Waves RSJ Indicator sums up volumes in each wave. This is how we receive a bar chart of cumulative volumes of alternating waves. Namely the cumulative volume makes the Weis wave charts unique. It allows comparing the relation of the wave sequence characteristics, such as correspondence of the applied force (expressed in the volume) and received result (the price progress). If you still have questions, please contact me by direct message:  https://www.mql5.com/en/users/robsjunqueira/
    FREE
    VWAP Fibo Bands RSJ is an indicator that traces the lines of the daily VWAP and from it creates bands using Fibonacci proportions. This spectacular indicator creates 10 band levels through the selected VWAP period using Fibonacci ratios. It is fantastic how the prices respect each level of the bands, where it is possible to realize that almost every time the price closes above / below a level of the bands he will seek the next one. If close above will seek to reach the level above and if close
    FREE
    Vwap RSJ
    JETINVEST
    4.93 (14)
    VWAP RSJ is an indicator that plots the Hourly, Daily, Weekly and Monthly  VWAP Lines. Large institutional buyers and   mutual funds   use the VWAP ratio to help move into or out of stocks with as small of a market impact as possible. Therefore, when possible, institutions will try to buy below the VWAP, or sell above it. This way their actions push the price back toward the average, instead of away from it. Based on this information I developed this indicator that combines 4 types of VWAP T
    FREE
    MACD Intraday Trend PRO est un indicateur développé grâce à une adaptation du MACD original créé par Gerald Appel dans les années 1960. Au fil des années de négociation, il a été observé qu'en modifiant les paramètres du MACD avec les proportions de Fibonacci, nous obtenons une meilleure présentation de la continuité des mouvements de tendance, ce qui permet de détecter plus efficacement le début et la fin d'une tendance de prix. En raison de son efficacité à détecter les tendances de prix,
    This simple indicator paints with a darker color on the volume bar when the quantity traded is above the average of select number of periods of the volume itself, highlighting the moments when there was a large volume of deals above the average. It is also possible to use a configuration of four colors where the color tone shows a candle volume strength. The indicator defaults to the simple average of 20 periods, but it is possible to change to other types of averages and periods. If you like
    FREE
    This indicator calculates the difference between the SELL aggression and the BUY aggression that occurred in each Candle, plotting the balance of each one graphically. Note: This indicator DOES NOT WORK for Brokers and/or Markets WITHOUT the type of aggression (BUY or SELL). Be sure to try our   Professional   version with configurable features and alerts:   Delta Agression Volume PRO Settings Aggression by volume (Real Volume) or by number of trades (Tick Volume) Start of the Aggression De
    FREE
    This indicator sums up the difference between the sells aggression and the buys aggression that occurred in each Candle, graphically plotting the waves of accumulation of the aggression volumes.   Through these waves an exponential average is calculated that indicates the direction of the business flow. Note: This indicator DOES NOT WORK for Brokers and/or Markets WITHOUT the type of aggression (BUY or SELL).   Be sure to try our Professional version with configurable features and alerts:  Agr
    FREE
    Funcionamento: O Painel  Netting Panel RSJ  funciona com   qualquer ativo   e em   qualquer tempo gráfico . Ele funciona em contas do tipo " Netting " e " Hedge ", mas gerencia apenas uma posição por ativo, por isso o nome   Netting.   Se ele for executado em contas do tipo " Hedge ", ele fará o gerenciamento e proteção   apenas da posição mais antiga , ou seja, da primeira posição que foi aberta por ele. Em contas " Netting " quando os botões " SELL " ou " BUY " forem pressionados,   ocorrer
    FREE
    This simple indicator paints with a darker color on the volume bar when the quantity traded is above the average of select number of periods of the volume itself, highlighting the moments when there was a large volume of deals above the average. It is also possible to use a configuration of four colors where the color tone shows a candle volume strength. The indicator defaults to the simple average of 20 periods, but it is possible to change to other types of averages and periods. If you like
    FREE
    RENKO PRICE ACTION ATR is an "Expert Advisor" developed through the construction of the Renko Chart where each BRICK has the size calculated through the ATR of the period selected by the user. Renko charts are designed to filter out minor price movements, thus making it easier for traders to focus on important trends. Due to its efficiency in detecting price trends, it is also possible to clearly identify supports and resistances as well as top and bottom divergences, thus making better use of t
    The indicator Supply Demand RSJ PRO calculates and plots the "Supply" and "Demand" zones on the graph, identifying the type of Zone (Weak, Strong, Verified, Proven) and in case of retests of the Zone it shows how many times it was retested. "Supply" Zones are the price zones where more supply than demand has occurred, driving prices down. "Demand" Zones are the price zones where more demand than supply has occurred, pushing prices up. Be sure to try our professional version with configurable f
    MACD Intraday Trend PRO est un indicateur développé grâce à une adaptation du MACD original créé par Gerald Appel dans les années 1960. Au fil des années de négociation, il a été observé qu'en modifiant les paramètres du MACD avec les proportions de Fibonacci, nous obtenons une meilleure présentation de la continuité des mouvements de tendance, ce qui permet de détecter plus efficacement le début et la fin d'une tendance de prix. En raison de son efficacité à détecter les tendances de prix,
    Aggression Wave PRO is an indicator developed to monitor the divergence, strength, and continuity of the aggression volume of sell and buy negotiations.  The  Agrression Wave PRO   has features that allow you to view beyond the accumulated delta volume of the day. Note: This indicator DOES NOT WORK for Brokers and/or Markets WITHOUT the type of aggression (BUY or SELL). Cryptocurrencies and Forex do not provide this type of information, that is, it does not work with it. Operation It is pos
    Delta Aggression Volume PRO is an indicator developed to monitor the strength and continuity of the aggression volume of sell and buy negotiations. Note: This indicator DOES NOT WORK for Brokers and/or Markets WITHOUT the type of aggression (BUY or SELL). Cryptocurrencies and Forex do not provide this type of data, that is, it does not work with them. O Delta Agrression Volume PRO has features that allow you to view beyond the delta volume of the day. Operation Multi symbols  (those who pro
    The indicator Supply Demand RSJ PRO calculates and plots the "Supply" and "Demand" zones on the graph, identifying the type of Zone (Weak, Strong, Verified, Proven) and in case of retests of the Zone it shows how many times it was retested. "Supply" Zones are the price zones where more supply than demand has occurred, driving prices down. "Demand" Zones are the price zones where more demand than supply has occurred, pushing prices up. Classification of zones Weak: Price region which, if re-te
    Trend WDO B3
    JETINVEST
    5 (2)
    Trend WDO B3 est un système de trading professionnel créé pour la plate-forme MT5 et optimisé pour fonctionner avec MINI DOLAR INDEX (WDO) sur B3 au BRÉSIL. Le système utilise Fuzzy Logic sur plusieurs périodes (1M, 5M, 15M, 30M, H1, H4, D1) pour identifier la tendance des prix, en appliquant des pondérations dans chaque période en fonction des calculs effectués. Après avoir identifié la tendance, le système positionne un ordre STOP (ACHAT ou VENTE) en fonction de la volatilité moyenne, et lo
    Trend WIN B3
    JETINVEST
    5 (4)
    Trend WIN B3 est un système de trading professionnel créé pour la plate-forme MT5 et optimisé pour fonctionner avec MINI FUTURE INDEX (WIN) sur B3 au BRÉSIL. Le système utilise Fuzzy Logic sur plusieurs périodes (1M, 5M, 15M, 30M, H1, H4, D1) pour identifier la tendance des prix, en appliquant des pondérations dans chaque période en fonction des calculs effectués. Après avoir identifié la tendance, le système positionne un ordre STOP (ACHAT ou VENTE) en fonction de la volatilité moyenne, et l
    SniperBot EURUSD
    JETINVEST
    5 (1)
    L'EA utilise la volatilité, le spread, la fréquence et le timing pour décider quand trader. L'EA utilise la méthode des ordres limités pour ouvrir des positions. Dans ce cas, le Slippage sera au maximum positif à l'exécution des saisies. L'EA utilise la logique Trailing Take Profit, car l'objectif du système est de gagner de l'argent tout en protégeant votre capital. La plupart des transactions sont fermées rapidement, donc comme un tir à la tête d'un tireur d'élite. Caractéristiques principa
    Sniper Major
    JETINVEST
    5 (1)
    L'EA utilise la volatilité, le spread, la fréquence et le timing pour décider quand trader. L'EA utilise la méthode des ordres limités pour ouvrir des positions. Dans ce cas, le Slippage sera au maximum positif à l'exécution des saisies. L'EA utilise la logique Trailing Take Profit, car l'objectif du système est de gagner de l'argent tout en protégeant votre capital. La plupart des transactions sont fermées rapidement, donc comme un tir à la tête d'un tireur d'élite. Caractéristiques princi
    JetBot
    JETINVEST
    This is an EXPERT with a FOCUS on LEARNING and PROFESSIONAL DEVELOPMENT!!! The idea of this product is to commercialize the source code, allowing those who want to develop their own robots, or start a professional activity developing customized experts, to have a reference source code that helps them in the learning and development process. This source code will be increased, that is, new functionalities will be created, thus allowing the project to continue evolving. For every 10 sales a new v
    This is an EXPERT with a FOCUS on LEARNING and PROFESSIONAL DEVELOPMENT!!! The idea of this product is to commercialize the source code, allowing those who want to develop their own robots, or start a professional activity developing customized experts, to have a reference source code that helps them in the learning and development process. This source code will be increased, that is, new functionalities will be created, thus allowing the project to continue evolving. For every 10 sales a new v
    This is an EXPERT with a FOCUS on LEARNING and PROFESSIONAL DEVELOPMENT!!! The idea of this product is to commercialize the source code, allowing those who want to develop their own robots, or start a professional activity developing customized experts, to have a reference source code that helps them in the learning and development process. This source code will be increased, that is, new functionalities will be created, thus allowing the project to continue evolving. For every 10 sales a new v
    Filtrer:
    hud_nacar
    14
    hud_nacar 2024.08.07 04:34 
     

    Muito bom cumpriu o objetivo com louvor.

    JETINVEST
    264774
    Réponse du développeur Roberto Sant Ana Junqueira 2024.08.07 12:21
    Bom dia. Obrigado pelo review
    Eliel Soares
    68
    Eliel Soares 2024.06.10 00:18 
     

    amigo você pode colocar esse contador com o zigzag, no caso ele contando as barras da onda do zigzag, seria excelente pra quem trabalha com a teoria do tempo no mercado, desde já agradeço.

    JETINVEST
    264774
    Réponse du développeur Roberto Sant Ana Junqueira 2024.06.12 14:45
    Bom dia. Me chame no privado para que alinhemos sua ideia
    Σάκης Καρανικόλας
    33
     

    I recently downloaded an indicator for MT5, and I must say it's proven to be an incredibly useful tool for my trading endeavors. What I appreciate most about this indicator is its simplicity and functionality. It has streamlined my trading process and made it much more efficient. The user-friendly interface and straightforward design make it easy for even beginners to navigate. It doesn't overwhelm me with unnecessary features or complex settings, which is a common issue with many trading apps. Instead, it provides the essential tools and information I need to make well-informed decisions. However, if I could suggest one improvement, it would be to have the option to change the starting point for the count. To start from the normal opening of the market (RTH). Overall, I'm quite pleased with this indicator!

    JETINVEST
    264774
    Réponse du développeur Roberto Sant Ana Junqueira 2023.10.24 18:41
    tks
    sergiotanb
    14
    sergiotanb 2023.09.05 00:43 
     

    Muito bom

    JETINVEST
    264774
    Réponse du développeur Roberto Sant Ana Junqueira 2023.09.05 00:43
    obrigado pelo review
    marcelotk
    14
    marcelotk 2023.08.12 16:22 
     

    Prático... Muito útil... Fácil de configurar.. gostei muito

    JETINVEST
    264774
    Réponse du développeur Roberto Sant Ana Junqueira 2023.08.12 16:27
    obrigado pelo review
    gfedrigo
    94
    gfedrigo 2021.10.15 13:19 
     

    great tool

    JETINVEST
    264774
    Réponse du développeur Roberto Sant Ana Junqueira 2023.02.07 23:33
    tks
    Diogo Gomes
    190
    Diogo Gomes 2021.09.26 14:14 
     

    obrigado

    JETINVEST
    264774
    Réponse du développeur Roberto Sant Ana Junqueira 2021.09.26 16:27
    Obrigado pelo review
    Fabio_Novaes
    175
    Fabio_Novaes 2021.06.30 21:41 
     

    como estava sentindo falta desse contador, obrigado!

    JETINVEST
    264774
    Réponse du développeur Roberto Sant Ana Junqueira 2021.06.30 23:09
    tks
    Robson Souza
    122
    Robson Souza 2021.06.30 14:56 
     

    L'utilisateur n'a laissé aucun commentaire sur la note

    JETINVEST
    264774
    Réponse du développeur Roberto Sant Ana Junqueira 2021.06.30 15:08
    Hi Robson, tks for your review.
    Marilise Ravaglio Da Cunha Junqueira
    386
     

    L'utilisateur n'a laissé aucun commentaire sur la note

    JETINVEST
    264774
    Réponse du développeur Roberto Sant Ana Junqueira 2021.06.30 15:09
    Obrigado pelo review Marilise.
    Répondre à l'avis
    Version 2.0 2021.09.21
    Add some input parameters:
    - Plot Numbers Config
    - Distance from Candle
    - Font Size