DBS Delta
- Indicateurs
- Dmitriy Burlachenko
- Version: 2.10
- Activations: 5
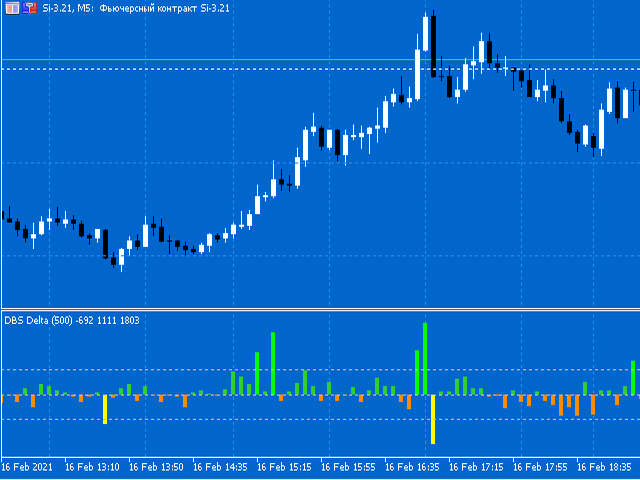
The delta indicator is used to display the difference between the volume that passed on the exchange at the Ask price and above (market buys) and the volume that passed at the Bid price and below (market sales). This indicator shows the delta of each candle on the timeframe of your choice.
The data is displayed as a colored histogram in a separate indicator window.
The indicator is calculated from the tick history, therefore, to speed up the calculations and reduce the load on the system, the number of bars for calculation is specified in the parameters.
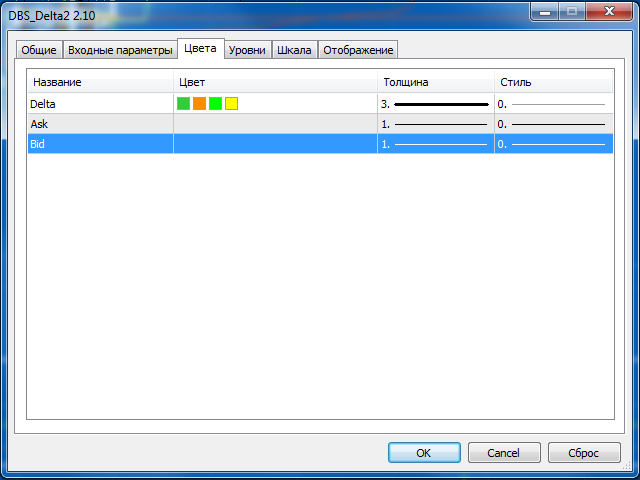
Also, the indicator can highlight the values exceeding the level specified in the settings with an additional color.
ATTENTION! TICK HISTORY DATA AND REAL EXCHANGE VOLUMES ARE REQUIRED FOR THE INDICATOR TO OPERATE! THE INDICATOR WORKS ONLY ON EXCHANGE INSTRUMENTS!
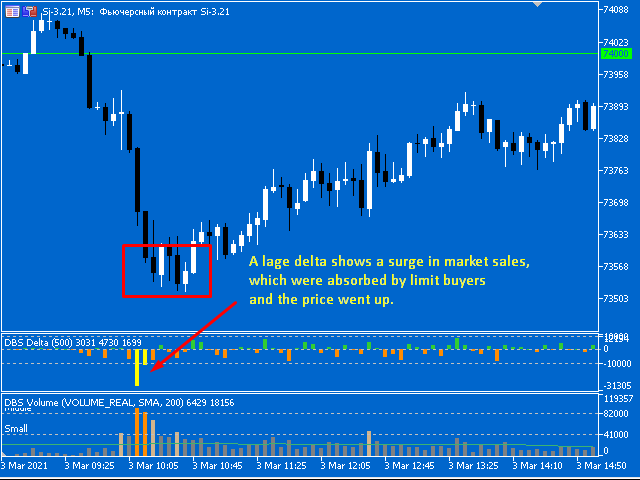
The general essence of the indicator is that the delta determines the "character" of the market, that is, the prevalence of market buyers or sellers at the moment. Together with the Volume indicator at the place of volume spikes, it is also important to take into account an abnormal delta spike - as a rule, this is a sign of the end of the trend (at its end), or, a strong impulse for a new movement (at its beginning). Also, do not forget to analyze the delta in a trend (that is, its behavior over several bars).

