Volume By Color RSJ
- Indicateurs
- JETINVEST
- Version: 1.0
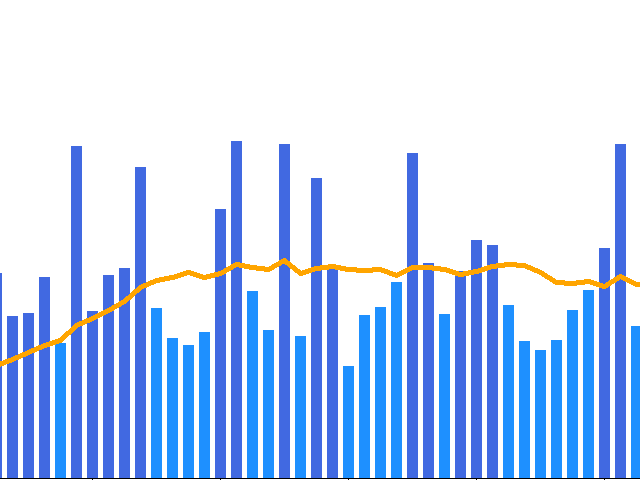
This simple indicator paints with a darker color on the volume bar when the quantity traded is above the average of select number of periods of the volume itself, highlighting the moments when there was a large volume of deals above the average.
It is also possible to use a configuration of four colors where the color tone shows a candle volume strength.
The indicator defaults to the simple average of 20 periods, but it is possible to change to other types of averages and periods.
If you like this indicator, please do a little review (not a comment, but a REVIEW!), As this is the only way to recognize my work. Thank you very much.


Great tool.... Thanks for sharing it with us...