• Aperçu
  • Avis (9)
  • Commentaires (43)
  • Nouveautés

Volume Ticks ResSup

4.57

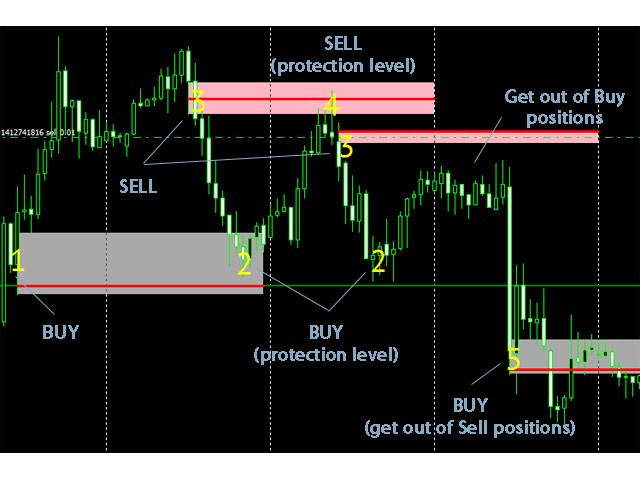
The market price is moved by the market makers with large amounts of equity. The only way to understand intentions of big players is to track their activity by concentration of volumes on one level or another. Volume Ticks ResSup draws a level with the maximum concentration of a tick volume since the beginning of a day. In most cases, such level is an actual support or resistance level.

Parameters

  • ColorLevelSupport - support line color;
  • ColorLevelResistance - resistance line color;
  • BarsDayCount - number of days the indicator is displayed.
Avis 9
Iwan Iskandar
706
Iwan Iskandar 2016.11.26 17:41 
 

Great Indicator but it takes too much resources of my computer, but then again maybe is my computer is too old. Anyway this indicator is good in locating areas where the big players are buying or selling.

pokrat
1467
pokrat 2016.04.10 23:20 
 

One of the best indicators i've bought....

Richard Caughell
1524
Richard Caughell 2015.08.12 15:28 
 

Anybody who is a intraday trader wants this.......wow amazing I didnt realize how important these areas are when it revolves around volume. Yes Im a volume trader but I never looked at areas of the daily consolidation takes place. And guess a very high percentage of the time when price breaks these areas it makes a large rally. This should be developed into a daily scalping EA. Very powerful.

Produits recommandés
TrendPlus
Sivakumar Subbaiya
4.07 (14)
Trend Plus   Trendplus  Indicator   Time Frame: Suitable for any time frame.  Purpose: Trend Prediction. Blue and red candle indicate the buy and sell call respectively. Buy: When the blue candle is formed buy call is initiated. close the buy trades when the next red candle will formed.   Sell: When the Red candle is formed Sell call is initiated. close the Sell trades when the next blue candle will formed.   Happy trade!!
FREE
QualifiedEngulfing
Ashkan Hazegh Nikrou
QualifiedEngulfing est la version gratuite de l'indicateur ProEngulfing . ProEngulfing est la version payante de l'indicateur Advance Engulf. Téléchargez-le ici. Quelle est la différence entre la version gratuite et la version payante de ProEngulfing ? La version gratuite a une limitation d'un signal par jour. Présentation de QualifiedEngulfing - Votre indicateur de motif Engulf professionnel pour MT4 Libérez la puissance de la précision avec QualifiedEngulfing, un indicateur de pointe conçu p
FREE
Rainbow MT4
Jamal El Alama
Rainbow MT4 is a technical indicator based on Moving average with period 34 and very easy to use. When price crosses above MA and MA changes color to green, it’s a signal to buy. When price crosses below MA and MA changes color to red, it’s a signal to sell. The Expert advisor ( Rainbow EA MT4) based on Rainbow MT4 indicator, as you can see in the short video below is now available here .
FREE
Discover the power of precision and efficiency in your trading with the " Super Auto Fibonacci " MT4 indicator. This cutting-edge tool is meticulously designed to enhance your technical analysis, providing you with invaluable insights to make informed trading decisions. Key Features: Automated Fibonacci Analysis: Say goodbye to the hassle of manual Fibonacci retracement and extension drawing. "Super Auto Fibonacci" instantly identifies and plots Fibonacci levels on your MT4 chart, saving you tim
FREE
Market Profile 3
Hussien Abdeltwab Hussien Ryad
3 (2)
Market Profile 3 MetaTrader 4 indicator  — is a classic Market Profile implementation that can show the price density over time, outlining the most important price levels, value area, and control value of a given trading session. This indicator can be attached to timeframes between M1 and D1 and will show the Market Profile for daily, weekly, monthly, or even intraday sessions. Lower timeframes offer higher precision. Higher timeframes are recommended for better visibility. It is also possible t
FREE
Trend arrow Indicator
Nguyen Nghiem Duy
3.3 (10)
Trend arrow Indicator is an arrow Indicator used as an assistant tool for your trading strategy. The indicator analyzes the standard deviation of bar close for a given period and generates a buy or sell signals if the deviation increases. It good to combo with Martingale EA to follow Trend and Sellect Buy Only/Sell Only for EA work Semi-Automatic. You can use this  Indicator with any EAs in my Products.
FREE
This indicator alerts you when/before new 1 or 5 minute bar candle formed. In other words,this indicator alerts you every 1/5 minutes. This indicator is especially useful for traders who trade when new bars formed. *This indicator don't work propery in strategy tester.Use this in live trading to check functionality. There is more powerful Pro version .In Pro version,you can choose more timeframe and so on. Input Parameters Alert_Or_Sound =Sound ----- Choose alert or sound or both to notify y
FREE
The indicator allows you to trade binary options. The recommended time frame is М1 and the expiration time is 1,2,3 minutes. The indicator suitable for auto and manual trading. A possible signal is specified as a arrows above/under a candle. You should wait until the candle closes! Arrows are not re-painted Trade sessions: TOKYO section (Half-end) Currency pairs: USD/JPY Working time frame: M1 Expiration time: 1,2,3 minutes. The indicator also shows good results when using the martingale strateg
FREE
Highlights trading sessions on the chart The demo version only works on the AUDNZD chart!!! The full version of the product is available at: (*** to be added ***) Trading Session Indicator displays the starts and ends of four trading sessions: Pacific, Asian, European and American. the ability to customize the start/end of sessions; the ability to display only selected sessions; works on M1-H2 timeframes; The following parameters can be configured in the indicator: TIME_CORRECTION = Correct
FREE
"Auto FIBO Pro" Crypto_Forex indicator - est un excellent outil auxiliaire dans le trading ! - L'indicateur calcule et place automatiquement sur le graphique les niveaux de Fibo et les lignes de tendance locales (couleur rouge). - Les niveaux de Fibonacci indiquent les zones clés où le prix peut s'inverser. - Les niveaux les plus importants sont 23,6 %, 38,2 %, 50 % et 61,8 %. - Vous pouvez l'utiliser pour le scalping inversé ou pour le trading en grille de zones. - Il existe également de nomb
Le Capteur de Tendance : La Stratégie du Capteur de Tendance avec Indicateur d'Alerte est un outil d'analyse technique polyvalent qui aide les traders à identifier les tendances du marché et les points d'entrée et de sortie potentiels. Elle présente une stratégie dynamique de Capteur de Tendance, s'adaptant aux conditions du marché pour une représentation visuelle claire de la direction de la tendance. Les traders peuvent personnaliser les paramètres selon leurs préférences et leur tolérance a
FREE
Are you tired of drawing trendlines every time you're analyzing charts? Or perhaps you would like more consistency in your technical analysis. Then this is for you. This indicator will draw trend lines automatically when dropped on a chart. How it works Works similar to standard deviation channel found on mt4 and mt5. It has 2 parameters: 1. Starting Bar 2. Number of bars for calculation The   starting bar   is the bar which drawing of the trend lines will begin, while the   number of bars for c
FREE
Wicks UpDown Target GJ Wicks UpDown Target GJ is specialized in GJ forex pairs. Choppy movement up and down on the opening range every day.  Trading breakouts on London session and New York session is recommended. Guideline Entry Strategy Idea: Step 1 - Breakout Forming (Warning! Trade on London Session and New York Session) Step 2 - Breakout Starting (Take Action on your trading plan) Step 3 - Partial Close your order & set breakeven (no-risk) Step 4 - Target complete Step 5 - Don't trade
FREE
Profil du marché Forex (FMP en abrégé) Ce que ce n'est pas : FMP n'est pas l'affichage TPO classique à code alphabétique, n'affiche pas le calcul global du profil de données du graphique et ne segmente pas le graphique en périodes et ne les calcule pas. Ce qu'il fait : Plus important encore, l'indicateur FMP traitera les données situées entre le bord gauche du spectre défini par l'utilisateur et le bord droit du spectre défini par l'utilisateur. L'utilisateur peut définir le spectre en tiran
FREE
Traditional MACD MT4
Daniel Lewis
4.58 (55)
MACD indicator in MetaTrader 4/5 looks different than MACD does in most other charting software. That is because the MetaTrader 4/5 version of MACD displays the MACD line as a histogram when it is traditionally displayed as a line. Additionally, the MetaTrader 4/5 version computes the Signal line using an SMA, while according to MACD definition it is supposed to be an EMA. The MetaTrader 4/5 version also does not compute a true MACD Histogram (the difference between the MACD/Signal lines). This
FREE
High Low Open Close MT4
Alexandre Borela
4.79 (19)
Si vous aimez ce projet, laissez un examen 5 étoiles. Cet indicateur tire les prix ouverts, élevés, bas et de fermeture pour les prix spécifiés période et il peut être ajusté pour un fuseau horaire spécifique. Il s ' agit là d ' un niveau important qui s ' intéresse à de nombreux domaines institutionnels et professionnels. traders et peut être utile pour vous de connaître les endroits où ils pourraient être plus active. Les périodes disponibles sont les suivantes : Jour précédent. Semaine pré
FREE
MegaTrends
Sivakumar Subbaiya
1 (1)
Megatrends  Indicator   Time Frame: Suitable for any time frame.  Purpose: Trend Prediction. Blue and red color indicate the buy and sell call respectively. Buy: When the blue line is originating it is opened buy call. Sell: When the Red line is origination it is opened sell call Happy trade!! this indicator is suitable for all time frame, but our recommended time frame to use 1hour and 4 hours, suitable for any chart.
FREE
Judas Swing with Confirmation Indices ICT MT4 The Judas Indicator with Confirmation is specifically designed to detect deceptive price movements on the chart. This tool helps traders recognize the true market trend by filtering out fake breakouts, reducing the risk of falling for false signals. By confirming the primary trend within a 1-minute timeframe , it minimizes the chances of traders making incorrect decisions.   Indicator Specifications Category ICT - Liquidity - Price Action Platform Me
FREE
Toby Strategy Indicator
Ahmd Sbhy Mhmd Ahmd ʿYshh
The indicator rely on The Toby strategy >> The mother candle which is bigger in range than the previous six candles. A vertical line shows the last Toby Candle with the targets shown up and down. The strategy is about the closing price out of the range of the toby candle to reach the 3 targets..The most probable to be hit is target1 so ensure reserving your profits and managing your stop lose.
FREE
Cumulative Delta MT4
Evgeny Shevtsov
4.86 (29)
The indicator analyzes the volume scale and splits it into two components - seller volumes and buyer volumes, and also calculates the delta and cumulative delta. The indicator does not flicker or redraw, its calculation and plotting are performed fairly quickly, while using the data from the smaller (relative to the current) periods. The indicator operation modes can be switched using the Mode input variable: Buy - display only the buyer volumes. Sell - display only the seller volumes. BuySell -
FREE
Wise Men Indicator demo
Bohdan Kasyanenko
3 (2)
The indicator displays signals according to the strategy of Bill Williams on the chart. Demo version of the indicator has the same features as the paid, except that it can work only on a demo account . Signal "First Wise Man" is formed when there is a divergent bar with angulation.  Bullish divergent bar - with lower minimum and closing price in the upper half. Bearish divergent bar - higher maximum and the closing price at the bottom half. Angulation is formed when all three lines of Alligator
FREE
Follow The Line
Oliver Gideon Amofa Appiah
3.94 (16)
FOLLOW THE LINE GET THE FULL VERSION HERE: https://www.mql5.com/en/market/product/36024 This indicator obeys the popular maxim that: "THE TREND IS YOUR FRIEND" It paints a GREEN line for BUY and also paints a RED line for SELL.  It gives alarms and alerts of all kinds. IT DOES NOT REPAINT and can be used for all currency pairs and timeframes. Yes, as easy and simple as that. Even a newbie can use it to make great and reliable trades. NB: For best results, get my other premium indicators for more
FREE
--->  Check all the other products  <--- The Candle Bias is a coloring indicator that doesn't take account of the close price of the bars.  It will color the candle in the bearish color (of your choice) if the downard range is greater than the upward range.  Conversely, it will color the candle in the bullish color of your choice if the upward range is greater than the downward range.  This is a major helper for Multi Time Frame analysis, it works on every security and every Time Frame. You ca
FREE
Extremum Reverse Bar
Yurij Izyumov
2.8 (5)
This indicator has been created for finding the probable reversal points of the symbol price. A small candlestick reversal pattern is used it its operation in conjunction with a filter of extremums. The indicator is not redrawn! If the extremum filter is disabled, the indicator shows all points that have a pattern. If the extremum filter is enabled, the condition works – if the history Previous bars 1 candles back contains higher candles and they are farther than the Previous bars 2 candle, such
FREE
OrderBlock TS Roman
Vladislav Vlastovskii
3.8 (5)
Индикатор строит блоки заказов (БЗ) по торговой системе (ТС) Романа. Поиск блоков осуществляется одновременно на двух таймфремах: текущем и старшем (определяемым в настройках). Для оптимизации и игнорирования устаревших блоков в настройках задается ограничение количества дней в пределах которых осуществляется поиск блоков. Блоки строятся по правилам ТС состоящем из трех шагов: какую свечу вынесли (что?); какой свечой вынесли (чем?); правило отрисовки (как?).
FREE
Trend Ray
Andriy Sydoruk
The indicator shows the potential trend direction by cyclical-wave dependence. Thus, all the rays of the intersection will be optimal rays, in the direction of which the price is expected to move, taking into account the indicator period. Rays can be used as a direction for potential market movement. But we must not forget that the approach must be comprehensive, the indicator signals require additional information to enter the market.
Free automatic Fibonacci is an indicator that automatically plots a Fibonacci retracement based on the number of bars you select on the BarsToScan setting in the indicator. The Fibonacci is automatically updated in real time as new highest and lowest values appears amongst the selected bars. You can select which level values to be displayed in the indicator settings. You can also select the color of the levels thus enabling the trader to be able to attach the indicator several times with differe
FREE
MASi Three Screens
Aleksey Terentev
5 (2)
MASi Three Screens is based on the trading strategy by Dr. Alexander Elder. This indicator is a collection of algorithms. Algorithms are based on the analysis of charts of several timeframes. You can apply any of the provided algorithms. List of versions of algorithms:     ThreeScreens v1.0 - A simple implementation, with analysis of the MACD line;     ThreeScreens v1.1 - A simple implementation, with analysis of the MACD histogram;     ThreeScreens v1.2 - Combines the first two algorithms in
FREE
Les motifs harmoniques sont les mieux adaptés pour prédire les points de retournement du marché. Ils offrent un taux de réussite élevé et de nombreuses opportunités de trading en une seule journée de trading. Notre indicateur identifie les motifs harmoniques les plus populaires en se basant sur les principes énoncés dans la littérature sur le trading harmonique. REMARQUES IMPORTANTES : L'indicateur ne repeint pas, ne prend pas de retard (il détecte un motif au point D) et ne redessine pas (le mo
FREE
Check my paid tools they work great and I share Ea's based on them for free please r ate The Dual Timeframe RSI (Relative Strength Index) indicator is a novel trading tool that allows traders to monitor RSI readings from two different timeframes on a single chart. This dual perspective enables traders to identify potential trend confirmations and divergences more effectively. For instance, a trader might use a 1-hour RSI alongside a daily RSI to ensure that short-term trades align with the broa
FREE
Les acheteurs de ce produit ont également acheté
Gann Made Easy
Oleg Rodin
4.8 (116)
Gann Made Easy est un système de trading Forex professionnel et facile à utiliser qui est basé sur les meilleurs principes de trading en utilisant la théorie de mr. WD Gann. L'indicateur fournit des signaux d'ACHAT et de VENTE précis, y compris les niveaux Stop Loss et Take Profit. Vous pouvez échanger même en déplacement en utilisant les notifications PUSH. S'il vous plaît contactez-moi après l'achat! Je partagerai avec vous mes astuces de trading et d'excellents indicateurs bonus gratuitement!
Gold Stuff
Vasiliy Strukov
4.86 (253)
Gold Stuff est un indicateur de tendance conçu spécifiquement pour l'or et peut également être utilisé sur n'importe quel instrument financier. L'indicateur ne se redessine pas et ne traîne pas. Délai recommandé H1. Au niveau de l'indicateur de travail, l'Expert Advisor EA Gold Stuff est entièrement automatique. Vous pouvez le trouver sur mon profil. Vous pouvez obtenir une copie gratuite de notre indicateur Strong Support et Trend Scanner, veuillez envoyer un message privé. moi! Contactez-mo
Enigmera
Ivan Stefanov
5 (7)
ENIGMERA : Le cœur du marché Important : La démo de MQL5.com fonctionne dans le Strategy Tester et peut ne pas refléter pleinement les fonctionnalités d'Enigmera. Consultez la description, les captures d'écran et la vidéo pour plus de détails. N'hésitez pas à m'envoyer un message si vous avez des questions ! Le code de l'indicateur a été entièrement réécrit. La version 3.0 ajoute de nouvelles fonctionnalités et corrige les bugs accumulés depuis le lancement de l'indicateur. Introduction Cet in
M1 Arrow
Oleg Rodin
5 (17)
Une stratégie intraday basée sur deux principes fondamentaux du marché. L'algorithme est basé sur l'analyse des volumes et des vagues de prix à l'aide de filtres supplémentaires. L'algorithme intelligent de l'indicateur ne donne un signal que lorsque deux facteurs de marché se combinent en un seul. L'indicateur calcule les vagues d'une certaine plage sur le graphique M1 en utilisant les données de la période la plus élevée. Et pour confirmer la vague, l'indicateur utilise une analyse en volume.
Scalper Inside PRO
Alexey Minkov
4.76 (63)
!SPECIAL SALE! An exclusive indicator that utilizes an innovative algorithm to swiftly and accurately determine the market trend. The indicator automatically calculates opening, closing, and profit levels, providing detailed trading statistics. With these features, you can choose the most appropriate trading instrument for the current market conditions. Additionally, you can easily integrate your own arrow indicators into Scalper Inside Pro to quickly evaluate their statistics and profitability
Je vous présente un excellent indicateur technique : Grabber, qui fonctionne comme une stratégie de trading "tout-en-un", prête à l'emploi. En un seul code sont intégrés des outils puissants d'analyse technique du marché, des signaux de trading (flèches), des fonctions d'alerte et des notifications push. Chaque acheteur de cet indicateur reçoit également gratuitement : L'utilitaire Grabber : pour la gestion automatique des ordres ouverts Un guide vidéo étape par étape : pour apprendre à install
Dynamic Forex28 Navigator
Bernhard Schweigert
5 (5)
Dynamic Forex28 Navigator - L'outil de trading Forex de nouvelle génération. ACTUELLEMENT 49 % DE RÉDUCTION. Dynamic Forex28 Navigator est l'évolution de nos indicateurs populaires de longue date, combinant la puissance de trois en un : Advanced Currency Strength28 Indicator (695 avis) + Advanced Currency IMPULSE avec ALERT (520 avis) + CS28 Combo Signals (Bonus). Détails sur l'indicateur https://www.mql5.com/en/blogs/post/758844 Qu'offre l'indicateur de force de nouvelle génération ? Tout
Scalper Vault
Oleg Rodin
5 (29)
Scalper Vault est un système de scalpage professionnel qui vous fournit tout ce dont vous avez besoin pour un scalpage réussi. Cet indicateur est un système de trading complet qui peut être utilisé par les traders de forex et d'options binaires. Le délai recommandé est M5. Le système vous fournit des signaux fléchés précis dans le sens de la tendance. Il vous fournit également des signaux supérieurs et inférieurs et des niveaux de marché Gann. Les indicateurs fournissent tous les types d'alertes
FX Volume
Daniel Stein
4.59 (34)
FX Volume : Découvrez le Sentiment du Marché tel que perçu par un Courtier Présentation Rapide Vous souhaitez faire passer votre approche de trading au niveau supérieur ? FX Volume vous fournit, en temps réel, des informations sur la manière dont les traders particuliers et les courtiers sont positionnés—bien avant la publication de rapports retardés comme le COT. Que vous visiez des gains réguliers ou recherchiez simplement un avantage plus solide sur les marchés, FX Volume vous aide à repére
Trend Screener
STE S.S.COMPANY
4.78 (93)
Indicateur de tendance, solution unique révolutionnaire pour le trading et le filtrage des tendances avec toutes les fonctionnalités de tendance importantes intégrées dans un seul outil ! Il s'agit d'un indicateur multi-période et multi-devises 100 % non repeint qui peut être utilisé sur tous les symboles/instruments : forex, matières premières, crypto-monnaies, indices et actions. OFFRE À DURÉE LIMITÉE : L'indicateur Support and Resistance Screener est disponible pour seulement 50 $ et à vie. (
Golden Trend Indicator
Noha Mohamed Fathy Younes Badr
4.9 (10)
Golden Trend indicator  is The best indicator for predicting trend movement this indicator never lags and never repaints and never back paints    and give  arrow buy and sell    before the candle appear  and it will help you and  will make your trading decisions clearer its work on all currencies and  gold and crypto and all time frame This unique  indicator uses very secret algorithms to catch the  trends, so you can trade using this indicator and see the trend clear on charts  manual guide and
FX Power MT4 NG
Daniel Stein
4.94 (18)
FX Power : Analysez la force des devises pour des décisions de trading plus intelligentes Aperçu FX Power est l'outil essentiel pour comprendre la force réelle des principales devises et de l'or, quelles que soient les conditions du marché. En identifiant les devises fortes à acheter et les faibles à vendre, FX Power simplifie vos décisions de trading et révèle des opportunités à forte probabilité. Que vous suiviez les tendances ou anticipiez les retournements à l'aide de valeurs extrêmes de D
Apollo Secret Trend est un indicateur de tendance professionnel qui peut être utilisé pour trouver des tendances sur n'importe quelle paire et période. L'indicateur peut facilement devenir votre principal indicateur de trading que vous pouvez utiliser pour détecter les tendances du marché, quelle que soit la paire ou la période que vous préférez négocier. En utilisant un paramètre spécial dans l'indicateur, vous pouvez adapter les signaux à votre style de trading personnel. L'indicateur fournit
- Lifetime update free Contact me for instruction, add group and any questions! Related Products:  Bitcoin Expert , Gold Expert - Non-repaint - I just sell my products in Elif Kaya profile, any other websites are stolen old versions, So no any new updates or support. Introduction The breakout and retest strategy is traded support and resistance levels. it involves price breaking through a previous level.  The break and retest strategy is designed to help traders do two main things, the first is
Algo Pumping MT4
Ihor Otkydach
5 (2)
PUMPING STATION – Votre stratégie personnelle «tout compris» Nous vous présentons PUMPING STATION – un indicateur Forex révolutionnaire qui transformera votre façon de trader en une expérience à la fois efficace et passionnante. Ce n’est pas seulement un assistant, mais un véritable système de trading complet, doté d’algorithmes puissants pour vous aider à trader de manière plus stable. En achetant ce produit, vous recevez GRATUITEMENT : Fichiers de configuration exclusifs : pour un réglage auto
Easy Breakout
Mohamed Hassan
5 (10)
After your purchase, feel free to contact me for more details on how to receive a bonus indicator called VFI, which pairs perfectly with Easy Breakout for enhanced confluence!   Easy Breakout is a powerful price action trading system built on one of the most popular and widely trusted strategies among traders: the Breakout strategy ! This indicator delivers crystal-clear Buy and Sell signals based on breakouts from key support and resistance zones. Unlike typical breakout indicators, it levera
TPSproTREND PrO
Roman Podpora
4.68 (25)
VERSION MT5        —        ИНСТРУКЦИЯ RUS           —        INSTRUCTIONS  ENG Fonctions principales : Signaux d'entrée précis SANS RENDU ! Si un signal apparaît, il reste d’actualité ! Il s'agit d'une différence importante par rapport aux indicateurs de redessinage, qui peuvent fournir un signal puis le modifier, ce qui peut entraîner une perte de fonds en dépôt. Vous pouvez désormais entrer sur le marché avec plus de probabilité et de précision. Il existe également une fonction de coloration
Gold Venamax MT4
Sergei Linskii
5 (1)
Gold Venamax   - c'est le meilleur indicateur technique boursier. L'algorithme de l'indicateur analyse l'évolution des prix d'un actif et reflète la volatilité et les zones d'entrée potentielles. Caractéristiques de l'indicateur: Il s'agit d'un super indicateur avec Magic et deux blocs de flèches de tendance pour un trading confortable et rentable. Le bouton rouge pour changer de bloc est affiché sur le graphique. La magie est définie dans les paramètres de l'indicateur, afin que vous puissiez
Volatility Trend System - un système de trading qui donne des signaux pour les entrées. Le système de volatilité donne des signaux linéaires et ponctuels dans le sens de la tendance, ainsi que des signaux pour en sortir, sans redessiner ni retarder. L'indicateur de tendance surveille la direction de la tendance à moyen terme, montre la direction et son changement. L'indicateur de signal est basé sur les changements de volatilité et montre les entrées sur le marché. L'indicateur est équipé de pl
Actuellement 20% de réduction ! La meilleure solution pour tout débutant ou trader expert ! Ce logiciel de tableau de bord fonctionne sur 28 paires de devises. Il est basé sur 2 de nos principaux indicateurs (Advanced Currency Strength 28 et Advanced Currency Impulse). Il donne un excellent aperçu de l'ensemble du marché Forex. Il montre les valeurs de l'Advanced Currency Strength, la vitesse de mouvement des devises et les signaux pour 28 paires de devises dans tous les (9) délais. Imaginez
Lux Trend
Mohamed Hassan
5 (3)
After purchase, please contact me to get your trading tips + more information for a great bonus!   Lux Trend is a professional strategy based on using Higher Highs and Lower Highs to identify and draw Trendline Breakouts! Lux Trend  utilizes two Moving Averages to confirm the overall trend direction before scanning the market for high-quality breakout opportunities, ensuring more accurate and reliable trade signals. This is a proven trading system used by real traders worldwide, demonstrating
TPSpro RFI Levels
Roman Podpora
4.85 (27)
INSTRUCTIONS       RUS   -   ANGLAIS       Il   est recommandé de l'utiliser avec un indicateur       -       TPSpro   TENDANCE PRO -   Version MT4         Bonus: 6 months of "RFI SIGNALS" subscription with your purchase! Un élément clé du trading est constitué par les zones ou les niveaux à partir desquels les décisions d'achat ou de vente d'un instrument de trading sont prises. Malgré les tentatives des principaux acteurs de dissimuler leur présence sur le marché, ils laissent inévitableme
IX Power MT4
Daniel Stein
4.75 (8)
IX Power : Découvrez des insights de marché pour les indices, matières premières, cryptomonnaies et forex Vue d’ensemble IX Power est un outil polyvalent conçu pour analyser la force des indices, matières premières, cryptomonnaies et symboles forex. Tandis que FX Power offre une précision maximale pour les paires de devises en utilisant toutes les données disponibles, IX Power se concentre exclusivement sur les données du symbole sous-jacent. Cela fait de IX Power un excellent choix pour les m
Introduction to X3 Chart Pattern Scanner X3 Cherart Pattern Scanner is the non-repainting and non-lagging indicator detecting X3 chart patterns including Harmonic pattern, Elliott Wave pattern, X3 patterns, and Japanese Candlestick patterns. Historical patterns match with signal patterns. Hence, you can readily develop the solid trading strategy in your chart. More importantly, this superb pattern scanner can detect the optimal pattern of its kind. In addition, you can switch on and off individu
FX Dynamic : Suivez la volatilité et les tendances grâce à une analyse ATR personnalisable Vue d’ensemble FX Dynamic est un outil performant s’appuyant sur les calculs de l’Average True Range (ATR) pour fournir aux traders des informations incomparables sur la volatilité quotidienne et intrajournalière. En définissant des seuils de volatilité clairs — par exemple 80 %, 100 % et 130 % — vous pouvez rapidement repérer des opportunités de profit ou recevoir des avertissements lorsque le marché dé
Currency Strength Wizard est un indicateur très puissant qui vous offre une solution tout-en-un pour un trading réussi. L'indicateur calcule la puissance de telle ou telle paire de devises en utilisant les données de toutes les devises sur plusieurs périodes. Ces données sont représentées sous la forme d'un indice de devise facile à utiliser et de lignes électriques de devise que vous pouvez utiliser pour voir la puissance de telle ou telle devise. Tout ce dont vous avez besoin est d'attacher l'
Gold Trend   - il s'agit d'un bon indicateur technique boursier. L'algorithme de l'indicateur analyse le mouvement du prix d'un actif et reflète la volatilité et les zones d'entrée potentielles. Les meilleurs signaux de l'indicateur: - Pour la VENTE = histogramme rouge + pointeur SHORT rouge + flèche de signalisation jaune dans la même direction. - Pour l'ACHETER = histogramme bleu + pointeur LONG bleu + flèche de signalisation aqua dans la même direction. Avantages de l'indicateur: 1. L'
Supply Demand Analyzer
Suvashish Halder
5 (6)
Supply Demand Analyzer is an advanced trading indicator meticulously designed for the precise identification, analysis, and management of supply and demand zones. By integrating real-time data and advanced algorithms, this tool enables traders to recognize market phases, price movements, and structural patterns with unparalleled accuracy. It simplifies complex market dynamics into actionable insights, empowering traders to anticipate market behavior, identify trading opportunities, and make info
Support Resistance screnner
STE S.S.COMPANY
4.94 (36)
Support And Resistance Screener est dans un indicateur de niveau pour MetaTrader qui fournit plusieurs outils à l'intérieur d'un indicateur. Les outils disponibles sont : 1. Filtre de structure de marché. 2. Zone de repli haussier. 3. Zone de recul baissier. 4. Points pivots quotidiens 5. points pivots hebdomadaires 6. Points pivots mensuels 7. Support et résistance forts basés sur le modèle harmonique et le volume. 8. Zones au niveau de la banque. OFFRE D'UNE DURÉE LIMITÉE : L'indicateur de sup
Daily Candle Predictor est un indicateur qui prédit le cours de clôture d'une bougie. L'indicateur est principalement destiné à être utilisé sur les graphiques D1. Cet indicateur convient à la fois au trading forex traditionnel et au trading d'options binaires. L'indicateur peut être utilisé comme un système de trading autonome, ou il peut servir de complément à votre système de trading existant. Cet indicateur analyse la bougie actuelle, calcule certains facteurs de force à l'intérieur du corps
Plus de l'auteur
Hummingbird
Sergey Zhukov
1.5 (2)
The Expert Advisor is based on the momentum of the price rate of change. When the speed of the price begins to increase sharply, the EA opens an order in the direction of its movement. Rate of Change is defined as the distance of StepPrice ticks that the price has moved for the period of TimePrice seconds. In contrast to the standard algorithm, virtual levels are modified not only after the TimePrice time, but also after the change of direction of the price movement—momentum. The built-in filter
The main rule of the profitable trading is opening trades in the direction of a trend. You can define the current trend using fractal analysis. Important Levels ResSup displays important price levels on the chart. The breakthrough of those levels shows the price direction. The data panel allows you to track the current trends on all timeframes. The current timeframe's important level values are shown in the comments. The indicator can be useful for traders working by levels. It can also be a par
The ProfileVolumesMarket indicator calculates tick volume on each price level in a selected range. Volume is vital when determining strength and therefore significance of price levels. The calculation range is set by a trader by means of moving two vertical lines. Thus the indicator allows to track important levels on different steps of a symbol price formation. A histogram of volume profile can be displayed on the chart (or removed from the chart) if you press "ON" ("OFF") button. When you chan
The indicator is created for professional trading by Fibonacci levels. AutoFiboLevels plots Fibonacci retracement and extension levels on impulse and corrective wave. The indicator unambiguously interprets a market situation. Points of extremum for level plotting are calculated using fractal analysis. A trader can independently set retracement and extension levels and calculation time frame adjusting the indicator for various strategies. Parameters: WorkTF - time frame for indicator calculation
The indicator calculation is based on the analysis of the price characteristics of bars and is adjusted by the ATR value. The degree of the ATR influence is determined by the ratio. The color scheme of the indicator depends on the direction of the current trend. A change in the trend is displayed by an arrow and a corresponding message. Depending on the strategy chosen by the trader, this indicator can be used to generate market entry signals, to place stop loss or close trades, and can also be
OnlyTrend
Sergey Zhukov
The indicator has been developed as a trading system component. It has proven to be an efficient technical tool when following a trend. The indicator shows the most suitable market entry points. It can be especially useful to those who add to positions after corrections in the trend direction. When a signal appears, the indicator generates an alert. The settings contain the depth of the indicator display history and ability to disable alerts. The signal is generated upon closing of the current
The main rule of the profitable trading is opening trades in the direction of a trend. You can define the current trend using fractal analysis. The Important Zone ResSup indicator displays important price support and resistance levels on the chart. The breakthrough or bounce from those levels shows further price direction. The data panel allows you to track the current trends on all timeframes. The current timeframe's important level values are shown in the comments. The indicator can be useful
RBCI hist
Sergey Zhukov
The RBCI hist indicator is an adaptive trend histogram, that eliminates noise using a Low-pass filter, which passes the lower frequencies and cuts off hight frequencies of the price fluctuations. The signal (depending on the strategy chosen by trader) is the intersection of the zero line by the indicator, as well as the change in the histogram color. The change in the histogram color serves as an early signal for opening positions towards the trend. The position of the indicator relative to the
The Volume Impuls VSA indicator paints a histogram of volumes tading into account the bar direction and comparing it with the volume of previous bars. The volume of the rising and falling trend are painted respectively in blue and in red. If the current volume exceeds the volumes of the opposite direction, an impulse is formed. Accordingly, the impulse of the upward and downward trends are painted in blue and orange. Also the indicator displays three levels, based on which you can easily compare
Indicator based trading according to the price analysis of bars, the most popular among traders. The indicators calculated based on larger periods are used for identification of a stable trend on the market, and the ones calculated based on smaller periods are used for entering the market after a correction. The oscillators with overbought and oversold levels have a special place in indicator-based trading. The values of such indicators are subjected to wave structure - the higher waves (chart t
Spring
Sergey Zhukov
This multifunctional Expert Advisor has been created in the form of a designer and is suitable both automatic and manual trading. Its main advantage is the ability to select and adjust the strategy for the current market conditions. To recover from the drawdown, the EA fully utilizes the feature of the currency market - the price cannot remain in a narrow channel for a long time. A breakout of the flat in one direction or another is inevitable. So, by placing orders in the breakout direction, yo
Stochastic is the indicator used by traders the most. This version allows to extract the maximum amount of information without hassle of constantly switching between the timeframes and, thereby, greatly simplifies working with it. This is a standard Stochastic oscillator provided with an info panel displaying the current relative position of %K and %D lines on all timeframes. The info panel is intuitive and easy to use. The oscillator is especially useful in scalping techniques when you need to
ADX is one of the indicators most commonly used by traders. This version allows to extract the maximum amount of information without hassle of constantly switching between the timeframes and, thereby, greatly simplifies working with it. This is a standard ADX indicator provided with an info panel displaying the current relative position of -DM and +DM lines on all timeframes. Blue circle - uptrend. Red circle - downtrend. Yellow circle - no trend. Blue arrow - (+DM) > (-DM); Red arrow - (-DM) >
Filtrer:
jmhuang
3147
jmhuang 2022.04.29 07:06 
 

similar to market profile and donchian channel

salco85 Litwinov
183
salco85 Litwinov 2020.09.27 15:47 
 

Индикатор очень хороший логика простая работы.Хочется увидеть от автора данного индикатора буфера чтобы в нем были.Чтобы бот можно было прописать.Очень он мне нравится !!!! Отличный продукт.

Iwan Iskandar
706
Iwan Iskandar 2016.11.26 17:41 
 

Great Indicator but it takes too much resources of my computer, but then again maybe is my computer is too old. Anyway this indicator is good in locating areas where the big players are buying or selling.

galungswa1
674
galungswa1 2016.04.24 12:49 
 

hello i bought your product but the result is different in demo, some support and resistance line is missing in real account please consider to check and up grade please

pokrat
1467
pokrat 2016.04.10 23:20 
 

One of the best indicators i've bought....

Richard Caughell
1524
Richard Caughell 2015.08.12 15:28 
 

Anybody who is a intraday trader wants this.......wow amazing I didnt realize how important these areas are when it revolves around volume. Yes Im a volume trader but I never looked at areas of the daily consolidation takes place. And guess a very high percentage of the time when price breaks these areas it makes a large rally. This should be developed into a daily scalping EA. Very powerful.

Aravind Kolanupaka
9155
Aravind Kolanupaka 2015.05.09 04:04 
 

Best indicator. I have seen other similar indicators selling for high amounts, and this one works great.

ABCD
241
ABCD 2015.04.16 02:26 
 

L'utilisateur n'a laissé aucun commentaire sur la note

Johannes Hermann
2310
Johannes Hermann 2015.03.23 09:03 
 

very helpful and reliable but no hg

Répondre à l'avis
Version 1.12 2021.11.29
Компиляция индикатора в новой версии платформы.
Version 1.1 2016.04.15
Added notification on the appearance of a new level.