SmartMass
- Indicateurs
- Roberto Alvarez
- Version: 4.13
- Mise à jour: 22 janvier 2024
- Activations: 5
SMARTMASS INDICATOR
This indicator is different from all known volume indicators. It has a significant distinction; it is an algorithm that relates price movement to volume, attempting to find proportionality and efficient movement while filtering out noise and other movements that are more random and do not follow a trend or reversal. Ultimately, it reveals the true strength of the movement, indicating whether it has genuine support from bulls or bears or if it's merely a high-volume movement that explains trading account balancing, a typical occurrence, for example, at the end of a sessions.
It doesn't matter whether we have real volume or tick volume. If the broker is large enough, tick volumes are correlated with real volume. This indicator provides an approximate but reality-adjusted information that assists you in making better decisions, increasing the probability of success.
INPUT PARAMETERS
General Parmeters:
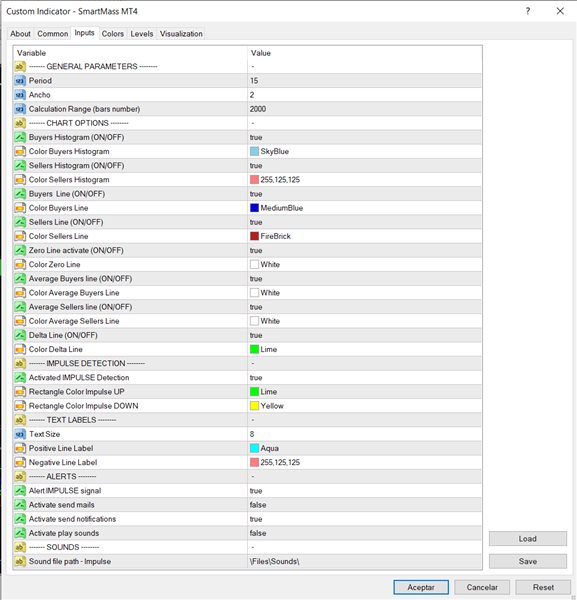
- Period: Period for the calculation of the SmartMass algorithm. The recommended value is 15. It has been tested on all typical timeframes and on different currency pairs, metals, indices, and commodities.
- Width: Line width of the histogram. Default value: 2.
- Calculation Range: The number of candles that the algorithm will consider to calculate the different lines of the SmartMass indicator. The default value is 2000. This is enough value for chart analysis; a higher value it will require more CPU load.
Chart Options:
- Active / Inactive (ON/OFF): To enable or disable each of the lines or objects that are part of the indicator
- Color: Selection of color for each of the lines or objects
Impulse Detection:
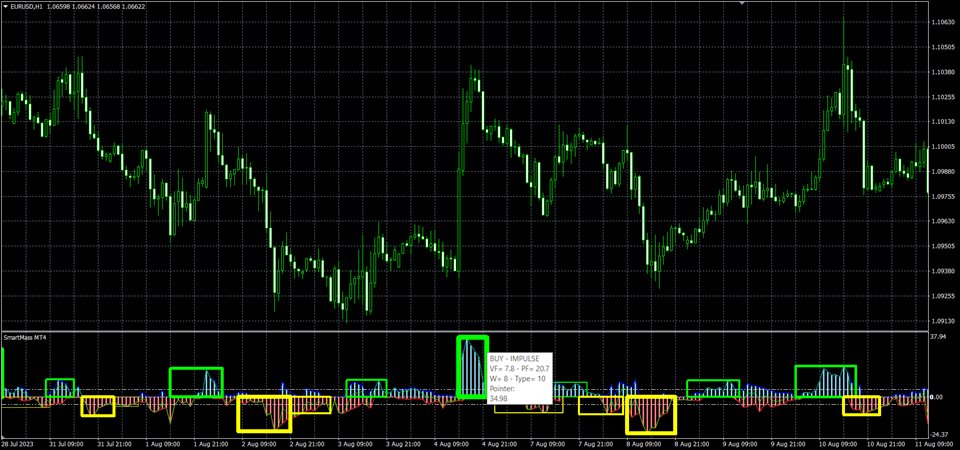
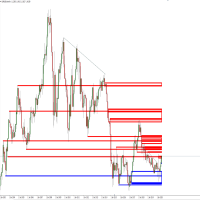
- Activate Impulse Detection: Enable or disable the impulse detection algorithm. This algorithm will detect relevant (bearish and bullish) impulses using rectangle-shaped graphical objects
- Color: Selection of color for bearish rectangle and bullish rectangle
Alerts:
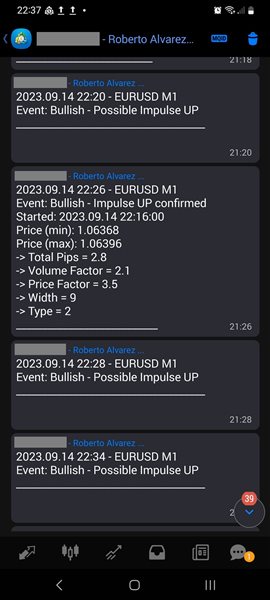
- Activate Alert impulse signal
- Activate send mails
- Activate send Notifications
- Activate play sounds
Sounds:
- Sound file path - Impulse: Specify the file path of the sound file that the user wants to play when an impulse is detected.
FEATURES
The indicator is composed of the following lines, curves:
- Positive volume line
- Positive volume histogram
- Negative volume line
- Negative volume histogram
- Average positive volume
- Average negative volume
- Delta signal (effective volume)
- Rectangle objects (Bullish impulses)
- Rectangle objects (Bearish impulses)
- Bullish arrow price
- Bearish arrow price
- Labels
HOW CAN THE SMARTMASS INDICATOR HELP US?
The SmartMass indicator is a tool that assists traders in the following ways:
-
Detects significant movements where there is a clear intent by bulls or bears: The SmartMass indicator can identify significant market movements in which participants, whether bulls or bears, display a clear intent. This means it can help traders identify moments when a significant change in price direction is occurring, which can be useful for making trading decisions.
-
Helps to better understand the balance between volume and price: The SmartMass indicator also provides information about the relationship between volume (whether tick volume or trading volume) and price. This is important because most of the time, the market is in a range or channel where prices move sideways. However, strong breakouts or trend changes occur only about 10% of the time. The indicator allows traders to anticipate when the balance between volume and price is tilting one way or the other, enabling them to prepare strategies accordingly. In other words, it helps identify moments when the market may be on the verge of breaking out of its usual range or channel, presenting an opportunity to capitalize on significant price movements.
-
The SmartMass indicator can be considered a valuable addition to Price Action analysis in trading. Price Action analysis is based on the study of price movements and patterns on the chart, without relying on external technical or fundamental indicators. In this context, the SmartMass indicator can provide additional and objective information that can assist traders in making more precise and informed decisions.
IMPULSE CONCEPT IN THE SMARTMASS INDICATOR
The SmartMass indicator not only helps in detecting impulses on chart but also categorizes it based on three key parameters: amplitude, width, and price effect. These three parameters are used to assign a numerical value to each momentum, ranging from 1 to 10. Here's how this classification works:
- Amplitude (VF): Amplitude refers to the magnitude or strength of the momentum. The higher the amplitude, the stronger the momentum. In the context of the SmartMass indicator, it evaluates how much the price changes during the momentum and assigns a numerical value based on that magnitude. Larger momentums will receive a higher score.
- Width (W): Width refers to the duration of the momentum in terms of time (number of candles). A wider momentum is one that extends over a longer period. The SmartMass indicator assesses how long the momentum lasts and assigns a numerical value based on its duration. Longer-lasting momentums will receive a lower score.
- Price Effect (PF): This parameter evaluates how the momentum affects the price. For example, a momentum that causes a significant price breakout or a trend change will have a stronger effect on the price than a momentum that only leads to a minor movement. The SmartMass indicator analyzes the impact of the momentum on the price and assigns a numerical value based on its significance in price change. Momentums that have a more notable effect on the price will receive a higher score.
- Classification (Type): The SmartMass indicator uses these three parameters (amplitude, width, and price effect) to classify momentums on a scale from 1 to 10, where 1 represents weaker and less significant momentums, and 10 represents stronger and more significant momentums in the market.
To view this classification and the different parameters that make up the momentum, simply position the mouse pointer over the rectangle. The information is displayed through a floating label.
Channel links:
https://www.mql5.com/en/channels/smartmass










I like it. I doubt I'm using it in the way it's intended, but as a component in my system it's a useful little tool. The author was also really helpful in assisting with queries. Many thanks!