PFKBreakOut
- Indicateurs
- Stanislav Korotky
- Version: 1.1
- Mise à jour: 27 janvier 2021
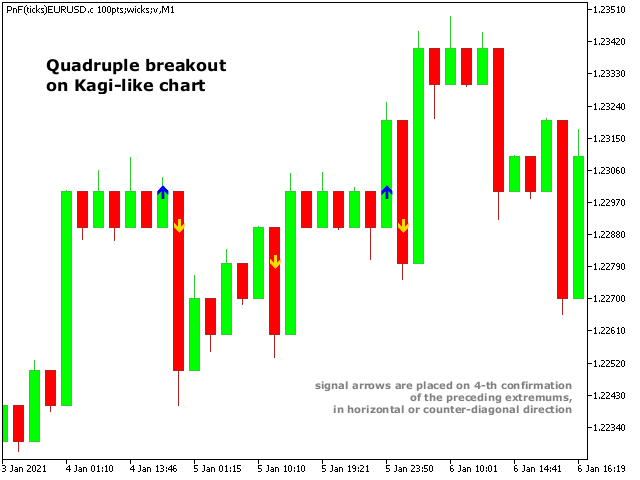
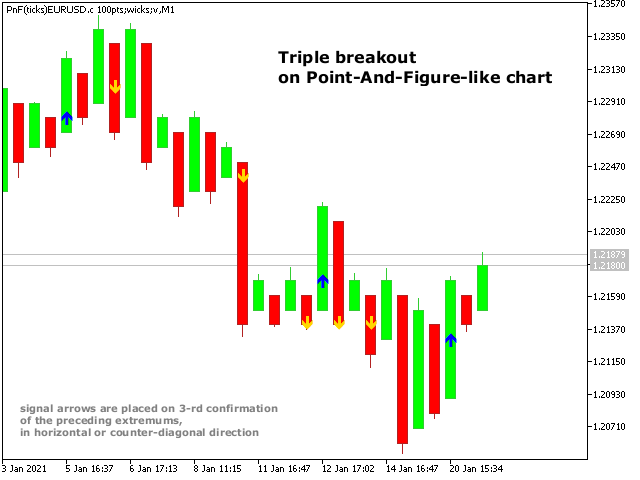
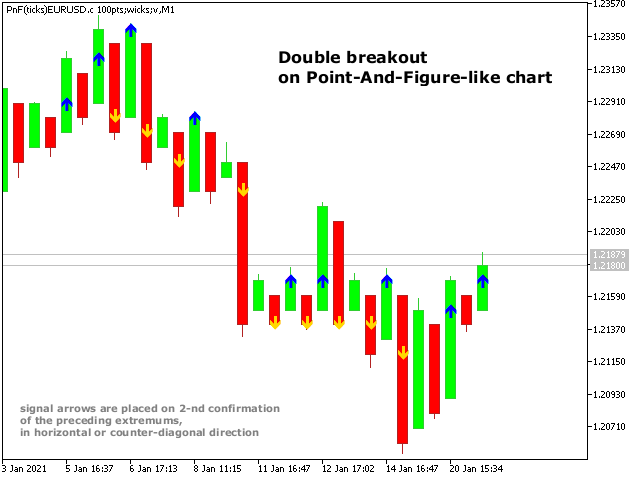
This indicator displays breakouts on Point-And-Figure-like or Kagi-like custom symbol charts, generated by special expert advisers, such as PointFigureKagiCharts.
This indicator is applicable only for custom instruments generated in appropriate way (with time-invariant bars which are multiples of a predefined box size). It makes no sense to apply it to other charts.
The breakouts in up or down direction are marked by arrows. The breakout price is found at crossing of one of imaginary lines of the following types:
- a horizontal level based on equal consecutive tops or bottoms;
- a diagonal based on gradually increased bottoms or decreased tops;
Parameters
- Order - the number of nearby extremums on the imaginary line, required to detect a breakout; for example, value 3 means "triple" breakout, that is 2 tops/bottoms with retracement are searched to the left of the current bar, and on the 3-rd touch of the level (if it's occured), the breakout is detected; value 2 (minimal allowed) means "double" breakout, that is breakout on the 2-nd touch of the extremum line;


