Imagic06
- Indicateurs
- Aleksandr Morozov
- Version: 4.3
- Activations: 5
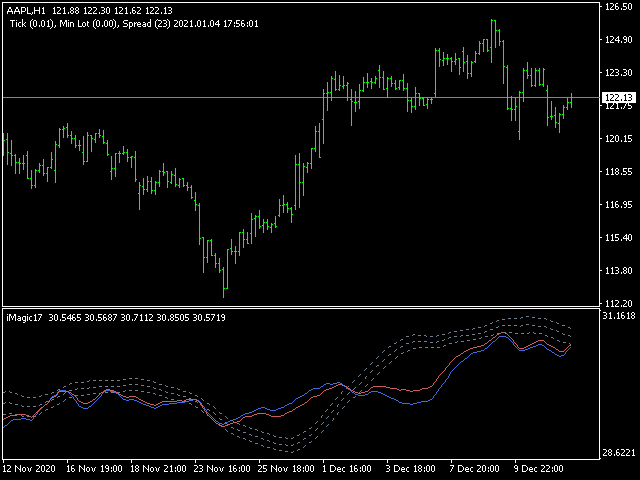
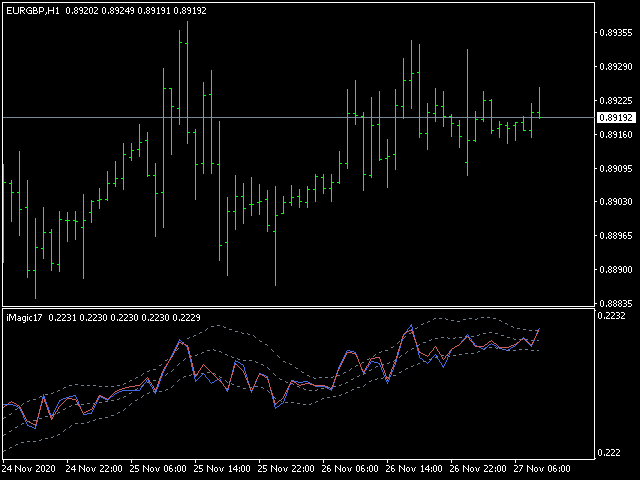
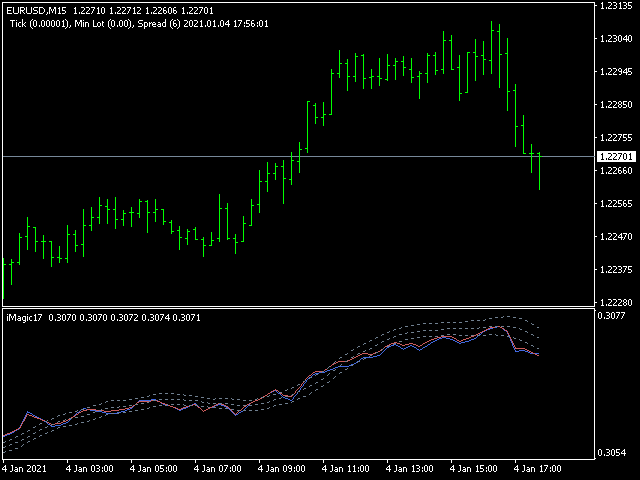
The indicator represents 2 lines of different periods: one line is short-term (red line), the other is long-term (blue line). Each of the lines is a hard Moving Average, weighted by many parameters. Accordingly, you need to trade according to chart volatility. For convenience, the indicator has been added moving averages of the High, Low, Median ((High-Low) / 2) periods.
Input parameters:
IndicatorPeriod: several periods (general- general period, calculation for all periods; small- short-term period; medium- medium period; long- long period).
AverageCalculation- when calculating, use averaged volumes (you need to remove the dependence on volumes when calculating).
ShowAverageLine- show the middle line between two indicator lines.
!! The indicator is overloaded, so there may be slight freezes on the online chart. To avoid this, you need to partially delete the history of the chart. !!
Tags: Bollinger Bands, Standard Deviation, MA, Moving Average.