• Aperçu
  • Avis
  • Commentaires

Long Short Pro

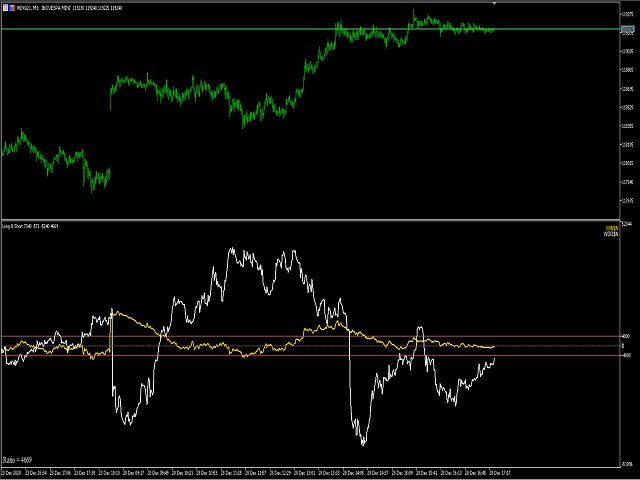
Indicateur Long & Short - Version Pro : Déverrouillez le Potentiel Illimité de Votre Analyse de Marché ! 📈🚀

🌟 Aucune Limite pour Tous les Actifs
La version Pro de l’indicateur Long & Short vous offre une liberté totale pour l’utiliser sur tout actif financier. Plus de limitations – appliquez le même indicateur à tous vos actifs préférés !

🔓 Sans Limites
Profitez de toutes les fonctionnalités de l’indicateur sans aucune restriction. La version Pro vous offre une expérience complète et illimitée, vous permettant de maximiser chaque opportunité de marché.

💡 Fonctionnalités de la Version Pro

  • Accès Illimité : Utilisez l’indicateur sur tous les actifs financiers et explorez son potentiel complet.
  • Précision Avancée : Bénéficiez d'analyses détaillées et de signaux clairs pour prendre des décisions éclairées et sécurisées.
  • Flexibilité Totale : Ajustez l’indicateur en fonction de vos besoins spécifiques de trading, peu importe l’actif ou la stratégie.

🔔 Recevez des Alertes pour les Opportunités Clés
Activez les alertes pour surveiller de près les niveaux importants et restez toujours à l’avant-garde des opportunités du marché.

Paramètres des Buffers pour la Création d'EAs

Pour la création d'Expert Advisors (EAs), utilisez les buffers suivants :

  • Buffer Symbole 1 = 0
  • Buffer Symbole 2 = 2

Pourquoi Choisir la Version Pro ?

🔹 Liberté Totale : Appliquez l’indicateur à n’importe quel actif sans restrictions. 🔹 Expérience Complète : Accédez à toutes les fonctionnalités et analyses détaillées. 🔹 Analyse Complète : Idéal pour les traders cherchant à maximiser leur potentiel sur divers marchés.

🌟 Obtenez la Version Pro Maintenant ! 🌟
Ne manquez pas l’opportunité d’améliorer votre analyse de marché avec la version Pro de l’indicateur Long & Short. Déverrouillez toutes les fonctionnalités sans limitations et élevez votre trading à un niveau supérieur : Achetez la Version Pro

Élevez votre analyse de marché au niveau supérieur !


Produits recommandés
The indicator detects and displays М. Gartley's Butterfly pattern. The pattern is plotted by the extreme values of the ZigZag indicator (included in the resources, no need to install). After detecting the pattern, the indicator notifies of that by the pop-up window, a mobile notification and an email. The pattern and wave parameters are displayed on the screenshots. The default parameters are used for demonstration purposes only in order to increase the amount of detected patterns. Parameters
Follow The Line MT5
Oliver Gideon Amofa Appiah
4.5 (28)
This indicator obeys the popular maxim that: "THE TREND IS YOUR FRIEND" It paints a GREEN line for BUY and also paints a RED line for SELL. (you can change the colors). It gives alarms and alerts of all kinds. IT DOES NOT REPAINT and can be used for all currency pairs and timeframes. Yes, as easy and simple as that. Even a newbie can use it to make great and reliable trades. NB: For best results, get my other premium indicators for more powerful and reliable signals. Get them here: https://www.m
FREE
Le Capteur de Tendance : La Stratégie du Capteur de Tendance avec Indicateur d'Alerte est un outil d'analyse technique polyvalent qui aide les traders à identifier les tendances du marché et les points d'entrée et de sortie potentiels. Elle présente une stratégie dynamique de Capteur de Tendance, s'adaptant aux conditions du marché pour une représentation visuelle claire de la direction de la tendance. Les traders peuvent personnaliser les paramètres selon leurs préférences et leur tolérance
FREE
Vip Gold
Ignacio Agustin Mene Franco
VIP Gold It has the last indicator of the session Gold of the 4! It works in all temporalities. It is an indicator where it marks blocks of structures. the rebounds are on the red line up, and the green line down depending on which pair you use it, It is made for synthetic indices, crash and boom pairs It works as support and resistance also to better find the floor and ceiling of each pair.
What is this indicator? This indicator is the MACD (Moving Average Convergence/Divergence) supporting Virtual Trading mode of  Knots Compositor . When the mode is turned on, the indicator will be recalculated based on the displayed candlesticks. When the mode is turned off, the indicator will be recalculated based on the original chart candlesticks. Types of the applied price - Close - Open - High - Low - Median Price (HL/2) - Typical Price (HLC/3) - Weighted Price (HLCC/4) KC-Indicators
FREE
LT Rainbow Trend
Thiago Duarte
5 (1)
Do you, like me, like to trade with the trend? Then this indicator will help you! Rainbow Trend is a trend indicator, which uses several Moving Averages on the chart. It measures different trend strenght zones for different periods: very long term, long term, mid term, short term and very short term. Each zone has its color, and it is possible to have sound alert when the prices leaves a zone and enters another. Its configuration is very simple. If you find any bug or have any suggestions, co
Donchian Channel DC is the indicator of Donchian Channels, that plots maximum and minimum values of a specific period, besides mean value line. It´s possible to configure simple period for analysis and the indicator will plot all three values. You can trade with this indicator as trend or reversal, according to each strategy. Do not let to test others indicators as soon as others expert advisors.
PVA Color Candle
Ricardo Almeida Branco
Several techniques use volume as an important point in the trade. Whether to indicate strength, exhaustion, pullback weakness, among others. In chief I quote Richard Wyckoff's theory, which said about the importance of looking price and volume. However, there are several possibilities to filter what is volume that should be noticed. PVRSA/PVA users use an indicator with specific colors, which assist in identifying the volume and type of movement that the price has made. Will the high
An oscillator that shows price changes and identifies areas of overbought and oversold. It can also show trend reversal points. WaveTrend Oscillator is a port of a famous TS /MT indicator. When the oscillator is above the overbought band (red lines) and crosses down the signal (solid line), it is usually a good SELL signal. Similarly, when the oscillator crosses above the signal when below the Oversold band (green lines), it is a good BUY signal. Good luck.
Combined
Ahmed Alaaeldin Abdulrahman Ahmed Elherzawi
5 (1)
Welcome to Investment Castle products This product is exclusively available in the MQL5 market and is not available and will not be available anywehere else. The Combined indicator is a multi-time frame indicator and it is built using 3 indicators: Bands indicator which draws the support and resistance key levels using up to 5 different time frames Patterns indicator which draws the chart patterns using up to 6 different time frames Spots indicator which shows the common candlestick patterns Yo
Discover the Power of Automatic Fibonacci Analysis! Elevate your trading strategy with our free Fibonacci Retracement Indicator – a dynamic tool designed to streamline your technical analysis and enhance your decision-making process. Key Features: Smart Automatic Drawing: Say goodbye to manual calculations! Our indicator intelligently identifies swing highs and lows, instantly drawing Fibonacci levels for you. Real-Time Updates: Stay ahead of the market with Fibonacci levels that automatically a
FREE
Owl Smart Levels MT5
Sergey Ermolov
4.07 (28)
Version MT4   |  FAQ L' indicateur Owl Smart Levels est un système de trading complet au sein d'un seul indicateur qui comprend des outils d'analyse de marché populaires tels que les fractales avancées de Bill Williams , Valable ZigZag qui construit la structure d'onde correcte du marché et les niveaux de Fibonacci qui marquent les niveaux exacts d'entrée. sur le marché et les endroits où prendre des bénéfices. Description détaillée de la stratégie Mode d'emploi de l'indicateur Conseiller-Assis
LT Donchian Channel
Thiago Duarte
4.75 (4)
Donchian Channel is an indicator created by Richard Donchian. It is formed by taking the highest high and the lowest low of the last specified period in candles. The area between high and low is the channel for the chosen period. Its configuration is simple. It is possible to have the average between the upper and lower lines, plus you have alerts when price hits one side. If you have any questions or find any bugs, please contact me. Enjoy!
FREE
Free automatic Fibonacci is an indicator that automatically plots a Fibonacci retracement based on the number of bars you select on the BarsToScan setting in the indicator. The Fibonacci is automatically updated in real time as new highest and lowest values appears amongst the selected bars. You can select which level values to be displayed in the indicator settings. You can also select the color of the levels thus enabling the trader to be able to attach the indicator several times with differe
FREE
Important Lines
Terence Gronowski
4.85 (20)
This indicator displays Pivot-Lines, preday high and low, preday close and the minimum and maximum of the previous hour. You just have to put this single indicator to the chart to have all these important lines, no need to setup many single indicators. Why certain lines are important Preday high and low : These are watched by traders who trade in a daily chart. Very often, if price climbs over or falls under a preday low/high there is an acceleration in buying/selling. It is a breakout out of
FREE
Are you tired of drawing trendlines every time you're analyzing charts? Or perhaps you would like more consistency in your technical analysis. Then this is for you. This indicator will draw trend lines automatically when dropped on a chart. How it works Works similar to standard deviation channel found on mt4 and mt5. It has 2 parameters: 1. Starting Bar 2. Number of bars for calculation The   starting bar   is the bar which drawing of the trend lines will begin, while the   number of bars for c
FREE
The Penta-O is a 6-point retracement harmonacci pattern which usually precedes big market movements. Penta-O patterns can expand and repaint quite a bit. To make things easier this indicator implements a twist: it waits for a donchian breakout in the right direction before signaling the trade. The end result is an otherwise repainting indicator with a very reliable trading signal. The donchian breakout period is entered as an input. [ Installation Guide | Update Guide | Troubleshooting | FAQ | A
FVG Indicator
Daniel Moises Pimentel Flores
This indicator identifies and highlights market inefficiencies, known as Fair Value Gaps (FVG), on price charts. Using a custom algorithm, the indicator detects these areas of imbalance where the price moves sharply, creating potential trading opportunities. Indicator Parameters: Bullish FVG Color (clrBlue) : Color used to highlight bullish inefficiencies. The default value is blue. Bearish FVG Color (clrRed) : Color used to highlight bearish inefficiencies. The default value is red. Bullish FVG
FREE
YOU CAN NOW DOWNLOAD FREE VERSIONS OF OUR PAID INDICATORS . IT'S OUR WAY OF GIVING BACK TO THE COMMUNITY ! >>>    GO HERE TO DOWNLOAD The   Volatility Ratio   was developed by Jack D. Schwager to identify trading range and signal potential breakouts. The volatility ratio is defined as the current day's true range divided by the true range over a certain number of days N (i.e. N periods). The following formula is used to calculate the volatility ratio: Volatility Ratio (VR) = Today's True Rang
FREE
Reversal Composite Candles
MetaQuotes Ltd.
3.57 (14)
The idea of the system is to indentify the reversal patterns using the calculation of the composite candle. The reversal patterns is similar to the "Hammer" and "Hanging Man" patterns in Japanese candlestick analysis. But it uses the composite candle instead the single candle and doesn't need the small body of the composite candle to confirm the reversal. Input parameters: Range - maximal number of bars, used in the calculation of the composite candle. Minimum - minimal size of the composite can
FREE
Point Black
Ignacio Agustin Mene Franco
Black Card Pack indicator 5/1 point black It has the strategy of professional bollingers where each arrow gives you a different entry signal. It is used to operate in m1 and in d1 It is used for scalping and intraday, modified for forex markets ! suitable for all pairs modified for synthetic index markets suitable for all pairs! Ideal for volatility and jumps!
Mitimom
Danil Poletavkin
The indicator is based on Robert Miner's methodology described in his book "High probability trading strategies" and displays signals along with momentum of 2 timeframes. A Stochastic oscillator is used as a momentum indicator. The settings speak for themselves period_1 is the current timeframe, 'current' period_2 is indicated - the senior timeframe is 4 or 5 times larger than the current one. For example, if the current one is 5 minutes, then the older one will be 20 minutes The rest of the
FREE
Prop EA
Ian Nganga Comba
Soutenez les produits gratuits sur ce compte. Utilisez ce lien pour vous inscrire auprès de notre courtier recommandé . Vous en avez assez d'acheter des tests auprès de fournisseurs Prop et de subir des pertes ? Ne cherchez plus – Funding EA est là pour changer la donne ! Cet EA non seulement peut réussir les tests des fournisseurs Prop, mais garantit également le REMBOURSEMENT si le test échoue. Avec Funding EA, vous pouvez essayer autant de tests que vous le souhaitez sans vous soucier des f
FREE
Gino Renko
Stephane, Andr Valette
1 (1)
Encore un indicateur basé sur le renko. Il retourne différentes valeurs utilisables pour un EA, et est directement affiché sur le graphique principale. Son réglage est très simple: La taille du renko Le nombre de barres prises en compte La couleur à la baisse La couleur à la hausse Les valeurs retournées: Buffer 0 : Valeur du millieu Buffer 1 : Valeur haute Buffer 2 : Value basse Buffer 3 : Direction du renko (0.0 pour la hausse; 1.0 for la baisse) Buffer 4 : Ratio du renko, par exemple,
Order Book, known also as Market Book, market depth, Level 2, - is a dynamically updated table with current volumes of orders to buy and to sell specific financial instument at price levels near Bid and Ask. MetaTrader 5 provides the means for receiving market book from your broker, but in real time only, without access to its history. The indicator OrderBook Cumulative Indicator accumulates market book data online and visualizes them on the chart. In addition, the indicator can show the market
TrendDetect
Pavel Gotkevitch
The Trend Detect indicator combines the features of both trend indicators and oscillators. This indicator is a convenient tool for detecting short-term market cycles and identifying overbought and oversold levels. A long position can be opened when the indicator starts leaving the oversold area and breaks the zero level from below. A short position can be opened when the indicator starts leaving the overbought area and breaks the zero level from above. An opposite signal of the indicator can
Tops and Bottoms Indicator
Josue De Matos Silva
4.67 (6)
Tops & Bottoms Indicator FREE   Tops abd Bottoms:   An effective indicator for your trades The tops and bottoms indicator helps you to find  ascending and descending channel formations with indications of ascending and/or descending tops and bottoms. In addition, it  show possibles  opportunities with a small yellow circle when the indicator encounters an impulse formation. This indicator provide to you  more security and speed in making entry decisions. Also test our FREE advisor indicator:
FREE
Это классический вариант реализации экспоненциальной скользящей средней с коррекций ошибки, какой используется в индикаторах DEMA и TEMA. Соответственно названию, глубина коррекции ошибки увеличена до 33. Индикатор оптимизирован. Потребляет минимально возможные ресурсы. Достаточно быстр, учитывая объёмность вычислений. Может накладываться на другие индикаторы. Как и обычные скользящие средние, nEma_33 не перерисовывается (за исключением нулевого бара). Требуется история > Период*33*33. Согласно
Rainbow MT5
Jamal El Alama
4 (1)
Description : Rainbow MT5 is a technical indicator based on Moving Average with period 34 and very easy to use. When price crosses above MA and MA changes color to green, then this is a signal to buy. When price crosses below MA and MA changes color to red, then this is a signal to sell. The Expert advisor ( Rainbow EA MT5 ) based on Rainbow MT5 indicator is now available here . MT4 version is available here .
FREE
Half ma
Artem Svistunov
The Half ma arrow indicator for the MetaTrader 5 trading terminal is a simple but effective tool that gives a signal about a change in the current trend. The Half ma indicator looks like a solid dynamic line that changes color at the points where the trend changes. At these points, the indicator draws arrows of the corresponding color and direction.The Half ma arrow indicator for the MT5 terminal is not an independent source of input signals. It will be most effective to use it as a trend filte
Les acheteurs de ce produit ont également acheté
TPSpro RFI Levels MT5
Roman Podpora
4.73 (11)
INSTRUCTIONS       RUS   -   ANGLAIS       Il   est recommandé de l'utiliser avec un indicateur       -       TPSpro   TENDANCE PRO -   Version MT4         Un élément clé du trading est constitué par les zones ou les niveaux à partir desquels les décisions d'achat ou de vente d'un instrument de trading sont prises. Malgré les tentatives des principaux acteurs de dissimuler leur présence sur le marché, ils laissent inévitablement des traces. Notre tâche était d'apprendre à identifier ces traces
TPSproTREND PrO MT5
Roman Podpora
4.89 (9)
TPSpro TREND PRO  - is a trend indicator that automatically analyzes the market and provides information about the trend and each of its changes, as well as giving signals for entering trades without redrawing! The indicator uses each candle, analyzing them separately. referring to different impulses - up or down impulse. Exact entry points into transactions for currencies, crypto, metals, stocks, indices!  Version MT4               DETAILED DESCRIPTION               R ecommended to use with an
Atomic Analyst MT5
Issam Kassas
4.42 (19)
Tout d'abord, il convient de souligner que cet indicateur de trading n'est ni repainting, ni redrawing et ne présente aucun délai, ce qui le rend idéal à la fois pour le trading manuel et automatisé. Manuel de l'utilisateur : réglages, entrées et stratégie. L'Analyste Atomique est un indicateur d'action sur les prix PA qui utilise la force et le momentum du prix pour trouver un meilleur avantage sur le marché. Équipé de filtres avancés qui aident à éliminer les bruits et les faux signaux, et à
Tout d'abord, il convient de souligner que ce système de trading est un indicateur non repeint, non redessiné et non retardé, ce qui le rend idéal pour le trading manuel et automatisé. Cours en ligne, manuel et téléchargement de préréglages. Le "Système de Trading Smart Trend MT5" est une solution de trading complète conçue pour les traders débutants et expérimentés. Il combine plus de 10 indicateurs premium et propose plus de 7 stratégies de trading robustes, ce qui en fait un choix polyvalent
Quantum Trend Sniper
Bogdan Ion Puscasu
4.8 (49)
Présentation       Quantum Trend Sniper Indicator   , l'indicateur révolutionnaire MQL5 qui transforme la façon dont vous identifiez et négociez les inversions de tendance ! Développé par une équipe de traders expérimentés avec une expérience commerciale de plus de 13 ans,       Indicateur Quantum Trend Sniper       est conçu pour propulser votre parcours de trading vers de nouveaux sommets grâce à sa manière innovante d'identifier les inversions de tendance avec une précision extrêmement élevée
Ce tableau de bord affiche les derniers   modèles harmoniques   disponibles pour les symboles sélectionnés, ce qui vous permettra de gagner du temps et d'être plus efficace /   version MT4 . Indicateur gratuit:   Basic Harmonic Pattern Colonnes de l'indicateur Symbol :   les symboles sélectionnés apparaissent Trend   :   haussière ou baissière Pattern :   type de motif (gartley, papillon, chauve-souris, crabe, requin, cypher ou ABCD) Entry:   prix d'entrée SL:   prix du stop loss TP1:   1
FX Power MT5 NG
Daniel Stein
5 (5)
Obtenez votre mise à jour quotidienne du marché avec des détails et des captures d'écran via notre Morning Briefing ici sur mql5 et sur Telegram ! FX Power MT5 NG est la nouvelle génération de notre très populaire indicateur de force des devises, FX Power. Et qu'est-ce que ce compteur de force de nouvelle génération offre ? Tout ce que vous avez aimé de l'original FX Power PLUS Analyse de la force de l'OR/XAU Des résultats de calcul encore plus précis Périodes d'analyse configurables individuel
Tout d'abord, il convient de souligner que cet outil de trading est un indicateur non repeint, non redessiné et non retardé, ce qui le rend idéal pour le trading professionnel. Cours en ligne, manuel utilisateur et démonstration. L'indicateur Smart Price Action Concepts est un outil très puissant à la fois pour les nouveaux et les traders expérimentés. Il regroupe plus de 20 indicateurs utiles en un seul, combinant des idées de trading avancées telles que l'analyse du trader Inner Circle et
AT Forex Indicator MT5
Marzena Maria Szmit
5 (4)
The AT Forex Indicator MT5 is a sophisticated trading tool designed to provide traders with a comprehensive analysis of multiple currency pairs. This powerful indicator simplifies the complex nature of the forex market, making it accessible for both novice and experienced traders. AT Forex Indicator uses advanced algorithms to detect trends, patterns and is an essential tool for traders aiming to enhance their forex trading performance. With its robust features, ease of use, and reliable signal
TrendMaestro5
Stefano Frisetti
note: this indicator is for METATRADER4, if you want the version for METATRADER5 this is the link:  https://www.mql5.com/it/market/product/108106 TRENDMAESTRO ver 2.4 TRENDMAESTRO recognizes a new TREND in the bud, he never makes mistakes. The certainty of identifying a new TREND is priceless. DESCRIPTION TRENDMAESTRO identifies a new TREND in the bud, this indicator examines the volatility, volumes and momentum to identify the moment in which there is an explosion of one or more of these data a
TPA True Price Action indicator reveals the true price action of the market makers through 100% non-repainting signals strictly at the close of a candle! TPA shows entries and re-entries, every time the bulls are definitely stronger than the bears and vice versa. Not to confuse with red/green candles. The shift of power gets confirmed at the earliest stage and is ONE exit strategy of several. There are available now two free parts of the TPA User Guide for our customers. The first "The Basics"
FxaccurateLS
Shiv Raj Kumawat
WHY IS OUR FXACCCURATE LS MT5 THE PROFITABLE ? PROTECT YOUR CAPITAL WITH RISK MANAGEMENT Gives entry, stop and target levels from time to time. It finds Trading opportunities by analyzing what the price is doing during established trends. POWERFUL INDICATOR FOR A RELIABLE STRATEGIES We have made these indicators with a lot of years of hard work. It is made at a very advanced level. Established trends provide dozens of trading opportunities, but most trend indicators completely ignore them!
Auto Order Block with break of structure based on ICT and Smart Money Concepts (SMC) Futures Break of Structure ( BoS )             Order block ( OB )            Higher time frame Order block / Point of Interest ( POI )    shown on current chart           Fair value Gap ( FVG ) / Imbalance   -  MTF      ( Multi Time Frame )    HH/LL/HL/LH  -  MTF      ( Multi Time Frame )  Choch  MTF      ( Multi Time Frame )  Volume Imbalance     ,  MTF          vIMB Gap’s Power of 3 Equal High
Advanced Supply Demand MT5
Bernhard Schweigert
4.5 (14)
La meilleure solution pour tout commerçant débutant ou expert ! Cet indicateur est un outil de trading unique, de haute qualité et abordable car nous avons intégré un certain nombre de fonctionnalités propriétaires et une nouvelle formule. Avec cette mise à jour, vous pourrez afficher des zones à double horaire. Vous pourrez non seulement afficher un TF plus élevé, mais afficher les deux, le graphique TF, PLUS le TF supérieur : AFFICHAGE DES ZONES NICHÉES. Tous les traders Supply Demand vont ado
Top indicator for MT5   providing accurate signals to enter a trade without repainting! It can be applied to any financial assets:   forex, cryptocurrencies, metals, stocks, indices .  Watch  the video  (6:22) with an example of processing only one signal that paid off the indicator! MT4 version is here It will provide pretty accurate trading signals and tell you when it's best to open a trade and close it. Most traders improve their trading results during the first trading week with the help of
Matrix Arrow Indicator MT5
Juvenille Emperor Limited
5 (12)
Matrix Arrow Indicator MT5   est une tendance unique 10 en 1 suivant un indicateur multi-période   100% non repeint   qui peut être utilisé sur tous les symboles/instruments:   forex ,   matières premières ,   crypto-monnaies ,   indices ,  actions .  Matrix Arrow Indicator MT5  déterminera la tendance actuelle à ses débuts, en rassemblant des informations et des données à partir d'un maximum de 10 indicateurs standard, qui sont: Indice de mouvement directionnel moyen (ADX) Indice de canal de m
Blahtech Supply Demand MT5
Blahtech Limited
4.54 (13)
Was: $299  Now: $99   Supply Demand uses previous price action to identify potential imbalances between buyers and sellers. The key is to identify the better odds zones, not just the untouched ones. Blahtech Supply Demand indicator delivers functionality previously unavailable on any trading platform. This 4-in-1 indicator not only highlights the higher probability zones using a multi-criteria strength engine, but also combines it with multi-timeframe trend analysis, previously confirmed swings
Was: $249  Now: $99   Market Profile defines a number of day types that can help the trader to determine market behaviour. A key feature is the Value Area, representing the range of price action where 70% of trading took place. Understanding the Value Area can give traders valuable insight into market direction and establish the higher odds trade. It is an excellent addition to any system you may be using. Inspired by Jim Dalton’s book “Mind Over Markets”, this indicator is designed to suit the
PZ Swing Trading MT5
PZ TRADING SLU
5 (4)
Protect against whipsaws: revolutionize your swing trading approach Special Offer: Purchase now to receive free bonuses worth $135! (Read more for details) Swing Trading is the first indicator designed to detect swings in the direction of the trend and possible reversal swings. It uses the baseline swing trading approach, widely described in trading literature. The indicator studies several price and time vectors to track the aggregate trend direction and detects situations in which the market i
FX Volume MT5
Daniel Stein
4.93 (14)
Obtenez votre mise à jour quotidienne du marché avec des détails et des captures d'écran via notre Morning Briefing ici sur mql5 et sur Telegram ! FX Volume est le PREMIER et SEUL indicateur de volume qui fournit un VRAI aperçu du sentiment du marché du point de vue d'un courtier. Il fournit des informations impressionnantes sur la façon dont les acteurs institutionnels du marché, comme les courtiers, sont positionnés sur le marché des changes, bien plus rapidement que les rapports COT. Voir c
Trade smarter, not harder: Empower your trading with Harmonacci Patterns Special Offer: Purchase now to receive free bonuses worth $165! (Read more for details) This is arguably the most complete harmonic price formation auto-recognition indicator you can find for the MetaTrader Platform. It detects 19 different patterns, takes fibonacci projections as seriously as you do, displays the Potential Reversal Zone (PRZ) and finds suitable stop-loss and take-profit levels. [ Installation Guide | Up
XQ Indicator MetaTrader 5
Marzena Maria Szmit
3 (2)
Step into the realm of Forex trading with confidence and precision using XQ, a cutting-edge Forex indicator designed to elevate your trading game to unprecedented heights. Whether you're a seasoned trader or just stepping into the world of currency exchange, XQ Forex Indicator empowers you with the insights and signals needed to make informed trading decisions. The signal conditions are a combination of three indicators, and XQ Forex Indicator only display  medium and long-term trends . The ind
Noize Absorption Index - is the manual trading system that measures the difference of pressure between bears forces and bulls forces. Green line - is a noize free index that showing curent situation. Zero value of index shows totally choppy/flat market.Values above zero level shows how powerfull bullish wave is and values below zero measures bearish forces.Up arrow appears on bearish market when it's ready to reverse, dn arrow appears on weak bullish market, as a result of reverse expectation.
Golden Spikes Premium
Kwaku Bondzie Ghartey
5 (1)
Golden Spikes Detector Acknowledgement and Dedications:  The name of this indicator was Inspired by an Original; Mr Grant Koopman; a Knowledgeable and experienced Synthetics trader. I dedicate this indicator to Mr Grant.  Overview: The Golden Spikes Premium is a groundbreaking trading indicator meticulously crafted for the Boom and Crash indices on the Deriv market. Tailored to meet the needs of discerning traders, this powerful tool operates exclusively on the one-minute timeframe, providin
Gold Trend 5
Sergei Linskii
5 (1)
Gold Trend - il s'agit d'un bon indicateur technique boursier. L'algorithme de l'indicateur analyse le mouvement du prix d'un actif et reflète la volatilité et les zones d'entrée potentielles. Les meilleurs signaux de l'indicateur: - Pour la VENTE = histogramme rouge + pointeur SHORT rouge + flèche de signalisation jaune dans la même direction. - Pour l'ACHETER = histogramme bleu + pointeur LONG bleu + flèche de signalisation aqua dans la même direction. Avantages de l'indicateur: 1
Ce tableau de bord découvre et affiche les zones   d'offre   et de   demande   sur le graphique, à la fois en mode scalping et à long terme, en fonction de votre stratégie de trading pour les symboles sélectionnés. En outre, le mode scanner du tableau de bord vous permet de vérifier tous les symboles souhaités en un coup d'œil et de ne manquer aucune position appropriée /   Version MT4 Indicateur gratuit:   Basic Supply Demand Caractéristiques Permet de visualiser les opportunités de tr
The Price Action Finder Multi indicator is an indicator of entry points that searches for and displays Price Action system patterns on dozens of trading instruments and on all standard time frames: (m1, m5, m15, m30, H1, H4, D1, Wk, Mn). The indicator places the found patterns in a table at the bottom of the screen. By clicking on the pattern names in the table, you can move to the chart where this pattern is located. Manual (Be sure to read before purchasing) | Version for MT4 Advantages 1. Pa
Automated Trendlines MT5
Georgios Kalomoiropoulos
Les lignes de tendance sont l'outil d'analyse technique le plus essentiel dans le trading forex. Malheureusement, la plupart des commerçants ne les dessinent pas correctement. L'indicateur Automated Trendlines est un outil professionnel pour les traders sérieux qui vous aide à visualiser le mouvement de tendance des marchés. Il existe deux types de lignes de tendance, les lignes de tendance haussières et les lignes de tendance baissières. Dans la tendance haussière, la ligne de tendance
MetaForecast M5
Vahidreza Heidar Gholami
5 (2)
MetaForecast prédit et visualise l'avenir de n'importe quel marché en se basant sur les harmoniques des données de prix. Bien que le marché ne soit pas toujours prévisible, s'il y a un motif dans les prix, MetaForecast peut prédire l'avenir aussi précisément que possible. Comparé à d'autres produits similaires, MetaForecast peut générer des résultats plus précis en analysant les tendances du marché. Paramètres d'entrée Past size (Taille passée) Spécifie le nombre de barres que MetaForecast uti
Market Overview MT5
Mehran Sepah Mansoor
Optimisez vos décisions de trading avec notre indicateur de force et de sentiment du marché et ne tradez plus à contre-courant! Méticuleusement conçu pour les traders sérieux qui apprécient les informations précises et opportunes, notre indicateur fournit une vue d'ensemble des 28 paires principales d'une manière très simple. Cet outil est capable de classer les paires de devises en fonction de leur popularité, de la force de la tendance haussière ou baissière et du pourcentage d'acheteurs et
Plus de l'auteur
SwingVolumePro
Thalles Nascimento De Carvalho
Vue d'ensemble SwingVolumePro est un indicateur avancé et polyvalent, conçu pour être utilisé sur une large gamme d'actifs financiers et pour supporter différents styles de trading. Basé sur une analyse rigoureuse du volume et du prix, il fournit des signaux clairs et précis permettant aux traders de tous niveaux de prendre des décisions éclairées basées sur des données de haute qualité. SwingVolumePro.PDF Principales caractéristiques Polyvalence: SwingVolumePro peut être appliqué à
Box Weis Wave
Thalles Nascimento De Carvalho
5 (1)
Élevez votre analyse avec le Weis Wave Box ! Si vous recherchez précision et clarté dans vos négociations, le Weis Wave Box est l'outil qu'il vous faut. Cet indicateur avancé offre une analyse visuelle détaillée des vagues de volume et des points de swing, vous aidant à mieux comprendre la relation entre effort et résultats sur le marché. Principales caractéristiques du Weis Wave Box : Vagues de Volume Personnalisables : Ajustez les vagues de volume en ticks pour les adapter à vos straté
AI Channel
Thalles Nascimento De Carvalho
4 (4)
Welcome to the presentation of the AI Channel indicator, a powerful tool that uses artificial intelligence for price channel analysis in the financial market. In this session, we will explore how this revolutionary indicator can assist investors and traders in making more informed and strategic decisions. Let's get started! I. What is the AI Channel indicator? AI Channel is an indicator developed based on advanced artificial intelligence algorithms. It utilizes historical price data of financial
FREE
Cumulative Volume Bands
Thalles Nascimento De Carvalho
CVB Cumulative Volume Bands : Optimisez vos opérations avec le volume cumulé ! CVB Cumulative Volume Bands est un indicateur avancé conçu pour les traders qui recherchent des signaux précis basés sur le volume cumulé. En utilisant des bandes de volume cumulé, cet indicateur fournit des lectures claires des pressions d'achat et de vente sur le marché, aidant ainsi à identifier les retournements et les mouvements de prix importants. Cumulative Volume Bands for MT5 ! Caractéristiqu
FREE
Swing Point Volume
Thalles Nascimento De Carvalho
Swing Point Volume, the indicator that signals weakness and strength at the tops and bottoms. This indicador can be for used the Wyckoff Method. Information provided; - Swing on customized ticks. - Volume and points in each balance sheet. - Percentage of Displacement. - Sound alert option on top and bottom breaks. - Volume in ticks and Real Volume. - Volume HL (extreme) or (opening and closing) - Customized volume shapes.
Atr Projection
Thalles Nascimento De Carvalho
L'indicateur ATR Projeção se distingue comme un outil robuste dans l'analyse technique, conçu pour fournir des informations précises sur les limites potentielles des mouvements de prix sur les marchés financiers. Son approche flexible permet aux utilisateurs de personnaliser de manière intuitive les métriques d'analyse, en s'adaptant aux besoins spécifiques de chaque actif négocié. Fonctionnement personnalisable : Par défaut, l'ATR Projeção fonctionne en considérant 30 % de la moyenne des
Didi Index Volume
Thalles Nascimento De Carvalho
Nous vous présentons le Didi Index Volume, un indicateur d'analyse technique développé par le trader brésilien Odir Aguiar, qui se distingue par son approche avancée et puissante dans l'identification des opportunités sur les marchés financiers. Disponible sur différentes plateformes, le Didi Index Volume est devenu un outil essentiel pour les traders à la recherche d'informations précises et précieuses pour leurs stratégies de trading. Cet indicateur combine le célèbre Didi Index, créé par O
Smart Binary Volume
Thalles Nascimento De Carvalho
L'indicateur Smart Binary Volume est un outil polyvalent qui combine l'analyse du volume de trading avec l'apprentissage automatique. Il peut être appliqué sur différents marchés et stratégies, y compris le scalping et d'autres types de transactions à court terme. En utilisant des algorithmes d'apprentissage automatique avancés, l'indicateur identifie des schémas complexes, générant ainsi des signaux d'achat et de vente plus précis. Buffer to Create EA. Buffer Line Gold = 0. Buffer Line Red =
TimeChannel
Thalles Nascimento De Carvalho
The "Timechannel" is a powerful technical analysis tool designed specifically for traders who want to gain deeper and more accurate insights into price movements across multiple timeframes (multi-timeframe). This indicator is an essential addition to the toolbox of any serious trader seeking to make informed and data-driven trading decisions. Key Features: Advanced Multi-Timeframe Analysis : Timechannel allows traders to analyze price movements on different timeframes simultaneously. This is cr
Big Player Range
Thalles Nascimento De Carvalho
5 (2)
Découvrez la Puissance de "BigPlayerRange" : Votre Allié dans l'Analyse Technique du Marché Nous vous présentons BigPlayerRange , un outil avancé d'analyse technique conçu pour révéler les zones d'intérêt des investisseurs institutionnels sur le marché. Grâce à cet outil, vous pouvez identifier précisément où les principaux acteurs sont activement impliqués et comprendre comment cela peut influencer vos stratégies de trading. Principales Caractéristiques : Cartographie des Zones d'Intérêt I
Master OBV
Thalles Nascimento De Carvalho
MasterOBV : Maîtrisez les Tendances du Marché avec Précision ! MasterOBV est un indicateur d'analyse technique qui combine volume , correlation positive et une Moyenne Mobile (MA) pour affiner l'identification des tendances sur les marchés financiers. Fonctionnalités Principales : Volume Intelligent : Analyse le volume des transactions pour identifier les changements significatifs dans la force de la tendance. Correlation Positive : Intègre des actifs corrélés pour obtenir une vue pl
Smart Delta Volume
Thalles Nascimento De Carvalho
Smart Delta Volume : Précis et Adaptable aux Conditions de Marché Dynamiques Smart Delta Volume est un indicateur technique avancé conçu pour offrir une analyse précise et adaptable dans un environnement de marché en constante évolution. En utilisant des niveaux dynamiques qui s'ajustent automatiquement en fonction de la volatilité, cet indicateur fournit une vue plus complète et fiable de l'interaction entre le flux de volume et l'action des prix. Cette capacité d'adaptation est cruciale pou
VolaMetrics VSA
Thalles Nascimento De Carvalho
VolaMetrics VSA | Un Puissant Allié dans l'Analyse Technique Le VolaMetrics VSA est un indicateur d'analyse technique qui combine la méthode Volume Spread Analysis (VSA) avec une analyse détaillée du volume des transactions . Conçu pour identifier et suivre les mouvements significatifs des prix , le VolaMetrics VSA utilise l'interaction entre volume et écart de prix pour fournir des insights précieux qui peuvent aider à prendre des décisions de trading. Les Fondements de la Volume Spread Anal
CVD SmoothFlow Pro
Thalles Nascimento De Carvalho
CVD SmoothFlow Pro - Analyse de Volume Illimitée pour Tout Actif ! CVD SmoothFlow Pro est la solution ultime pour les traders recherchant une analyse de volume précise et illimitée. En utilisant le calcul du Cumulative Volume Delta (CVD) avec un filtrage avancé du bruit, la version Pro offre la flexibilité et la précision nécessaires pour trader tout actif financier. Que propose CVD SmoothFlow Pro ? Analyse Claire : Filtre le bruit du marché et met en avant les mouvements de volume signifi
VolumeSecret
Thalles Nascimento De Carvalho
VolumeSecret : Le Pouvoir du Volume entre Vos Mains Dans le monde complexe de la programmation, nous faisons constamment face à des obstacles qui nous poussent à grandir et à évoluer. Nous comprenons profondément les difficultés que le marché impose et comment les traders luttent pour atteindre une performance optimale. C’est pourquoi nous travaillons sans relâche sur des solutions innovantes pour rendre la prise de décision sur le marché plus fluide et précise. VolumeSecret est le fruit de cet
Imbalance DOM Pro
Thalles Nascimento De Carvalho
Imbalance DOM Pro : Optimisez vos opérations avec le déséquilibre du carnet d'ordres Opportunités avec les petits mouvements de prix Imbalance DOM Pro est un outil essentiel pour les analystes qui traitent avec le flux des ordres . Idéal pour les scalpers , il a été conçu pour ceux qui souhaitent tirer parti des petites oscillations de prix avec une grande précision. Grâce à un calcul avancé, l'indicateur identifie les déséquilibres dans le carnet d'ordres , fournissant des signaux pré
Cumulative Vol Bands
Thalles Nascimento De Carvalho
CVB Cumulative Volume Bands : Optimisez vos opérations avec le volume cumulé ! CVB Cumulative Volume Bands est un indicateur avancé conçu pour les traders qui recherchent des signaux précis basés sur le volume cumulé. En utilisant des bandes de volume cumulé, cet indicateur fournit des lectures claires des pressions d'achat et de vente sur le marché, aidant ainsi à identifier les retournements et les mouvements de prix importants. Caractéristiques principales : Analyse du volume c
ZigWave Oscillator
Thalles Nascimento De Carvalho
ZigWave Oscillator : Optimisez vos transactions avec des oscillateurs et ZigZag ! Le ZigWave Oscillator est l'outil parfait pour les traders recherchant précision et clarté dans l'analyse du marché financier. Cet indicateur combine la puissance des oscillateurs avec la simplicité visuelle du ZigZag, vous aidant à identifier rapidement et efficacement les meilleures opportunités d'achat et de vente. Pourquoi choisir le ZigWave Oscillator ? Analyse précise des oscillateurs : Intégrez RS
Filtrer:
Aucun avis
Répondre à l'avis