Sansa MovingAvarage Cross MM
- Indicateurs
- Maria Erica Costagliola
- Version: 1.0
- Activations: 5
Sansa MovingAvarage Cross MM
Description in English and Italian =
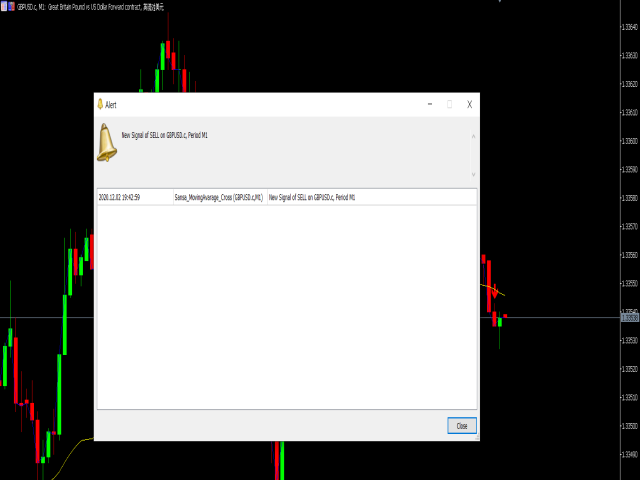
This Indicator is based on the cross of two Moving Avarage, and gives you the signal of Buy and Sell when they Cross, with Arrows and Alerts.
What’s the best about it? You can set up the two Moving Avarage just as you need!
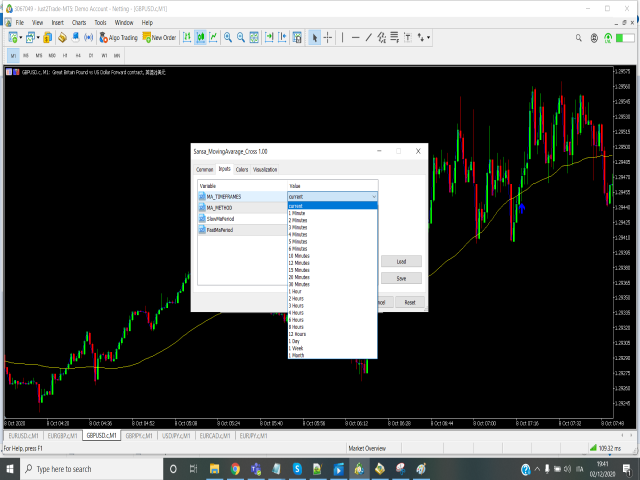
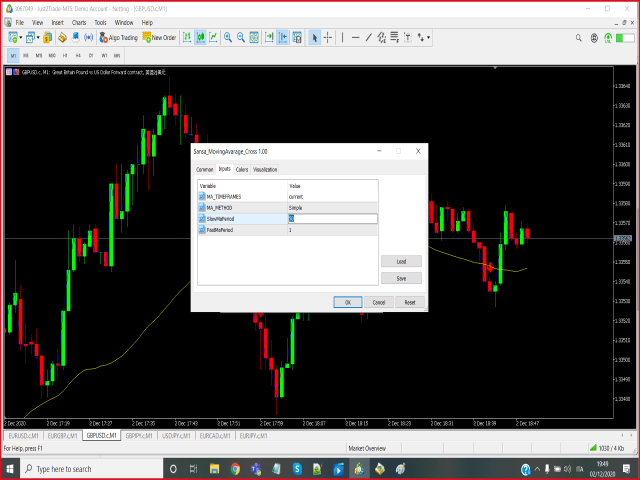
When you attach the indicator on the chart , a window will open where , in the INPUT section, you can choose the MATimeFrame(H1,H4,M30 ....), the MaMethod ( Simple, Exponential.....),SlowMa Periods( 50 as Default but you can manually change the number ), FastMa Periods(1 as Default but you can manually chande the number).
SIGNAL INPUT =
· BUY = when FastMa cross above the SlowMa on a well defined Trend, the indicator will draw a Blue Arrow and the Alert will have the Symbol and the Signal Exaple= “BuyEURUSD”;
· SELL = when FastMa cross below the SlowMa on a well defined Trend, the indicator will draw a Red Arrow and the Alert will have the Symbol and the Signal Example= “SellEURUSD”;
You can receive push notification of your signal on your mobile device with the MetaTrader5 App.
To turn this feature on follow this steps:
· Download MetaTrader5 App from the store
· Go on the Tool section of your MetaTrader5 Platform on your PC and click on Options(CTRL+O)
· Go on the Notifications tab and click on "Enable Push Notifications"
· Put your MetaQuotesID on the section( you will find the MetaQuotesID on your MetaTrader5 App)
· Click on OK button and wait your notification on the next signal
INSTALLATION =
Simply attach this indicator to the chart window of currency pairs, a window will open , in the INPUT SECTION you will find all the variable of the MA that you can change;
Double click to the MATimeFrame, MaMethod, SlowMaPeriods, FastMaPeriods, to change the default setting with the value you need.
***************************************************************************************************************************************************************************************
Questo indicatore è basato sull’incrocio di due Moving Avarage, e da il segnale di Buy e Sell quando si incrociano con delle frecce e degli Allarmi.
Qual è la cosa migliore di questo indicatore? Puoi impostare le due Moving Avarage proprio coma hai bisogno!
Quando attaccherai l’indicatore al grafico, si aprirà una finestra dove, nella sezione VALORI DI INPUT, puoi scegliere MaTimeframe(H1,H4,M30….), MaMethod(Simple, Exponential….) il periodo della SlowMa(50 di default ma lo puoi cambiare manualmente), il periodo della FastMa(1 di default ma lo puoi cambiare manualmente).
SIGNAL INPUT =
· BUY = quando la FastMa incrocia dal basso verso l’alto con la SlowMa su un Trend ben definito, l’indicatore disegnerà una freccia Blu e si aprirà un Allarme con il Simbolo e il Segnale Esempio=”BuyEURUSD”;
· SELL = quando la FastMa incrocia dall’alto verso il basso con la SlowMa su un Trend ben definito, l’indicatore disegnerà una freccia Ross e si aprirà un Allarme con il Simbolo e il Segnale Esempio=”SellEURUSD”;
Puoi ricevere le notifiche del segnale direttamente sulla tua App MetaTrader5.
Per ottenere il servizio basta seguire questi semplici passaggi:
· Installa l'App MetaTrader5 dallo store
· Vai nella sezione Tool sulla piattaforma MetaTrader5 del tuo PC e clicca su Options(CTRL+O)
· Vai nel tab Notifications e clicca su "Enable Push Notifications"
· Inserisci il tuo MetaQuotesID nel box MetaQuotesID (troverai il tuo MetaQuotesID nell'App MetaTrader5 del tuo cellulare)
· Clicca su OK e attendi la notifica sul tuo cellulare al prossimo segnale dell'indicatore
INSTALLATION =
Attaccare semplicemente l’indicatore al grafico, si aprirà una finestra, nella sezione VALORI DI INPUT, troverai tutte le variabili degli Ma che puoi cambiare;
Fai doppio click su MaTimeFrame, MaMethod,SlowMaPeriods, FastMaPeriods, per cambiare i valori di default con i valori che preferisci.