Market Reversal Alerts MT5
- Indicateurs
- LEE SAMSON
- Version: 5.0
- Mise à jour: 5 août 2021
- Activations: 10
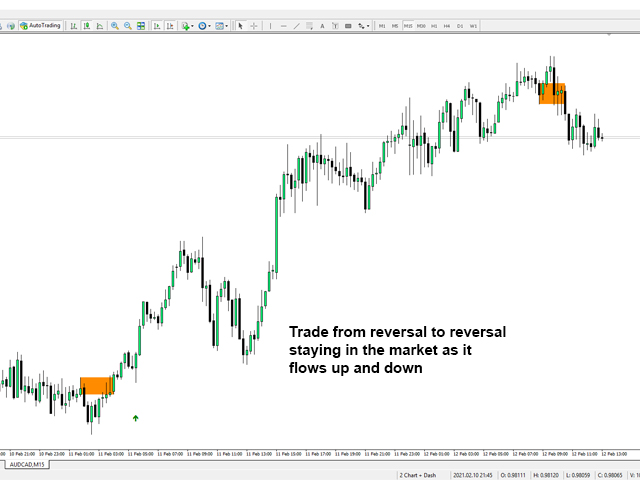
Le profit de la structure du marché change à mesure que le prix s'inverse et recule.
L'indicateur d'alerte d'inversion de la structure du marché identifie le moment où une tendance ou un mouvement de prix approche de l'épuisement et est prêt à s'inverser. Il vous avertit des changements dans la structure du marché qui se produisent généralement lorsqu'un renversement ou un recul majeur est sur le point de se produire.
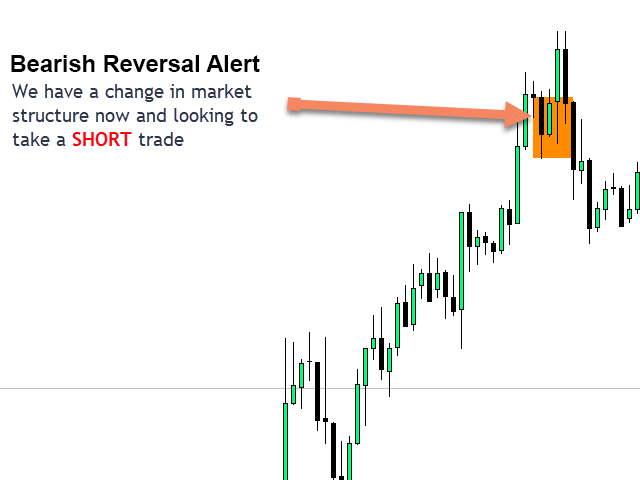
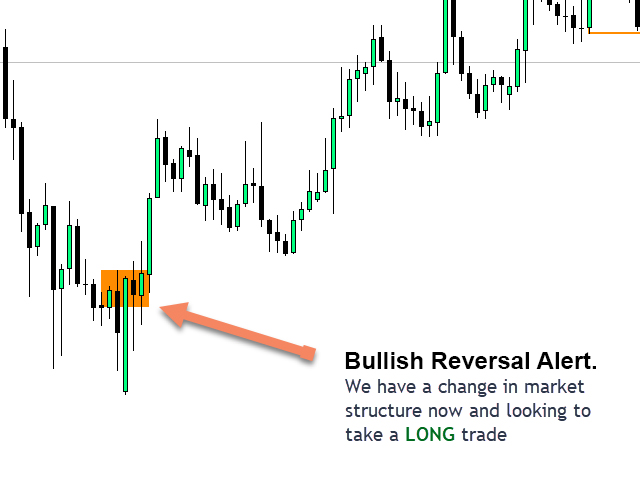
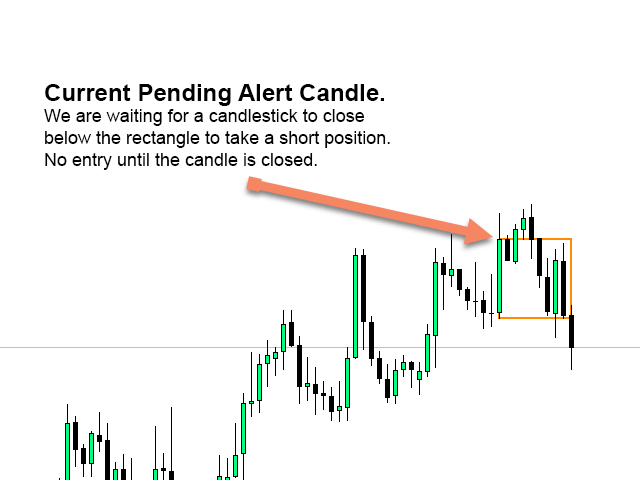
L'indicateur identifie initialement les cassures et la dynamique des prix, chaque fois qu'un nouveau haut ou bas se forme près d'un point d'épuisement possible. L'indicateur dessine un rectangle sur la dernière bougie de couleur opposée. Il suivra ensuite le rectangle avec le prix alors qu'il continue d'évoluer dans sa tendance actuelle à court terme. Une fois que le prix s'affaiblit suffisamment pour se refermer au-dessus ou en dessous du rectangle, cela indiquerait qu'un changement potentiel dans la structure du marché est en cours. L'indicateur vous alerte alors d'un éventuel changement de direction et du début d'un possible renversement de tendance ou d'un recul important.
Voir l'indicateur en action ci-dessous pour voir comment cela fonctionne !
Tableau de bord pour surveiller toutes les paires et les principaux délais disponibles ici : https://www.mql5.com/en/market/product/65828
Version MT4 disponible ici : https://www.mql5.com/en/market/product/46295/
Caractéristiques
Vous avertit des changements potentiels dans la structure du marché aux points d'épuisement clés
Dessine automatiquement dans la structure du marché à court terme lorsque le prix approche des niveaux d'épuisement
Suit les rectangles d'alerte derrière le prix lorsqu'il se déplace dans sa direction de tendance actuelle pour trouver les entrées les plus serrées
Change la couleur en un rectangle de bloc plein sur les alertes pour montrer où les inversions potentielles de la structure du marché se sont produites
Fonctionne sur tous les symboles et délais
Alertes pop-up, push et e-mail intégrées
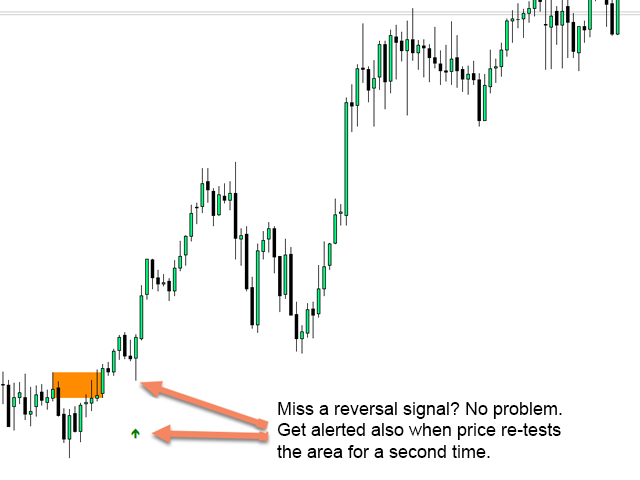
Alertes lorsqu'un nouveau test d'une alerte d'inversion s'est produit confirmant que l'entrée est plus probable
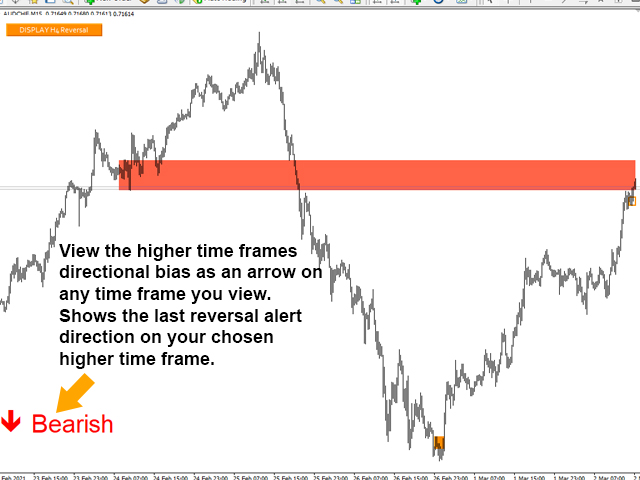
Vous permet d'afficher des rectangles d'inversion de période plus élevée sur votre période de négociation inférieure. Idéal pour les traders de tendance et pour identifier la direction de la tendance à plus long terme
Sélectionnez toutes les alertes d'inversion ou uniquement les alertes longues ou courtes, sélectionnez les alertes directionnelles souhaitées en fonction de la direction de la tendance actuelle de chaque paire
Affichez la flèche de biais directionnel de la période supérieure sur votre graphique de la période inférieure.
Stratégie et comment négocier avec l'indicateur d'inversion de la structure du marché
Lorsqu'une alerte d'inversion se produit :
Regarde à gauche! Y a-t-il un niveau d'offre/demande ou de support/résistance vers lequel nous nous tournons. Les changements de structure du marché (renversements) se produisent généralement lorsque le prix teste à nouveau un ancien niveau ou qu'une chasse au stop vient de se produire au-dessus de ce niveau de support ou de résistance.
Consultez une période plus longue pour voir s'il y a une zone de support/résistance vers laquelle nous nous tournons. Comme ci-dessus, les changements dans la structure du marché se produiront souvent sur des périodes plus courtes lorsqu'ils sont à des niveaux majeurs sur une période plus longue.
Si les conditions ci-dessus sont remplies, placez simplement une transaction dans le sens de l'inversion.
Vous pouvez ajouter des indicateurs supplémentaires comme validation ou utiliser cet indicateur pour ajouter une validation supplémentaire à vos indicateurs ou stratégie existants !
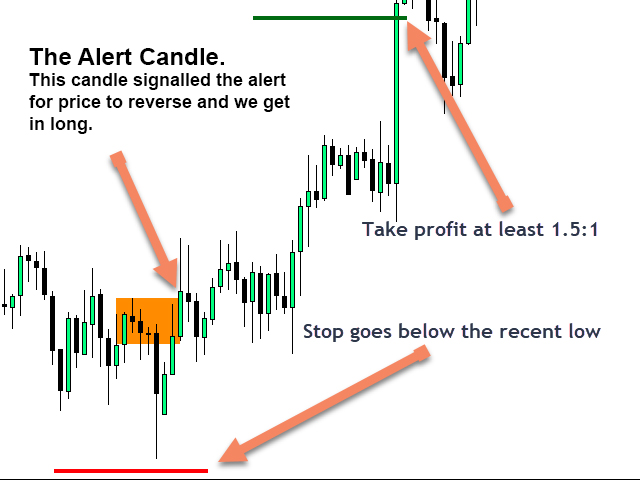
Stop Loss et Take Profit
Votre stop doit toujours aller juste au-dessus du plus haut le plus récent ou en dessous du plus bas le plus récent. Si l'inversion identifie correctement un changement dans la structure du marché, le prix reviendra rarement au-dessus/en dessous du pic le plus récent. La taille de votre stop dépendra de l'agressivité du dernier mouvement pour créer le récent sommet.


If you need a holy grail trading strategy then combine this indicator with a volume profile and trade according to the reversal signal and use the volume profile shapes or patterns as confirmation. Thank me later (;)