• Aperçu
  • Avis (32)
  • Commentaires (709)
  • Nouveautés

MonsterDash Harmonic Indicator

4.5

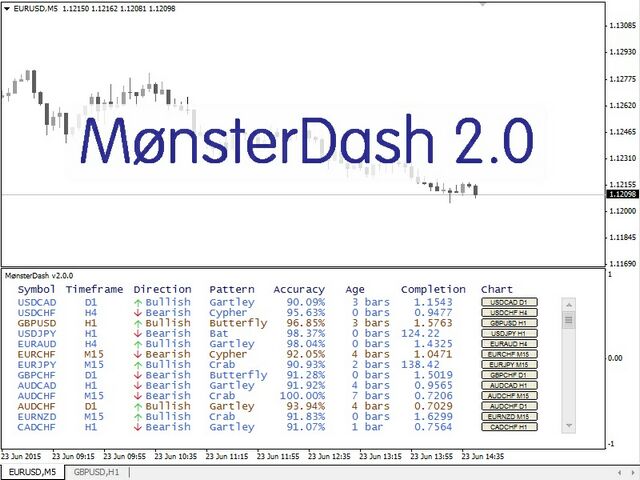
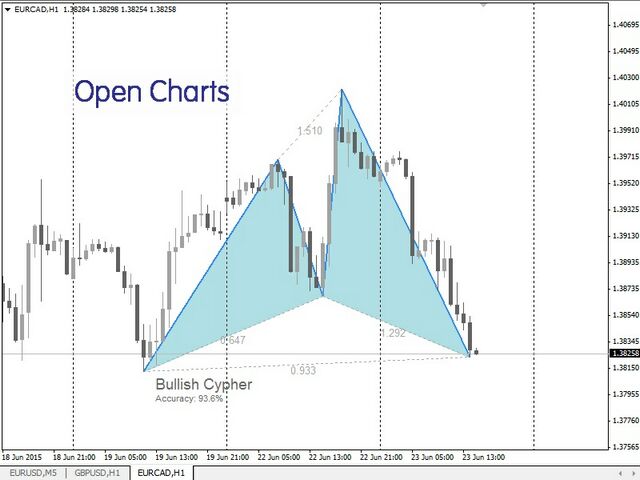
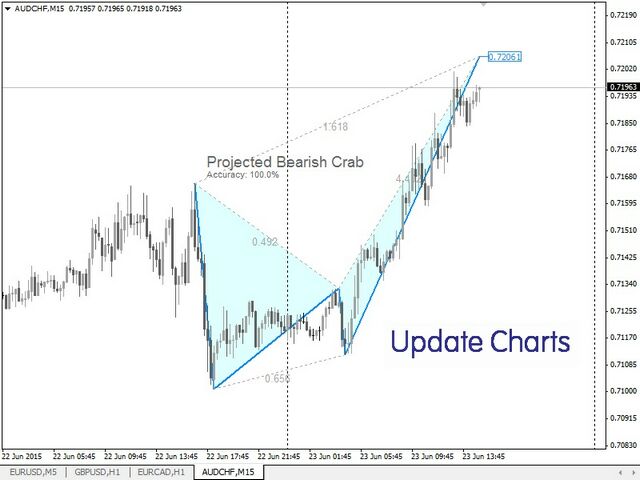
MonsterDash Harmonic Indicator is a harmonic pattern dashboard. It recognizes all major patterns. MonsterDash is a dashboard that displays all detected patterns for all symbols and (almost) all timeframes in sortable and scrollable format. Users can add their own user defined patterns. MonsterDash can open and update charts with the pattern found.


Settings

MonsterDash's default settings are good enough most of the time. Feel free to fine tune them to your needs. The color settings are for those who 'gone to the dark side' (black backgrounds), they are less suitable for white backgrounds.

  • Check pattern every - Set to the frequency to detect and refresh the patterns. This is independent of the chart timeframe.
  • Symbols to exclude - This is a comma delimited list of symbols to exclude from pattern recognition. MonsterDash looks at all symbols in the Market Watch window.
  • Minimum AccuracyPercent - Minimum accuracy percentage for pattern recognition.
  • Price Must Touch All Minimum Ratios - Set to true to force MonsterDash to touch all minimum ratios, set this if you want the price to touch all minimum ratios and provide even better patterns.
  • Show Pattern Projections - Show/hide projected patterns.
  • Check M1, M5, M15, M30, H1, H4, D1, W1, MN1 - Set to true to include the timeframe in the harmonic pattern recognition.
  • Offline timeframes, comma separated - Set to a comma separated list of all offline timeframes (e.g. 2,3). Useful for Renko of Median charts
  • Show Command Column - Set to true to show an column with a button to open a chart.
  • Chart Template - Set to the name of the template (include '.tpl') to apply to the chart to open.
  • Show Alerts - Set to false to disable all alerts.
  • Show Screen Alerts - Set to true to show screen alerts.
  • Email Alerts - Set to true to email alerts.
  • Push Alert Notifications - Set to true to push alerts.
  • Show 'PatternName' Patterns - Show/hide specific pattern.
  • Sort Patterns By - Column to sort the information grid to (one of: NoSort, Pattern, Symbol, Timeframe, Direction, Accuracy, Age, Completion, IsProjected).
  • Sort Direction - Ascending of Descending.
  • monospacedFont - Pick your favorite font, monospaced is best.
  • fontSize - Font size.
  • Show Pattern Label - Set to true to show the pattern name on opened charts.
  • Show Pattern Accuracy - Set to true to show the pattern accuracy label on opened charts.
  • Show Initialization User Patterns? - set to true to show the results of the intialization of the user patterns in the Experts tab.
  • Color Palette - Pick Color Palette for 'Dark' or 'Light' Backgrounds.
  • Colo(u)rs - You know what to do.
  • Zigzag parameters - set ZigZag parameters.


User Patterns

Users can add their own patterns to MonsterDash. Just modify the Monster_UserPatterns.csv to include your patterns. The .csv file can be found in the files folder of the User Data Directory. A sample pattern is already included in the file.


Offline Charts

MonsterDash will read and detect offline charts. Renko or Median charts among others can be used this way. However, offline charts cannot be automatically opened through MonsterDash to show the pattern found, this is a limitation of MetaTrader 4.


Sorting, Scrolling, Opening Charts

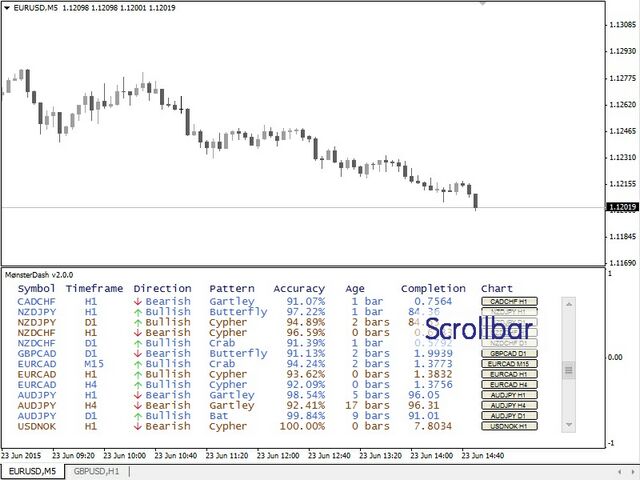
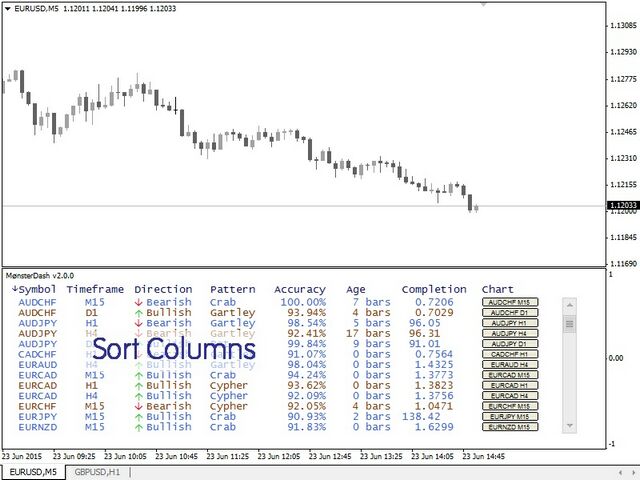
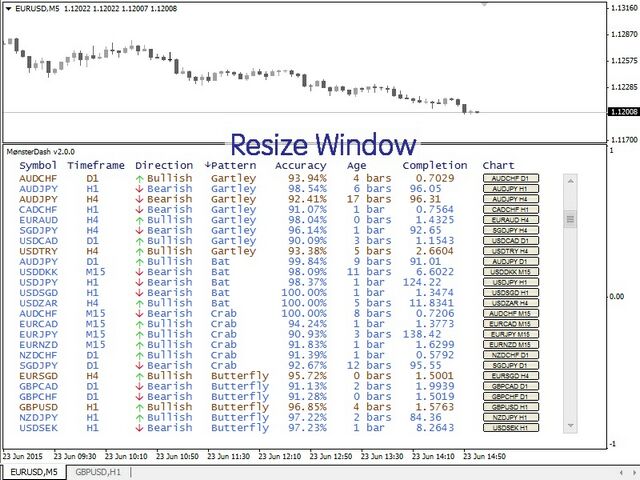
The patterns can be sorted on all columns. Click the column headers to sort the grid to the information in the column, click again to reverse the sort. The grid containing all patterns can be scrolled using a standard scrollbar. Clicking the button in the last column of the grid will open or update a chart containing the pattern found.


Full Description

Read this blog post for more information on MonsterDash.

Avis 20
Suvashish Halder
21341
Suvashish Halder 2021.10.21 12:37 
 

It works and I become a fan of Harmonic Patterns 😍 Very good indicator. Thank you, Paul 🙂

Gursimran Singh Bharaj
114
Gursimran Singh Bharaj 2018.06.22 11:43 
 

I have rented this indicator. I had already bought the monster harmonic indicator a long time back. I missed a dashboard where multiple patterns are detected on a time frame. this does the job well. I am giving it 5 stars for the way it performs.

don't expect that if a pattern forms you just open a trade. you have to take other factors into account.

reo4ua
157
reo4ua 2018.03.29 22:43 
 

Paul,

What a fantastic time saver you have here. Honestly - one could trade using only your indicator and key levels and make all the money they want. Thank you for sharing this with us. Two requests if you would consider them for the next version: the ability to remove a signal from the list to keep it as clutter free as possible (for instance if you wake up to patterns where the optimal trade entry level has already come and gone - no sense in seeing it anymore) and a free-form notes column to the right of the "chart" button. Since I trade mainly with weekly pivots, noting point "d"'s proximity to the closest weekly fib pivot would be nice too.

Thanks again for what you do for the MT community!

Produits recommandés
Introduction to X3 Chart Pattern Scanner X3 Cherart Pattern Scanner is the non-repainting and non-lagging indicator detecting X3 chart patterns including Harmonic pattern, Elliott Wave pattern, X3 patterns, and Japanese Candlestick patterns. Historical patterns match with signal patterns. Hence, you can readily develop the solid trading strategy in your chart. More importantly, this superb pattern scanner can detect the optimal pattern of its kind. In addition, you can switch on and off individu
Elliott Wave Trend was designed for the scientific wave counting. This tool focuses to get rid of the vagueness of the classic Elliott Wave Counting using the guideline from the template and pattern approach. In doing so, firstly Elliott Wave Trend offers the template for your wave counting. Secondly, it offers Wave Structural Score to assist to identify accurate wave formation. It offers both impulse wave Structural Score and corrective wave Structure Score. Structural Score is the rating to sh
Day Pattern
Oleksandr Martsynyshen
Description: - D ay Pattern - an indicator that helps to identify patterns of price changes for the development of trading algorithms and strategies. For whom this tool? - For developers of trading strategies and algorithms. - Medium- and long-term traders. Time frames H1-W1. Features of the indicator: - There is a function of exporting indicator values to a file of the csv format. - Using the information panel, you can conduct an express analysis of trading tool. - The indicat
The indicator detects and displays М. Gartley's Butterfly pattern. The pattern is plotted by the extreme values of the ZigZag indicator (included in the resources, no need to install). After detecting the pattern, the indicator notifies of that by the pop-up window, a mobile notification and an email. The pattern and wave parameters are displayed on the screenshots. The default parameters are used for demonstration purposes only in order to increase the amount of detected patterns. Parameters
ZigZag Professional
Dmitriy Kashevich
5 (1)
the zigzag indicator draws lines on the chart from the highest point to the lowest There are built-in fibonacci levels built-in sound alert the indicator highlights trends on small timeframes with a thin line and trends highlights with a coarse line Fibonacci levels can be turned on and off in the settings settings are very simple and clear the same sound alert can be turned on and off, you can change the colors of the lines.
EA Black Box
Vitali Vasilenka
EA Black Box Expert Advisor est déjà en avance sur son temps ! - un algorithme de trading qui inclut les modèles harmoniques clés A des modèles harmoniques : Modèle haussier_5-0_ Baissier_5-0_Pattern Baissier_Three_Drives Bullish_Three_Drives Chaîne Telegram de notre communauté - https://t.me/EAQuantumLab Site communautaire officiel - https://eaquantumlab.com Les vrais signaux sont disponibles ici : https://www.mql5.com/en/users/vitalvasa/seller Dépôt minimum pour trader 1000$ Utilisez
The indicator detects and displays 3 Drives harmonic pattern (see the screenshot). The pattern is plotted by the extreme values of the ZigZag indicator (included in the resources, no need to install). After detecting the pattern, the indicator notifies of that by a pop-up window, a mobile notification and an email. The indicator highlights the process of the pattern formation and not just the complete pattern. In the former case, it is displayed in the contour triangles. After the pattern is com
The indicator detects and displays Shark harmonic pattern (see the screenshot). The pattern is plotted by the extreme values of the ZigZag indicator (included in the resources, no need to install). After detecting the pattern, the indicator notifies of that by a pop-up window, a mobile notification and an email. The indicator highlights the process of the pattern formation and not just the complete pattern. In the former case, it is displayed in the contour triangles. After the pattern is comple
Gartley Projection D
Oleksandr Medviediev
3.71 (7)
The indicator identifies the harmonic patterns (XABCD) according to developments of H.M.Gartley ( "Profits in the Stock Market" , 1935г). It projects D-point as a point in the perspective projection (specify ProjectionD_Mode = true in the settings). Does not redraw. When a bar of the working timeframe closes, if the identified pattern point has not moved during Patterns_Fractal_Bars bars, an arrow appears on the chart (in the direction of the expected price movement). From this moment on, the ar
The indicator is designed to work on any trading platform. The program is based on proprietary algorithms and W.D.Ganna's mathematics, allowing you to calculate target levels of price movement based on three points with the highest degree of certainty. It is a great tool for stock trading. The indicator has three buttons: NEW - call up a triangle for calculation. DEL - delete the selected triangle. DELS - completely remove all constructions. The probability of achieving the goals is more than 80
PZ 123 Pattern
PZ TRADING SLU
3.75 (4)
The 123 Pattern is one of the most popular, powerful and flexible chart patterns. The pattern is made up of three price points: a bottom, a peak or valley, and a Fibonacci retracement between 38.2% and 71.8%. A pattern is considered valid when the price breaks beyond the last peak or valley, moment at which the indicator plots an arrow, rises an alert, and the trade can be placed. [ Installation Guide | Update Guide | Troubleshooting | FAQ | All Products ] Clear trading signals Customizable c
Introduction to Harmonic Volatility Indicator Harmonic Volatility Indicator is the first technical analysis applying the Fibonacci analysis to the financial volatility. Harmonic volatility indicator is another level of price action trading tool, which combines robust Fibonacci ratios (0.618, 0.382, etc.) with volatility. Originally, Harmonic Volatility Indicator was developed to overcome the limitation and the weakness of Gann’s Angle, also known as Gann’s Fan. We have demonstrated that Harmonic
The CCI Divergence is a reasonably useful indicator in itself, but it is even more effective when used with divergence pattern trading. The CCI Divergence indicator signal is one of the most potent signals among the indicators that exist in the market. Here is new version for Divergence Indicator using CCI method, with more improvements. Divergences indicate a potential investment point because the directional moment does not confirm the price. A bullish divergence occurs when the underlying
Wave Reversal Indicator - determines the direction of trend waves and price reversals. The indicator shows wave movements and trend directions. It gives recommendations where to follow the trader, helps to follow the trading strategy. It is an addition to an intraday or medium-term strategy. Almost all parameters are selected for each time frame and are changed automatically, the only parameter for manual adjustment is the wavelength. Works on various trading instruments and timeframes, rec
FREE
Trend Ray
Andriy Sydoruk
The indicator shows the potential trend direction by cyclical-wave dependence. Thus, all the rays of the intersection will be optimal rays, in the direction of which the price is expected to move, taking into account the indicator period. Rays can be used as a direction for potential market movement. But we must not forget that the approach must be comprehensive, the indicator signals require additional information to enter the market.
Gold Phoenix
Yaroslav Varankin
The perfect tool for Scalng in the Forex markets You can trade both from signal to signal and using take profit  The algorithm does not use Zigzag!  No redrawing!  This is a channel instrument that uses a moving average as a filter. Moving Average  There are 2 parameters for the settings Ma Period = 5 period Moving Average  Channel 1.0 distance of channel lines from the chart Price Signal Filter - calculation of signal opening and filter There is a complete set of Alert There is a multi-timefram
VR Cub
Vladimir Pastushak
VR Cub est un indicateur permettant d'obtenir des points d'entrée de haute qualité. L'indicateur a été développé pour faciliter les calculs mathématiques et simplifier la recherche de points d'entrée dans un poste. La stratégie de trading pour laquelle l'indicateur a été rédigé prouve son efficacité depuis de nombreuses années. La simplicité de la stratégie de trading est son grand avantage, qui permet même aux traders débutants de négocier avec succès avec elle. VR Cub calcule les points d'ouve
1. Going offline means that the market is in a wait-and-see state. In this situation, it is common to choose to wait and see rather than taking immediate action to wait for more market information or trend confirmation in order to make wiser decisions. 2.When there is a trend of going up and down, the market shows a bullish signal. At this point, investors may consider entering the market in hopes of future price increases and profits. 3.When the market situation is online, it will once again t
Reversal Prices is an indicator that has a fairly powerful and effective mechanism for adapting to changing market conditions. Reversal Prices - the new word in trend detection! With the development of information technology and a large number of participants, financial markets are less and less amenable to analysis by outdated indicators. Conventional technical analysis tools, such as the Moving Average or Stochastic, in their pure form are not able to determine the direction of the trend or it
L'indicateur construit un éventail de lignes de tendance (après avoir cliqué sur une certaine bougie), similaire aux angles de Gann classiques. La particularité de l'indicateur est qu'il construit des angles non seulement sur une échelle fixe, mais utilise également le prix moyen d'un certain nombre de barres (facultatif). Il existe deux façons de calculer le prix moyen des cornières dans l'indicateur (facultatif) : 1) calcul du mouvement de prix moyen (pour un certain nombre de barres) du
Очень точный индикатор, с  его помощью очень легко определять барные паттерны. Это очередная разновидность ЗигЗага, за исключением, он не рисует текущую линию, которая может перерисоваться,если нарисовал конечную точку, по закрытому бару, то больше ее не изменяет - это означает смену направления и следующая точка будет другого цвета. Может быть применен как для определения основного движения, при использовании увеличенных параметров, так и непосредственно для входа с минимальным риском. Очень
Trend PA
Mikhail Nazarenko
5 (3)
The Trend PA indicator uses   Price Action   and its own filtering algorithm to determine the trend. This approach helps to accurately determine entry points and the current trend on any timeframe. The indicator uses its own algorithm for analyzing price changes and Price Action. Which gives you the advantage of recognizing, without delay, a new nascent trend with fewer false positives. Trend filtering conditions can be selected in the settings individually for your trading style. The indicator
Gioteen Volatility Index (GVI)   - your ultimate solution to overcoming market unpredictability and maximizing trading opportunities. This revolutionary indicator helps you in lowering your losing trades due to choppy market movements. The GVI is designed to measure market volatility, providing you with valuable insights to identify the most favorable trading prospects. Its intuitive interface consists of a dynamic red line representing the volatility index, accompanied by blue line that indicat
Extremum Reverse Bar
Yurij Izyumov
3.55 (11)
This indicator has been created for finding the probable reversal points of the symbol price. A small candlestick reversal pattern is used it its operation in conjunction with a filter of extremums. The indicator is not redrawn! If the extremum filter is disabled, the indicator shows all points that have a pattern. If the extremum filter is enabled, the condition works – if the history Previous bars 1 candles back contains higher candles and they are farther than the Previous bars 2 candle, such
FREE
AndInvest Impulse
Bruno Ravardiere De Oliveira Goncalves
Em uma negociação no Mercado Financeiro nada é mais importante que saber o momento certo de entrar em uma negociação. O AndInvest Impulse auxilia traders a capturar o momento exato de abrir uma negociação, para isto ele desenha topos e fundos facilitando a leitura do Price Action e após um breve momento de realização do mercado ele identifica o retorno da ponta compradora ou vendedora de força antecipada e sem repintura. Comprovação de Resultados: https://youtu.be/CA1_ZtZY0vk Funciona em qualque
The indicator is designed to detect breakouts of the Bill Williams fractal level on the instrument chart in the MetaTrader 4. After installing the indicator on the instrument chart, when a breakdown of the Bill Williams fractal level occurs, the signal bar (candle) is marked with a colored pointer (arrow) in the direction of the breakdown. For greater clarity, you can add a standard indicator "Bill Williams Fractal" to the chart of the instrument. When adding the indicator to the instrume
The main idea of this indicator is rates analysis and prediction by Fourier transform. Indicator decomposes exchange rates into main harmonics and calculates their product in future. You may use the indicator as a standalone product, but for better prediction accuracy there is another related indicator - FreqoMaster - which uses FreqoMeterForecast as a backend engine and combines several instances of FreqoMeterForecast for different frequency bands. Parameters: iPeriod - number of bars in the ma
MACD Divergence
Sergey Deev
2.5 (2)
The indicator detects divergence signals - the divergences between the price peaks and the MACD oscillator values. The signals are displayed as arrows in the additional window and are maintained by the messages in a pop-up window, e-mails and push-notifications. The conditions which formed the signal are displayed by lines on the chart and in the indicator window. Indicator Parameters MacdFast - fast MACD line period MacdSlow - slow MACD line period MacdSignal - MACD signal line period MacdPri
The arrow indicator without redrawing shows potential entry points into the market in the form of arrows of the appropriate color: the up arrows (usually green) suggest opening a purchase, the red down arrows suggest selling. The appearance of arrows may be accompanied by beeps. It is usually assumed to enter at the next bar after the pointer, but there may be non-standard recommendations. Arrow indicators visually "unload" the price chart and save time for analysis: no signal – no deal, if ther
Nouvelle version plus précise de l'indicateur Xmaster. Plus de 200 commerçants du monde entier ont effectué plus de 15 000 tests de différentes combinaisons de cet indicateur sur leurs PC afin d'obtenir la formule la plus efficace et la plus précise. Et ici, nous vous présentons l'indicateur « Indicateur de formule Xmaster forex sans repeindre », qui affiche des signaux précis et ne repeint pas. Cet indicateur envoie également des signaux au commerçant par e-mail et push. Avec l'arrivée de chaq
Les acheteurs de ce produit ont également acheté
Actuellement 20% de réduction ! La meilleure solution pour tout débutant ou trader expert ! Ce logiciel de tableau de bord fonctionne sur 28 paires de devises. Il est basé sur 2 de nos principaux indicateurs (Advanced Currency Strength 28 et Advanced Currency Impulse). Il donne un excellent aperçu de l'ensemble du marché Forex. Il montre les valeurs de l'Advanced Currency Strength, la vitesse de mouvement des devises et les signaux pour 28 paires de devises dans tous les (9) délais. Imagine
TPSpro RFI Levels
Roman Podpora
4.86 (21)
Reversal First Impulse levels (RFI)    INSTRUCTIONS        RUS       -       ENG              R ecommended to use with an indicator   -   TPSpro  TREND PRO -  Version MT5 A key element in trading is zones or levels from which decisions to buy or sell a trading instrument are made. Despite attempts by major players to conceal their presence in the market, they inevitably leave traces. Our task was to learn how to identify these traces and interpret them correctly. Main functions: Displaying activ
AT Forex Indicator MT4
Marzena Maria Szmit
5 (2)
The AT Forex Indicator MT4 is a sophisticated trading tool designed to provide traders with a comprehensive analysis of multiple currency pairs. This   powerful indicator   simplifies the complex nature of the forex market, making it accessible for both novice and experienced traders. AT Forex Indicator uses   advanced algorithms   to detect trends, patterns and is an essential tool for traders aiming to enhance their forex trading performance. With its robust features, ease of use, and reliabl
Indicator : RealValueIndicator Description : RealValueIndicator is a powerful tool designed specifically for trading on the EURUSD pair. This indicator analyzes all EUR and USD pairs, calculates their real currency strength values, and displays them as a single realistic value to give you a head start on price. This indicator will tell you moves before they happen if you use it right. RealValueIndicator allows you to get a quick and accurate overview of the EURUSD currency pair tops and bottoms,
Atomic Analyst
Issam Kassas
5 (3)
Tout d'abord, il convient de souligner que cet indicateur de trading n'est ni repainting, ni redrawing et ne présente aucun délai, ce qui le rend idéal à la fois pour le trading manuel et automatisé. Manuel de l'utilisateur : réglages, entrées et stratégie. L'Analyste Atomique est un indicateur d'action sur les prix PA qui utilise la force et le momentum du prix pour trouver un meilleur avantage sur le marché. Équipé de filtres avancés qui aident à éliminer les bruits et les faux signaux, et à
Présentation       Quantum Trend Sniper Indicator   , l'indicateur révolutionnaire MQL5 qui transforme la façon dont vous identifiez et négociez les inversions de tendance ! Développé par une équipe de traders expérimentés avec une expérience commerciale de plus de 13 ans,       Indicateur Quantum Trend Sniper       est conçu pour propulser votre parcours de trading vers de nouveaux sommets grâce à sa manière innovante d'identifier les inversions de tendance avec une précision extrêmement élevée
TrendMaestro
Stefano Frisetti
5 (3)
note: this indicator is for METATRADER4, if you want the version for METATRADER5 this is the link:  https://www.mql5.com/it/market/product/108106 TRENDMAESTRO ver 2.4 TRENDMAESTRO recognizes a new TREND in the bud, he never makes mistakes. The certainty of identifying a new TREND is priceless. DESCRIPTION TRENDMAESTRO identifies a new TREND in the bud, this indicator examines the volatility, volumes and momentum to identify the moment in which there is an explosion of one or more of these data a
JULY OFFER 80% OFF next price for unlimited version will be 17000$. This is the only time you can get this institutional and professional indicator at this price for unlimited version. Don't dare to miss this. The tool I am about to introduce to you you can't compare it with other tools due to its strategy and accuracy level in predicting the next price directional movement . This tool is designed for serious traders who have decided to make a difference through trading. Be the next person to wi
Quantum Breakout Indicator PRO
Bogdan Ion Puscasu
4.96 (26)
Présentation       Quantum Breakout PRO   , l'indicateur révolutionnaire MQL5 qui transforme la façon dont vous négociez les zones d'évasion ! Développé par une équipe de traders expérimentés avec une expérience de trading de plus de 13 ans,   Quantum Breakout PRO   est conçu pour propulser votre parcours de trading vers de nouveaux sommets grâce à sa stratégie de zone de discussion innovante et dynamique. Quantum Breakout Indicator vous donnera des flèches de signalisation sur les zones d
Enigmera
Ivan Stefanov
5 (4)
ENIGMERA : Le cœur du marché https://www.enigmera.com Introduction Cet indicateur et ce système de trading constituent une approche remarquable des marchés financiers. ENIGMERA utilise les cycles fractals pour calculer avec précision les niveaux de support et de résistance. Il indique la phase d'accumulation authentique et donne une direction et des objectifs.  Un système qui fonctionne que nous soyons dans une tendance ou une correction.  Comment fonctionne-t-il ? ENIGMERA comprend trois l
Cycle Sniper
Elmira Memish
4.41 (37)
NEW YEAR SALE PRICE FOR LIMITED TIME!!! Please contact us after your purchase and we will send you the complimentary indicators to complete the system Cycle Sniper is not a holy grail but when you use it in a system which is explained in the videos, you will feel the difference. If you are not willing to focus on the charts designed with Cycle Sniper and other free tools we provide, we recommend not buying this indicator. We recommend watching the videos about the indiactor and system before pu
FX Volume
Daniel Stein
4.61 (36)
Obtenez votre mise à jour quotidienne du marché avec des détails et des captures d'écran via notre Morning Briefing ici sur mql5 et sur Telegram ! FX Volume est le PREMIER et SEUL indicateur de volume qui fournit un VRAI aperçu du sentiment du marché du point de vue d'un courtier. Il fournit des informations impressionnantes sur la façon dont les acteurs institutionnels du marché, comme les courtiers, sont positionnés sur le marché des changes, bien plus rapidement que les rapports COT. Voir c
GOLD Impulse with Alert
Bernhard Schweigert
4.56 (9)
Cet indicateur est une super combinaison de nos 2 produits Advanced Currency IMPULSE with ALERT  +   Currency Strength Exotics . Il fonctionne pour tous les cadres temporels et montre graphiquement l'impulsion de force ou de faiblesse pour les 8 principales devises plus un symbole ! Cet indicateur est spécialisé pour montrer l'accélération de la force des devises pour tout symbole comme l'or, les paires exotiques, les matières premières, les indices ou les contrats à terme. C'est le premi
PTS Precision Index Oscillator V2
PrecisionTradingSystems
5 (2)
L'oscillateur de l'indice de précision (Pi-Osc) de Roger Medcalf de Precision Trading Systems La version 2 a été soigneusement recodée pour être ultra-rapide à charger sur votre graphique, et quelques autres améliorations techniques ont été incorporées pour améliorer l'expérience. Le Pi-Osc a été créé pour fournir des signaux de synchronisation de trading précis conçus pour trouver des points d'épuisement extrêmes, les points auxquels les marchés sont contraints d'aller simplement pour élim
Welcome to the world of SMC (Smart Money Concepts) Trading, where we empower traders with the tools and knowledge to make smarter trading decisions. Our latest addition to our suite of trading tools is the SMC Trading Pro indicator, version 1.0. Key Features: Major Market Structure Identification with BODY break. Order Block must be in Major Swing ( not Small Swing ). Order Block with Fair Value Gap Detection. Order Block in Discount | Premium zone. Filter for only Bullish, Bearish or All Order
ZeusArrow Smart Liquidity Finder  Smart Liquidity Finder is Ai controlled indicator based on the Idea of Your SL is My Entry. It scan and draws the major Liquidity areas on chart partitioning them with Premium and Discount Zone and allows you find the best possible trading setups and help you decide the perfect entry price to avoid getting your Stop Loss hunted . Now no more confusion about when to enter and where to enter. Benefit from this one of it's kind trading tool powered by Ai an trade
A. Qu'est-ce que l'A2SR ?   * C'est un indicateur technique avancé (pas de peinture, pas de retard). -- Conseils : -- sur https://www.mql5.com/en/blogs/post/734748/page4#comment_16532516 -- et https://www.mql5.com/en/users/yohana/blog A2SR a une technique spéciale pour déterminer les niveaux de Support (demande) et de Résistance (offre). Contrairement à la manière ordinaire que nous avons vue sur le net, A2SR a un concept original pour déterminer les niveaux réels de SR. La technique origin
Beast Super Signal
Dustin Vlok
4.76 (101)
Vous recherchez un puissant indicateur de trading forex qui peut vous aider à identifier facilement des opportunités de trading rentables ? Ne cherchez pas plus loin que le Beast Super Signal. Cet indicateur basé sur les tendances facile à utiliser surveille en permanence les conditions du marché, en recherchant de nouvelles tendances en développement ou en sautant sur celles existantes. Le Beast Super Signal donne un signal d'achat ou de vente lorsque toutes les stratégies internes s'alignent e
FxBears Powers
Rachid Lafhil
3 (2)
️️ Attention:      The price will soon be raised to what it was before ($500).      No more losses with this indicator, test it for years ago and see if there is losses in one day results. but before testing it please see the explaining video down here.    FxBears Powers is working on all forex pairs, metals, commodities, futures, indices, energies, crypto, and everything...and on all timeframes from M1 to MN.   It's based on supply and demand zones, price action, and some internal indicators,
NAM Order Blocks
NAM TECH GROUP, CORP.
5 (1)
MT4 Multi-timeframe Order Blocks detection indicator. Features - Fully customizable on chart control panel, provides complete interaction. - Hide and show control panel wherever you want. - Detect OBs on multiple timeframes. - Select OBs quantity to display. - Different OBs user interface. - Different filters on OBs. - OB proximity alert. - ADR High and Low lines. - Notification service (Screen alerts | Push notifications). Summary Order block is a market behavior that indicates order collection
Présentation de l'indicateur astronomique pour MT4 : Votre compagnon de trading céleste ultime Êtes-vous prêt à élever votre expérience de trading à des hauteurs célestes ? Ne cherchez pas plus loin que notre indicateur astronomique révolutionnaire pour MT4. Cet outil innovant transcende les indicateurs de trading traditionnels en exploitant des algorithmes complexes pour vous fournir des aperçus astronomiques inégalés et des calculs de précision. Un univers d'informations à portée de main : Con
Gold Channel is a volatility-based indicator, developed with a specific timing algorithm for the XAUUSD pair, which consists of finding possible corrections in the market. This indicator shows two outer lines, an inner line (retracement line) and an arrow sign, where the theory of the channel is to help identify overbought and oversold conditions in the market. The market price will generally fall between the boundaries of the channel. If prices touch or move outside the channel it is a tra
Please send me Direct message on MQL5 CHAT after purchasing the Indicator for Training and Installation Support There are some additional files that is important to use with the Indicator . So be sure to contact me after purchasing the Indicator So that I can add you for training and support . If you find any difficulty with installation then send me Direct message here So that I can connect with you via Anydesk or Teamview for the product installation. " Smart Order Block Indicator " to find
L'indicateur " ZigZag on Trend " est un assistant pour déterminer la direction du mouvement des prix, ainsi qu'un calculateur de barres et de pips. Il se compose d'un indicateur de tendance qui surveille la direction du prix avec une ligne de tendance présentée sous la forme d'un zigzag et d'un compteur qui calcule le nombre de barres passées dans le sens de la tendance et le nombre de points sur une échelle verticale. (Les calculs sont effectués par l'ouverture de la barre) L'indicateur n'est p
ECM Channel MT4
Paulo Rocha
5 (1)
ECM Elite Channel is a volatility-based indicator, developed with a specific time algorithm, which consists of finding possible corrections in the market. This indicator shows two outer lines, an inner line (retracement line) and an arrow sign, where the channel theory is to help identify overbought and oversold conditions in the market. The market price will generally fall between the boundaries of the channel. If prices touch or move outside the channel, it's a trading opportunity. The
Introduction to Fractal Pattern Scanner Fractal Indicator refers to the technical indicator that makes use of the fractal geometry found in the financial market. Fractal Pattern Scanner is the advanced Fractal Indicator that brings the latest trading technology after the extensive research and development work in the fractal geometry in the financial market. The most important feature in Fractal Pattern Scanner is the ability to measure the turning point probability as well as the trend probabi
How to use Pair Trading Station Pair Trading Station is recommended for H1 time frame and you can use it for any currency pairs. To generate buy and sell signal, follow few steps below to apply Pair Trading Station to your MetaTrader terminal. When you load Pair Trading Station on your chart, Pair Trading station will assess available historical data in your MetaTrader platforms for each currency pair. On your chart, the amount of historical data available will be displayed for each currency pai
TTM Squeeze indicator for MT4
Renaud Herve Francois Candel
TTM Squeeze Indicator TTM Squeeze is an indicator to time entries based on volatility. TMM Squeeze might well be one of the best and most overlooked indicator. It was created by famous trader John Carter and is also used by many traders like Nathan Bear. Why is the TTM Squeeze indicator important? Because in trading correct timing entries might be more important than picking the right direction.   This is a concept that is not very well understood in the trading community. Most trader think
XQ Indicator MetaTrader 4
Marzena Maria Szmit
3.67 (3)
Step into the realm of Forex trading with confidence and precision using XQ, a cutting-edge Forex indicator designed to elevate your trading game to unprecedented heights. Whether you're a seasoned trader or just stepping into the world of currency exchange,   XQ Forex Indicator   empowers you with the insights and signals needed to make informed trading decisions. The signal conditions are a combination of three indicators, and XQ Forex Indicator only display  medium and long-term trends . The
Gann Signal
Kirill Borovskii
Gann Signal is a very simple indicator at first glance, but hidden inside is many years of experience in studying W.D.Ganna methods. The indicator gives accurate BUY/SELL signals, without redrawing. The indicator is very easy to use. All you need to do is attach it to your chart and follow its recommendations. The indicator constantly analyzes the market for entry opportunities. When such an opportunity appears, the indicator gives a signal in the form of an arrow. I repeat, all signals are NOT
Plus de l'auteur
Candle Patterns
Paul Geirnaerdt
5 (2)
The Candle Patterns indicator shows popular candle patterns on the chart. The possible patterns are Inside Bar, Large Wick, Engulfing, Marubozu, Hammer, Shooting Star, Three White Soldiers and Three Black Crows. Candles are colored to easily identify the patterns. Also, a point and click function displays the pattern found. Settings Message box - when a candle is clicked, the pattern identified will be shown in a Message Box on the charts. All 'Message Box' settings pertain to the box. Show In
Monster Harmonic Indicator
Paul Geirnaerdt
4.61 (31)
Monster Harmonics Indicator is a harmonic pattern indicator. It recognizes Gartley, Bat, Crab, Butterfly, Cypher, White Swan, Black Swan, Shark and several other patterns. Projected patterns that are not yet completed are recognized, too. Monster even shows the PRZ (Potential Reversal Zone). Users can add their own user defined patterns to Monster. Besides the current pattern, Monster also shows all patterns in the symbols history. Monster will provide alerts for developing patterns. Introduced
Better Support & Resistance shows the best support and resistance lines and zones. It is based on Fractals with the factor of your choice. All fractals are assembled, weighted, extended and merged into a clear set of support and resistance lines. The immediate nearby lines are shown as zones when price is in that zone. Better Support & Resistance gives you the best overview of the important price levels. Settings Better Support & Resistance's default settings are good enough most of the time.
Riskscope
Paul Geirnaerdt
Riskscope shows all relevant information about your trades on screen. Information on Stop Loss and Take Profit can be shown as price, pips or exposure. Besides, Riskscope can display a high- and low-watermark of the total of your basket of trades. Settings Riskscope's default settings are good enough most of the time. Nearly all of them are fairly standard. Here are the ones that need some explanation. Monospaced font - set this to the (name of) the font you want to use. A monospaced font looks
TMA Currency Meter
Paul Geirnaerdt
4.14 (7)
TMA Currency Meter is the ultimate currency meter. Based on the Triangular Moving Average of all available symbols, this indicator shows which currencies are strong, strengthening, weak or weakening. Experienced as well as novice traders will see the strong and weak currencies in the blink of an eye, and know which trade possibilities to explore further. TMA Currency Meter is a true Multi Timeframe indicator. It is easy to show the currency strengths for a higher timeframe than the chart timefra
Pivots
Paul Geirnaerdt
2 (1)
Pivots is an indicator to show pivots for relevant time frames. Besides the pivots the indicator can also show daly open line, the resistance and support levels, the ADR Fibonacci levels and the order of the pivots. Pivots includes an intelligent algorithm to eliminate Sunday candles, but only if your broker provides those. Pivots are significant price levels that may serve as support, resistance or breakout levels Settings textFont - font to use for the labels. textSize - font size. textColor -
Inside Bars
Paul Geirnaerdt
5 (1)
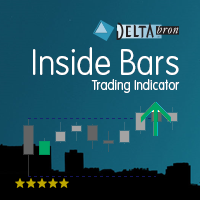
The Inside Bars indicator shows Inside Bars, the Breakout Zone and Breakouts thereof. Inside Bars are an important price action pattern. The price action of an Inside Bar is completely covered by the price action of the previous bar. Inside Bars are most often used on higher timeframes. Settings Inside Bars default settings are good enough most of the time. Feel free to fine tune them to your needs. ATR factor to skip large candles - very large candles should be filtered as they often cover othe
Engulfing Bars
Paul Geirnaerdt
5 (1)
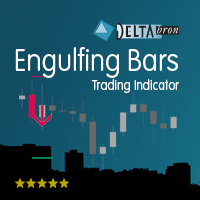
The Engulfing Bars indicator shows Engulfing Bars, the signal and the suggested stoploss and take profit. Engulfing Bars are an important price action pattern. The price action of an Engulfing Bar completely covers the price action of the previous bar. Engulfing Bars are most often used on higher timeframes. Settings Engulfing Bars default settings are good enough most of the time. Feel free to fine tune them to your needs. Show Engulfing Bars - Set to true to show Engulfing Bars. Body size pe
Flying Volume
Paul Geirnaerdt
1 (1)
The Flying Volume indicator is a specialized volume indicator. It deciphers the volume data after heavy proprietary number crunching. When a main signal is found Flying Volume will look for possible continuation points. The main signal is shown by arrows, the continuation points by dots. Volume indicators are most often used on higher timeframes. Features Main Buy or Sell signals Continuation signals No repainting One signal per bar Settings Flying Volume default settings are good enough mos
Fractalicious
Paul Geirnaerdt
5 (1)
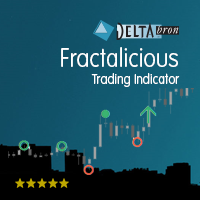
Fractalicious shows Fractals of any length, higher or lower highs and lower of higher lows, the fractal channel and the breakout of the channel. Fractals are an important trend and price action pattern. Fractalicious can be used on any timeframe and symbol. Settings Fractalicious default settings are good enough most of the time. Feel free to fine tune them to your needs. Show last fractal - Set to true to show fractals from the last completed bar. (This could move the fractal if the current b
Breakout Hero
Paul Geirnaerdt
2.64 (11)
Breakout Hero is a Multi Symbol , Auto Timeframe , Breakout Expert Advisor . It recognizes breakout patterns and will set pending trades. When triggered Breakout Hero will monitor trades and adjust the stop loss. Breakout Hero is a multi symbol EA, it will trade EURUSD, GBPUSD, USDJPY and USDCAD. Also, Breakout Hero is auto timeframe. Just drop Breakout Hero on any chart and start trading. Only one chart is needed, Breakout Hero will trade the symbols you pick from the settings. You can monitor
Dark Rider
Paul Geirnaerdt
3 (4)
Dark Rider  is a Night Scalper Expert Advisor . It recognizes overbought and oversold conditions in the hours after close of the New York Exchange and trades accordingly. Dark Rider features an on screen monitor and settings panel on which you can monitor your status and progress.  A signal for Dark Rider can be found here . New in version 1.5 The option 'Stay in trending trades' is new for version 1.5. It will keep you in trending trades. Profitability has been increased while drawdown has be
Divergence Dash
Paul Geirnaerdt
3 (2)
Diverence Dash is a MACD, RSI, OBV, Momentum, Stochastic or Standard Deviaviation Divergence Dashboard. It will scan all symbols and timeframes you want. Also, Divergence Dash can open charts with the divergence found using the template of your choice. Divergences are often used as a leading indicator and, by using Divergence Dash, are easy to spot. The risk/reward ratio in divergence trading is very low. What can Divergence Dash for you: Find MACD, RSI, OBV, Momentum, Stochastic or Standard Dev
Fusion Trader
Paul Geirnaerdt
5 (1)
NEWS Price increased to $249 from $149 on September 16th. Buy Fusion Trader v2 and get Donchian Trader for free. (limited to 3 account numbers) Fusion Trader v2  is a  Multi Symbol ,  Auto Timeframe ,  Expert Advisor . It features several strategies for different symbols and timeframes. Fusion Trader will monitor trades and adjust the stop loss. Fusion Trader v2  is a complete rewrite from v1, it trades different and more symbols. With default settings Fusion Trader has gained 5% monthly on ave
Donchian Trader
Paul Geirnaerdt
Donchian Trader is a   Multi Index ,   Auto Timeframe ,   Expert Advisor . It features a Donchian Channel strategy for different indices on the daily timeframe. Donchian Trader will monitor trades and adjust to market conditions. Donchian Trader is a multi index EA, For now, it will trade the Dow Jones (US30), S&P 500 (US500) and DAX (GER30). Also, Donchian Trader is auto timeframe. Just drop the EA on any chart and start trading. Only one chart is needed, Donchian Trader will trade the indices
MonsterDash Harmonics Indicator is a harmonic pattern dashboard. It recognizes all major patterns. MonsterDash is a dashboard that displays all detected patterns for all symbols and (almost) all timeframes in sortable and scrollable format. Users can add their own user defined patterns . MonsterDash can open and update charts with the pattern found. Settings MonsterDash's default settings are good enough most of the time. Feel free to fine tune them to your needs. The color settings are for th
NEWS Launch Price for a limited period now $499. Fusion Trader v3  is a  Multi Symbol ,  Auto Timeframe ,  Expert Advisor . It features several strategies for different symbols and timeframes. Fusion Trader will monitor trades and adjust the stop loss. Fusion Trader v3  is a complete rewrite from v2, it trades differently and more symbols. It is now 100% Metratrader 5 compatible. Fusion Trader v3 is a multi symbol EA, For now, it will trade several symbols. Also, Fusion Trader is auto timeframe
Filtrer:
ohyman
271
ohyman 2023.08.07 14:37 
 

I would like the developer to do a detail video on how to take trades with the completed pattern and also another filter indicator to avaoid frequesnt stop out and pattern disappearing

Suvashish Halder
21341
Suvashish Halder 2021.10.21 12:37 
 

It works and I become a fan of Harmonic Patterns 😍 Very good indicator. Thank you, Paul 🙂

faithdefender
1726
faithdefender 2021.01.27 22:42 
 

So far, in my trading experiences with this scanner, it has not been the reliable scanner everyone says in the reviews. I have been going back and forth asking questions to Paul, but I am getting general answers. It may be because I am not communicating the issue properly? I recently complained about the scanner showing 1 price for the Daily GBPJPY with a "C" for complete, and when the price went past the D point, it changed to a different value. I entered the trade when it hit the D point @142.26, but I was stopped out. I looked at the scanner to make sure of the price, and the scanner now showed the D point at 142.85. Before I posted this review, I looked to see if anyone else had this problem and sure enough, I read above that @Doaa Elwy said almost the same thing I am complaining about. ((Please note this was back in Mar 2016 and still the same problem)) He wrote ""I just rented it, it does something very strange, it was showing bearish patterns in GBPJPY.. and it showed it completed .. then the market move up, The completion price changed .. then after 5 minutes, the GBPJPY disappeared from the dash board. for me this is exactly like an indicator that repaints.."I can't rely on it."" What's odd is that it was the same pair as he spoke of. I have hope for this indicator scanner, but not at this time. The price was not terrible, but the functionality is a concern and cannot be trusted at the moment. At least, with his Monster Indicator, he provides a stop and a target once the pattern is identified. Maybe he could do this on the scanner as well? But I am not hopeful because I see where someone had make recommendations in 8-19-2018 for changes to his harmonic indicator but there have been no additions/changes made since 7-24-2018. This is my 3rd indicator I have purchased. I forgot to mention also that the print is very small and I like to highlight the symbol to make sure I hit the right chart to open up, but if the chart you want to open is highlighted, it does nothing when you click on the pair. I have to highlight the one above or the one below to get my bearings and then I can click on the right chart. Once it opens, I then have to zoom in for the chart to display the prospective pattern. It can work, but inconvenient. UPDATE 1-28-21 The scanner has now (again) replaced the completed price on the same pattern, GBPJPY AB=CD daily, and is now142.92. At 10:17 hrs it is now 143.21 showing "Complete." The point I am making is the scanner identifies what is "C" and what is "P". You cannot trade when the scanner is discarding "complete" prices for new "complete" prices. Update-1-28-21 @1202 hrs, "completed" price is now at 143.24. Again, my point is this should show a P and not a C. It is either completed or projected. Update. 1-28-21 1520 hrs= Daily Ab=CD GBPJPY now @ 143.26....Update 2-1-21--so far not a word about the problem I encountered. (The GBPJPY finally fell off the scanner line-up) I would like to see this resolved for the money I paid, but there has not been a word of communication regarding the problem. I would like to provide a good review in the future. Update; As of 2-7-21 no communication from the vendor. No attempt to solve the problem. UPDATE; as of 6-27-21, no communication from the Vendor. As of 1/29/22 the Vendor has not reached out. Please note the indicator does identify patterns. That is not the problem. The problem is the indicator does not identify patterns as Scott Carney's instructions would. There is more to harmonics then just drawing Fibonacci's.

Mehdi Faraz Fard
2330
Mehdi Faraz Fard 2018.11.19 17:14 
 

L'utilisateur n'a laissé aucun commentaire sur la note

Gursimran Singh Bharaj
114
Gursimran Singh Bharaj 2018.06.22 11:43 
 

I have rented this indicator. I had already bought the monster harmonic indicator a long time back. I missed a dashboard where multiple patterns are detected on a time frame. this does the job well. I am giving it 5 stars for the way it performs.

don't expect that if a pattern forms you just open a trade. you have to take other factors into account.

reo4ua
157
reo4ua 2018.03.29 22:43 
 

Paul,

What a fantastic time saver you have here. Honestly - one could trade using only your indicator and key levels and make all the money they want. Thank you for sharing this with us. Two requests if you would consider them for the next version: the ability to remove a signal from the list to keep it as clutter free as possible (for instance if you wake up to patterns where the optimal trade entry level has already come and gone - no sense in seeing it anymore) and a free-form notes column to the right of the "chart" button. Since I trade mainly with weekly pivots, noting point "d"'s proximity to the closest weekly fib pivot would be nice too.

Thanks again for what you do for the MT community!

Morard Kevin
1506
Morard Kevin 2017.11.08 21:00 
 

very good thank you

pnutfx503
1524
pnutfx503 2017.07.08 03:03 
 

Great work

sasans
877
sasans 2017.04.13 01:14 
 

very good indicator, few trades till now all was accurate

Jiahao Peng
35
Jiahao Peng 2017.03.14 20:37 
 

Hi Paul, can you please explain what is C/P and what is the read the Age(where is the start point?)

Julian Lo
716
Julian Lo 2017.02.16 05:13 
 

Very nice piece of work. I only look at completed patterns with young age. Together with other confluences for confirmation it becomes unbeatable. There are a few bugs, but nothing that I cannot live with. I am sure Paul will fix them soon.

Kevin Manrrique
420
Kevin Manrrique 2017.01.30 23:33 
 

January 30, 2017.

Just bought the monthly trial. I love the indicator so far, kinda confusing since very slow and so much writing. Just made a trade, hopefully, it goes well. Accuracy is 100%, so let's see. If this goes well, I really want to get in touch with the builder/ author. I want this indicator to grow, and help people all over and try to reach them!

January 30, 2017 (UPDATE)

Have been using indicator, and it's amazing how such a software works. I only have one problem... The dashboard for the patterns always refreshes randomly and loses some signals throughout the process. The other thing is, Instead of showing 0 bars, can we show the bars starting at 1?

I like the dashboard but I think the software will be better and not lag as much if the indicator used for each pair separately giving each screen (pair) a signal then having all these signals on a dashboard. I think this will stop the lagging and the reset/ refreshed.

david.l
484
david.l 2016.09.09 09:35 
 

work as it is, but you need strategy to confirm the pattern, not all completed pattern bring you profit.

Bruce Parker
148
Bruce Parker 2016.05.22 06:19 
 

the first step to winning trades is understanding which harmonic patterns have the highest the probability for success. there are 2 types of harmonic patterns. the first type is a reversal harmonic pattern that I stay away from because trying to call tops and bottoms is DEFINITELY not for me TRYING TO MAKE THOSE TYPE OF CALLS, UNLESS YOU ARE GOD. the second type of harmonic pattern is a continuation harmonic pattern and for me that's money in the bank; especially on a 5 minute chart playing a harmonic continuation pattern using one of my favorite weapons , binary options that expire in 10 to 25 minutes. I bought monster dash last month, but just really started using it 2 weeks ago and turned my 500 deposit in my binary account into over $3,000.00 in the past 2 weeks. that means I'm up 2500 the past 2 weeks trading just 100 per trade. it would have been nice if i was trading 500 per trade and would be up 10,000 instead, but i choose to start small and work my way up the ladder to 500 per trade.

HERE ARE MY STATS

I placed a total of 109 trades in the last 2 weeks... I won 66 trades and lost 43 trades hitting over 60%.

however I would have done much better if I was not mixing in the 1 minute chart harmonic continuation patterns and the winning ration on those only appears to be in the 50% range.

so the last 2 days I cut out the 1 minute chart and only used the 5 minute chart harmonic continuation patterns going 13-3 with a winning rate of over 80%!!! I also went back to all my 5 minute chart plays I made over the last 2 weeks pulling out the actual harmonic continuation plays and saw they were also all hitting close to 80 % if it had a binary option expiration date of 10 to 25 minutes.

if you are trading with a regular Forex broker i would not recommend using a 5 minute chart unless you are scalping; I would go with a 15 minute chart or higher using only harmonic continuation patterns and staying away from harmonic reversal patterns. as a general rule of thumb, if you are going long, than the MA(200) line should be moving up and the 5 day average should be moving up, otherwise its not a continuation pattern and would be considered a harmonic reversal pattern ; it does not matter if the price is above or below the MA(200) or the 5 day moving average as long as both lines are moving up.

and vice versa if you are going short, than than the MA(200) line should be moving down and the 5 day average should be moving down, otherwise its not a harmonic continuation pattern but considered a harmonic reversal pattern instead.

BASED ON WHAT I HAVE SEEN SO FAR, THE DIFFERENCE IN WINNING PERCENT BETWEEN A HARMONIC CONTINUATION PATTERN AND A HARMONIC REVERSAL PATTERN IS HUGE BY AT LEAST 10 TO 20 % OR BETTER. SO INSTEAD OF STRUGGLING TO HIT 50 TO 60% WITH A HARMONIC REVERSAL PATTERN TRYING TO CALL TOPS AND BOTTOMS THERE IS A MUCH BETTER WAY... INSTEAD YOU CAN REALLY KICK SOME ASS WITH A HARMONIC CONTINUATION PATTERN HITTING MORE LIKE 60% TO 70% OR BETTER WITH YOU TRADES; OR IF YOU ARE AS GOOD AS I AM THAT NOW MASTERS THE 5 MINUTE HARMONIC CONTINUATION PATTERN HIT 80% OR BETTER. I know its only been 2 weeks but it looks very promising by me just focusing all my efforts on the 5 minute chart harmonic continuation patterns that expires in the next 10 to 25 minutes. it also helps if you are using a binary broker that will pay you at least an 80% return for binary options that expire in 10 to 25 minutes and pay you back 5% on your losses, that way even if you only hit 55% you still will do slightly better than break even. than again if you are only hitting 55% with harmonic continuation patterns, than those are really not harmonic continuation patterns you thought you were trading.

Amjad Muhaisen
1371
Amjad Muhaisen 2016.04.20 12:30 
 

just bought the indicator, absolutely amazing, thank you

darktideac2
247
darktideac2 2016.04.08 11:20 
 

Insanely great (as Steve Jobs would have put it). Tops some of the paid saas offerings out there that I am also signed up for - and at a much lower price.

Doaa Elwy
637
Doaa Elwy 2016.03.28 00:55 
 

I just rented it,

it does something very strange, it was showing bearish patterns in GBPJPY.. and it showed it completed .. then the market move up, The completion price changed .. then after 5 minutes, the GBPJPY disappeared from the dash board.

for me this is exactly like an indicator that repaints..

I can't rely on it.

maithai
1922
maithai 2016.01.22 10:29 
 

great indicator - used with other confirmations for entry, very useful. from lots of charts open, this makes life so much easier

Harmonictrader7
38
Harmonictrader7 2016.01.05 08:53 
 

Great indicator! Saves me a lot of time. Thanks Paul.

frederic gaspari
60
frederic gaspari 2015.10.13 10:05 
 

fantastic indicator, better than all these expert advisors scams, buy eyes closed

12
Répondre à l'avis
Version 3.4 2019.09.01
* Added PRZ in selected patterns to show
Version 3.3 2018.10.19
* Added Alt Bat, Deep Crab, 3 Drives & 5-0 patterns
* Added auto DPI scaling
Version 3.2 2017.08.10
* User can 'Approve' and 'Ignore' patterns
* Update opened charts
* Improved pattern drawing
* Resolved issue loss of pattern list
* Pattern selection for better readability
Version 3.1 2017.04.14
* Patterns now sortable on Completed/Projected
* New user setting to include symbols
* Scrollbar suppports click on page up and page down area
* Output grid can be expanded to accomodate high resolution monitors
Version 3.0 2016.11.22
Major upgrade
- Custom user patterns
- Looks for patterns on offline charts
- Resolved issue on pattern template
Version 2.3 2015.12.02
Minor upgrade
- added column 'C/P' which displays if a pattern is completed or projected.
- improved the price format in the 'completion' column to allow instruments like indices.
Version 2.2 2015.10.26
* Dragon pattern
Version 2.1 2015.08.07
New patterns:
- White Swan
- Black Swan
- Shark
- AB=CD
Version 2.0 2015.06.23
This is a major upgrade to version 2.
- Sortable columns
- Scrollable grid
- Open charts with pattern
- Update pattern on opened charts
Version 1.300 2015.06.01
Solved issue in Strategy Tester.
Version 1.200 2015.03.24
- Optimized accuracy
- Timeframe user input parameters
Version 1.100 2014.12.02
- Alerts: Screen, Email & Push
- Color Palettes, pick 'Dark' or 'Light' background