• Aperçu
  • Avis (5)
  • Commentaires (3)

Gm Volumes

4
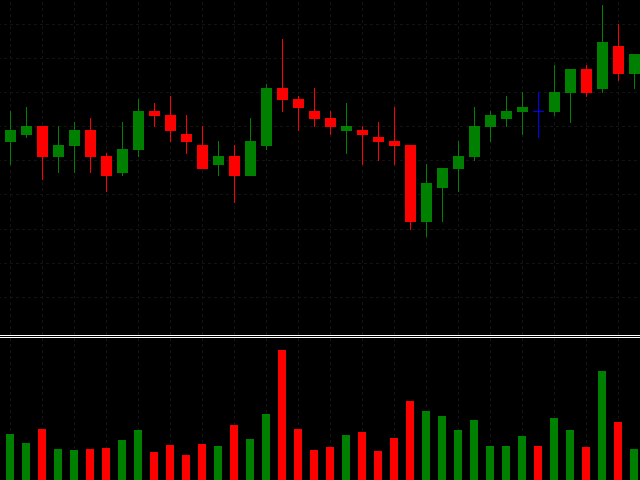
A simple volume indicator according to the color of the candle!


- Custom background!

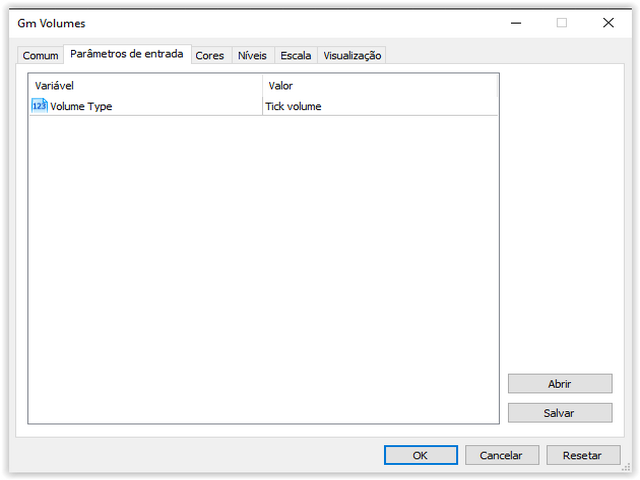
- Supports Volume by Ticks or Real Volume.

The original Metatrader Volume indicator does not show the colors of the bar according to the color of the Candle, it only changes color when the volume of a candle is greater than the previous one, this sometimes creates confusion for beginners and does not know the real reason for the color change.

Free indicator, support may take a while to respond!
Avis 5
KATTY2010
196
KATTY2010 2022.07.12 02:51 
 

bien

Gena2905
14
Gena2905 2021.10.23 13:38 
 

Индикатор шикарный! Но, окрашивает сам цветовую схему в черный и включает линии bid, ask! Если-бы это убрать, было-бы круто!

Erison Francisco De Sales
1014
Erison Francisco De Sales 2021.06.22 20:54 
 

It's a good indicator, but we can't save our changed colors preferences.

Produits recommandés
Waves Sizer
Flavio Javier Jarabeck
3.67 (6)
Wyckoff fans, enjoy! Ideally to be used with the Weis Waves indicator, but it can be easily used alone, the Waves Sizer puts the range (in resulting Price movement) done by the Price on its market swings. You can control how accurate or loose will be the swings. This tool is very helpful for visually know how much the Price has traveled in your Timeframe. This way you can confront this level of effort with the resulting Volume, etc... Weis Waves indicator: https://www.mql5.com/en/market/produc
FREE
Aggression Volume
Flavio Javier Jarabeck
4.14 (14)
Aggression Volume Indicator is the kind of indicator that is rarely found in the MQL5 community because it is not based on the standard Volume data provided by the Metatrader 5 platform. It requires the scrutiny of all traffic Ticks requested on the platform... That said, Aggression Volume indicator requests all Tick Data from your Broker and processes it to build a very special version of a Volume Indicator, where Buyers and Sellers aggressions are plotted in a form of Histogram. Additionally,
FREE
Value Chart Candlesticks
Flavio Javier Jarabeck
4.73 (11)
The idea of a Value Chart indicator was presented in the very good book I read back in 2020 , " Dynamic Trading Indicators: Winning with Value Charts and Price Action Profile ", from the authors Mark Helweg and David Stendahl. The idea is simple and the result is pure genius: Present candlestick Price analysis in a detrended way! HOW TO READ THIS INDICATOR Look for Overbought and Oversold levels. Of course, you will need to test the settings a lot to find the "correct" one for your approach. It
FREE
This indicator will mirror the assets in use in another metatrader, being able to choose the timeframe and a template. This is the Metatrader 5 Client, it needs the Metatrader 4 or 5 Server versions: Metatrader 4 Mirror Chart Server:   https://www.mql5.com/en/market/product/88644 Metatrader 5 Mirror Chart Server: https://www.mql5.com/en/market/product/88652 Details of how it works in the video.
FREE
MW Volume
Martin Bittencourt
3.8 (5)
The Martinware Volume indicator plots a colored moving average over volume bars. The coloring uses three colors and can be done in different ways choosable by the user and is applied both to the average as to the volume bars. Three types of coloring are possible: None: no coloring is done Increasing or decreasing: changes the color depending on the current value being bigger or lesser than the previous one Volume relative to average: colors vary if the current volume is bigger or lesser then
FREE
Weis Waves
Flavio Javier Jarabeck
2.83 (18)
The original author is David Weis, an expert in the Wyckoff Method. The Weis Wave is a modern adaptation of the 1930's Wyckoff Method, another expert in Tape Reading techniques and Chart Analysis. Weis Waves takes market volume and stacks it into waves according to price conditions giving the trader valuable insights about the market conditions. If you want to learn more about this subject you can find tons of videos in YouTube. Just look for "The Wickoff Method", "Weis Wave" and "Volume Spread
FREE
L'indicateur   "Haven Key Levels PDH PDL"   aide les traders à visualiser les niveaux clés sur le graphique. Il marque automatiquement les niveaux suivants : DO (Daily Open)   — Niveau d'ouverture du jour. NYM (New York Midnight)   — Niveau de minuit à New York. PDH (Previous Day High)   — Haut du jour précédent. PDL (Previous Day Low)   — Bas du jour précédent. WO (Weekly Open)   — Niveau d'ouverture de la semaine. MO (Monthly Open)   — Niveau d'ouverture du mois. PWH (Previous Week High)   —
FREE
Bar Countdown
Mario Antonio Oliveira
4.75 (4)
Bar Countdown is a simple indicator for MetaTrader 5 that shows the time remaining of the each candle. It can be placed in any corner of the chart or near of the price close and it'll help you to know if the current candle is ending. Choose the counter format between HR:MIN:SEC and MIN:SEC It is so easy to use, configure the color, size and counter position on the chart and that's it!!! The Countdown starts now! Updates: 2021/02/28; v1.0: Initial release 2021/03/16; v1.1: Minor code changes   
FREE
AvgVolumes
Marco Montemari
5 (1)
This indicator is based on Volumes standard indicator, calculates the average of Volumes based on the last N bars set by users, and if the value of the volume is bigger then a set % respect the average a different color will be used. The indicator is shown in a separate indicator window. This version has now a limitation in setting the % about the threshold. If you are interested to set threshold consider to buy the PRO version ( https://www.mql5.com/en/market/product/35925 ) If you want to use
FREE
Simple Midas
Jean Jacques Huve Ribeiro
5 (2)
Initiated in 1995 by the physicist and technical analyst Paul Levine, PhD, and subsequently developed by Andrew Coles, PhD, and David Hawkins in a series of articles and the book MIDAS Technical Analysis: A VWAP Approach to Trading and Investing in Today's Markets.Latterly, several important contributions to the project, including new MIDAS curves and indicators, have been made by Bob English, many of them published in the book.
FREE
Important Lines
Terence Gronowski
4.86 (21)
This indicator displays Pivot-Lines, preday high and low, preday close and the minimum and maximum of the previous hour. You just have to put this single indicator to the chart to have all these important lines, no need to setup many single indicators. Why certain lines are important Preday high and low : These are watched by traders who trade in a daily chart. Very often, if price climbs over or falls under a preday low/high there is an acceleration in buying/selling. It is a breakout out of a
FREE
Order Book, known also as Market Book, market depth, Level 2, - is a dynamically updated table with current volumes of orders to buy and to sell specific financial instument at price levels near Bid and Ask. MetaTrader 5 provides the means for receiving market book from your broker, but in real time only, without access to its history. This expert adviser OrderBook History Playback allows you to playback the market book events on the history using files, created by OrderBook Recorder . The exper
FREE
This indicator sums up the difference between the sells aggression and the buys aggression that occurred in each Candle, graphically plotting the waves of accumulation of the aggression volumes.   Through these waves an exponential average is calculated that indicates the direction of the business flow. Note: This indicator DOES NOT WORK for Brokers and/or Markets WITHOUT the type of aggression (BUY or SELL).   Be sure to try our Professional version with configurable features and alerts:  Agre
FREE
BoxInside MT5
Evgeny Shevtsov
5 (4)
This indicator calculates the volume profile and places labels that correspond to the VAH, VAL and POC levels, for each candle individually. Indicator operation features The indicator works on the timeframes from M3 to MN, but it uses the history data of smaller periods: M1 - for periods from M3 to H1, M5 - for periods from H2 to H12, M30 - for the D1 period, H4 - for the W1 period, D1 - for the MN period. The color and location of the VAL, VAH and POC labels on the current candle are considere
FREE
Tick Bars
Henrique Helmuth Kreutz Pfeifer
Indicator that show candlestick bars with an different sampling method than time fixed. Real time data is sourced to the indicator and it may be used as substitute of the default graph. Each bar is formed when a predefined amount of ticks is received, showing in the graph the OHLC of this clusteri of ticks. The input variable is the amount of ticks of each bar. It's a different approach of sampling, the amount of bars is proportional to the amount of negotiations insted of a sample in a fixed am
FREE
Server Clock
Flavio Javier Jarabeck
5 (4)
Many friends asked me for a simple, non-obtrusive, resource-friendly clock to track the time during their trades. It seems pretty obvious, but it is a must-have for those trading the market manually, waiting for the Market News, or just to visually know what time it is... Trading is an absorbing endeavor! So, here it is... Totally configurable, including Font Type, Font Size and Chart Location: Upper Left/Center/Right OR Lower Left/Center/Right, with a little twist of adjusting the Offset, just
FREE
Market Profile 3 ForexArby com
Hussien Abdeltwab Hussien Ryad
3.93 (14)
Market Profile 3 MetaTrader 5 indicator  version 4.70— is a classic Market Profile implementation that can show the price density over time, outlining the most important price levels, value area, and control value of a given trading session. This indicator can be attached to timeframes between M1 and D1 and will show the Market Profile for daily, weekly, monthly, or even intraday sessions. Lower timeframes offer higher precision. Higher timeframes are recommended for better visibility. It is als
FREE
Tick Speed Free MT5
John Louis Fernando Diamante
Tick Speed Free povides a on-chart label of tick speed to allow you to see the ebb and flow of market activity. Observing rises and falls in tick speed may allow you to better time entries to reduce slippage and re-quotes. Options include: - colores for low-mid-high tick speeds - placement and styling - prefix & suffix to customise the speed label Troubleshooting: - Note, in the tester environment, tick timings are limited to what is supplied by the tester environment and it's speed - If there
FREE
Simple Vwap with the daily, weekly and monthly VWAP is the abbreviation for   volume-weighted average price , which is a technical analysis tool that shows the ratio of an asset's price to its total trade volume. It provides traders and investors with a measure of the average price at which a stock is traded over a given period of time. How it's used Identify entry and exit points:   Traders can use VWAP to determine when to buy or sell an asset.   Understand price trends :  Traders can use V
FREE
Expansoes M
Marcus Vinicius Da Silva Miranda
The M Extensions are variations of the Golden Ratio (Fibonacci Sequence). It is the World's first technique developed for Candle Projections. Advantages: Easy to plot. Candle anchoring; High and accurate precision as support and resistance; Excellent Risk x Return ratio; Works in any timeframe; Works in any asset / market.   The M Extensions are classified into: M0: Zero point (starting candle) RC: Initial candle control region M1: Extension region 1 M2: Extension region 2 M3: Extension regi
FREE
Tabajara V5
Flavio Javier Jarabeck
4.85 (33)
Metatrader 5 version of the famous Andre Machado's Tabajara indicator. If you don't know Andre Machado's Technical Analysis work you don't need this indicator... For those who need it and for those several friend traders who asked this porting from other platforms, here it is... FEATURES 8-period Moving Average 20-period Moving Average 50-period Moving Average 200-period Moving Average Colored candles according to the inflexion of the 20-period MA SETTINGS You can change the Period of all MA's
FREE
FVGs
Andrii Hurin
5 (9)
A simple indicator that automatically highlights all FVGs (Fair Value Gaps) formed on the chart, as well as FVGs on history. It is possible to select colors for FVGs of different directions (long or short), select the time interval, select the color of middle point and you can also choose whether to delete filled FVGs or leave them on the chart (the option is beneficial for backtesting). The indicator can be very useful for those, who trade according to the concept of smart money, ICT, or simply
FREE
This indicator show the candle remaining time on the chart and/or in the corner of the window. It also display notificaton (popup and push) when a new candle is formed (optional). You configure the timer on candles and at chart corner. I don't need to explain the functions because are very simple. MT4 version:  https://www.mql5.com/en/market/product/38677 Any doubt or suggestion please contact us. Enjoy! This is a free indicator, but it took hours to develop. If you want to pay me a coffee, I a
FREE
Volume Candlestick Bars
Henrique Helmuth Kreutz Pfeifer
Indicator that show candlestick bars with an different sampling method than time fixed. Real time data is sourced to the indicator and it may be used as substitute of the default graph. Each bar is formed when a predefined volume of assets was dealt, showing in the graph the OHLC of this clustering. The amount of bars is proportional to the amount of negotiations instead of a sample in a fixed amount of time. If the broker doesn't show the real volume of the trades, this indicator won't work. Th
FREE
The Rayol Code Hour Interval Lines indicator was  designed to assist your trading experience.  It  draws the range of hours chosen by the user directly on the chart, so that it enables traders to visualize price movements during their preferred trading hours, providing  traders a more comprehensive view of price movements and market dynamics. This indicator allows the user to choose not only the Broker's time, but also the Local time. This way, the user no longer needs to calculate local time in
FREE
MIDAS Super VWAP
Flavio Javier Jarabeck
4.44 (9)
Imagine VWAP, MVWAP and MIDAS in one place... Well, you found it! Now you can track the movement of Big Players in various ways, as they in general pursue the benchmarks related to this measuring, gauging if they had good execution or poor execution on their orders. Traders and analysts use the VWAP to eliminate the noise that occurs throughout the day, so they can measure what prices buyers and sellers are really trading. VWAP gives traders insight into how a stock trades for that day and deter
FREE
Prior Cote
Ricardo Rodrigues Lucca
In this indicator you choice a data to be used from yesterday (high, low, open, close, etc) to automatically draw an line to be the zero. And, from that a percentage deviation ("Percentage to be used") is calculated and used to draw others line to both side until a limit be reached. Both sides can have diferrent colours as show in screenshots. Also, more than one indicator can be used at same time.
FREE
Wave Box Market Frenquency
Jean Jacques Huve Ribeiro
4.75 (4)
Totally linked to the result of a movement and the duration he had. Its height records how many ticks the asset walked during a given movement, its width shows us the duration that movement had. Its configuration must be in line with the Weis Wave Indicator configuration to observe the movement force and can indicate a possible accumulation or distribution of the movement;
FREE
LT Donchian Channel
Thiago Duarte
4.83 (6)
Donchian Channel is an indicator created by Richard Donchian. It is formed by taking the highest high and the lowest low of the last specified period in candles. The area between high and low is the channel for the chosen period. Its configuration is simple. It is possible to have the average between the upper and lower lines, plus you have alerts when price hits one side. If you have any questions or find any bugs, please contact me. Enjoy!
FREE
Order Book, known also as Market Book, market depth, Level 2, - is a dynamically updated table with current volumes of orders to buy and to sell specific financial instument at price levels near Bid and Ask. MetaTrader 5 provides the means for receiving market book from your broker in real time. The expert OrderBook Recorder records market book changes and stores them in local files for further usage in indicators and expert adviser, including testing in the tester. The expert stores market book
FREE
Les acheteurs de ce produit ont également acheté
Trend Screener Pro MT5
STE S.S.COMPANY
4.89 (72)
Indicateur de tendance, solution unique révolutionnaire pour le trading et le filtrage des tendances avec toutes les fonctionnalités de tendance importantes intégrées dans un seul outil ! Il s'agit d'un indicateur multi-période et multi-devises 100 % non repeint qui peut être utilisé sur tous les symboles/instruments : forex, matières premières, crypto-monnaies, indices et actions. Trend Screener est un indicateur de suivi de tendance efficace qui fournit des signaux de tendance fléchés avec des
Golden Trend Indicator MT5
Noha Mohamed Fathy Younes Badr
4.86 (14)
Golden Trend indicator  is The best indicator for predicting trend movement this indicator never lags and never repaints and never back paints    and give  arrow buy and sell    before the candle appear  and it will help you and  will make your trading decisions clearer its work on all currencies and  gold and crypto and all time frame This unique  indicator uses very secret algorithms to catch the  trends, so you can trade using this indicator and see the trend clear on charts  manual guide and
FX Volume MT5
Daniel Stein
4.82 (17)
FX Volume : Découvrez le Sentiment du Marché tel que perçu par un Courtier Présentation Rapide Vous souhaitez faire passer votre approche de trading au niveau supérieur ? FX Volume vous fournit, en temps réel, des informations sur la manière dont les traders particuliers et les courtiers sont positionnés—bien avant la publication de rapports retardés comme le COT. Que vous visiez des gains réguliers ou recherchiez simplement un avantage plus solide sur les marchés, FX Volume vous aide à repére
FX Power MT5 NG
Daniel Stein
5 (10)
FX Power : Analysez la force des devises pour des décisions de trading plus intelligentes Aperçu FX Power est l'outil essentiel pour comprendre la force réelle des principales devises et de l'or, quelles que soient les conditions du marché. En identifiant les devises fortes à acheter et les faibles à vendre, FX Power simplifie vos décisions de trading et révèle des opportunités à forte probabilité. Que vous suiviez les tendances ou anticipiez les retournements à l'aide de valeurs extrêmes de D
Quantum TrendPulse
Bogdan Ion Puscasu
5 (13)
Présentation de   Quantum TrendPulse   , l'outil de trading ultime qui combine la puissance de   SuperTrend   ,   RSI   et   Stochastic   dans un seul indicateur complet pour maximiser votre potentiel de trading. Conçu pour les traders qui recherchent précision et efficacité, cet indicateur vous aide à identifier les tendances du marché, les changements de dynamique et les points d'entrée et de sortie optimaux en toute confiance. Caractéristiques principales : Intégration SuperTrend :   suivez f
IX Power MT5
Daniel Stein
4.83 (6)
IX Power : Découvrez des insights de marché pour les indices, matières premières, cryptomonnaies et forex Vue d’ensemble IX Power est un outil polyvalent conçu pour analyser la force des indices, matières premières, cryptomonnaies et symboles forex. Tandis que FX Power offre une précision maximale pour les paires de devises en utilisant toutes les données disponibles, IX Power se concentre exclusivement sur les données du symbole sous-jacent. Cela fait de IX Power un excellent choix pour les m
FX Levels MT5
Daniel Stein
5 (2)
FX Levels : Des zones de Support et Résistance d’une Précision Exceptionnelle pour Tous les Marchés Présentation Rapide Vous recherchez un moyen fiable pour déterminer des niveaux de support et résistance dans n’importe quel marché—paires de devises, indices, actions ou matières premières ? FX Levels associe la méthode traditionnelle « Lighthouse » à une approche dynamique de pointe, offrant une précision quasi universelle. Grâce à notre expérience réelle avec des brokers et à des mises à jour
TPSpro RFI Levels MT5
Roman Podpora
4.53 (19)
INSTRUCTIONS       RUS   -   ANGLAIS       Il   est recommandé de l'utiliser avec un indicateur       -       TPSpro   TENDANCE PRO -   Version MT4         Bonus: 6 months of  "RFI SIGNALS"  subscription with your purchase! Un élément clé du trading est constitué par les zones ou les niveaux à partir desquels les décisions d'achat ou de vente d'un instrument de trading sont prises. Malgré les tentatives des principaux acteurs de dissimuler leur présence sur le marché, ils laissent inévitable
TPSproTREND PrO MT5
Roman Podpora
4.47 (17)
TPSpro TREND PRO  - is a trend indicator that automatically analyzes the market and provides information about the trend and each of its changes, as well as giving signals for entering trades without redrawing! The indicator uses each candle, analyzing them separately. referring to different impulses - up or down impulse. Exact entry points into transactions for currencies, crypto, metals, stocks, indices!  ИНСТРУКЦИЯ RUS         INSTRUCTIONS  ENG       R ecommended to use with an indicator   -
RelicusRoad Pro MT5
Relicus LLC
4.78 (18)
Maintenant 147 $ (augmentant à 499 $ après quelques mises à jour) - Comptes illimités (PCS ou Mac) Manuel d'utilisation RelicusRoad + Vidéos de formation + Accès au groupe Discord privé + Statut VIP UNE NOUVELLE FAÇON DE REGARDER LE MARCHÉ RelicusRoad est l'indicateur de trading le plus puissant au monde pour le forex, les contrats à terme, les crypto-monnaies, les actions et les indices, offrant aux traders toutes les informations et tous les outils dont ils ont besoin pour rester rentables
Support And Resistance Screener est dans un indicateur de niveau pour MetaTrader qui fournit plusieurs outils à l'intérieur d'un indicateur. Les outils disponibles sont : 1. Filtre de structure de marché. 2. Zone de repli haussier. 3. Zone de recul baissier. 4. Points pivots quotidiens 5. points pivots hebdomadaires 6. Points pivots mensuels 7. Support et résistance forts basés sur le modèle harmonique et le volume. 8. Zones au niveau de la banque. OFFRE D'UNE DURÉE LIMITÉE : L'indicateur de sup
Bill Williams Advanced
Siarhei Vashchylka
5 (9)
Bill Williams Advanced is designed for automatic chart analysis using Bill Williams' "Profitunity" system. The indicator analyzes four timeframes at once. Manual (Be sure to read before purchasing) Advantages 1. Automatically analyzes the chart using the "Profitunity" system of Bill Williams. The found signals are placed in a table in the corner of the screen. 2. Equipped with a trend filter based on the Alligator indicator. Most of the system signals are recommended to be used only according t
Ce tableau de bord affiche les derniers   modèles harmoniques   disponibles pour les symboles sélectionnés, ce qui vous permettra de gagner du temps et d'être plus efficace /   version MT4 . Indicateur gratuit:   Basic Harmonic Pattern Colonnes de l'indicateur Symbol :   les symboles sélectionnés apparaissent Trend   :   haussière ou baissière Pattern :   type de motif (gartley, papillon, chauve-souris, crabe, requin, cypher ou ABCD) Entry:   prix d'entrée SL:   prix du stop loss TP1:   1er
Tout d'abord, il convient de souligner que cet outil de trading est un indicateur non repeint, non redessiné et non retardé, ce qui le rend idéal pour le trading professionnel. Cours en ligne, manuel utilisateur et démonstration. L'indicateur Smart Price Action Concepts est un outil très puissant à la fois pour les nouveaux et les traders expérimentés. Il regroupe plus de 20 indicateurs utiles en un seul, combinant des idées de trading avancées telles que l'analyse du trader Inner Circle et le
Top indicator for MT5   providing accurate signals to enter a trade without repainting! It can be applied to any financial assets:   forex, cryptocurrencies, metals, stocks, indices .  Watch  the video  (6:22) with an example of processing only one signal that paid off the indicator! MT4 version is here It will provide pretty accurate trading signals and tell you when it's best to open a trade and close it. Most traders improve their trading results during the first trading week with the help of
FX Dynamic : Suivez la volatilité et les tendances grâce à une analyse ATR personnalisable Vue d’ensemble FX Dynamic est un outil performant s’appuyant sur les calculs de l’Average True Range (ATR) pour fournir aux traders des informations incomparables sur la volatilité quotidienne et intrajournalière. En définissant des seuils de volatilité clairs — par exemple 80 %, 100 % et 130 % — vous pouvez rapidement repérer des opportunités de profit ou recevoir des avertissements lorsque le marché dé
Gold Stuff mt5
Vasiliy Strukov
4.92 (173)
Gold Stuff mt5 est un indicateur de tendance conçu spécifiquement pour l'or et peut également être utilisé sur n'importe quel instrument financier. L'indicateur ne se redessine pas et ne traîne pas. Délai recommandé H1. Contactez-moi immédiatement après l'achat pour obtenir les réglages et un bonus personnel !   Vous pouvez obtenir une copie gratuite de notre indicateur Strong Support et Trend Scanner, veuillez envoyer un message privé. moi!   RÉGLAGES Dessiner la flèche - on off. dessiner d
Présentation       Quantum Breakout PRO   , l'indicateur révolutionnaire MQL5 qui transforme la façon dont vous négociez les zones d'évasion ! Développé par une équipe de traders expérimentés avec une expérience commerciale de plus de 13 ans,       Évasion quantique PRO       est conçu pour propulser votre parcours commercial vers de nouveaux sommets grâce à sa stratégie de zone de discussion innovante et dynamique. Quantum Breakout Indicator vous donnera des flèches de signalisation sur les z
Black Dragon indicator mt5
Ramil Minniakhmetov
4.83 (58)
L'indicateur de détection de tendance complétera n'importe quelle stratégie et peut également être utilisé comme un outil indépendant. IMPORTANT! Contactez-moi immédiatement après l'achat pour obtenir des instructions et un bonus !   Avantages Facile à utiliser; ne surcharge pas le graphique avec des informations inutiles. La possibilité d'utiliser comme filtre pour n'importe quelle stratégie. Contient des niveaux dynamiques de cupport et de resistange, qui peuvent être utilisés à la fois po
Matrix Arrow Indicator MT5
Juvenille Emperor Limited
5 (13)
Matrix Arrow Indicator MT5   est une tendance unique 10 en 1 suivant un indicateur multi-période   100% non repeint   qui peut être utilisé sur tous les symboles/instruments:   forex ,   matières premières ,   crypto-monnaies ,   indices ,  actions .  Matrix Arrow Indicator MT5  déterminera la tendance actuelle à ses débuts, en rassemblant des informations et des données à partir d'un maximum de 10 indicateurs standard, qui sont: Indice de mouvement directionnel moyen (ADX) Indice de canal de m
Easy Breakout MT5
Mohamed Hassan
5 (3)
After your purchase, feel free to contact me for more details on how to receive a bonus indicator called VFI, which pairs perfectly with Easy Breakout for enhanced confluence!     Easy Breakout MT5   is a powerful price action trading system built on one of the most popular and widely trusted strategies among traders: the   Breakout strategy ! This indicator delivers crystal-clear Buy and Sell signals based on breakouts from key support and resistance zones. Unlike typical breakout indicators
Gartley Hunter Multi
Siarhei Vashchylka
5 (9)
Gartley Hunter Multi - An indicator for searching for harmonic patterns simultaneously on dozens of trading instruments and on all possible timeframes. Manual (Be sure to read before purchasing) | Version for MT4 Advantages 1. Patterns: Gartley, Butterfly, Shark, Crab. Bat, Alternate Bat, Deep Crab, Cypher 2. Simultaneous search for patterns on dozens of trading instruments and on all possible timeframes 3. Search for patterns of all possible sizes. From the smallest to the largest 4. All fou
Royal Scalping Indicator M5
Vahidreza Heidar Gholami
5 (6)
Royal Scalping Indicator is an advanced price adaptive indicator designed to generate high-quality trading signals. Built-in multi-timeframe and multi-currency capabilities make it even more powerful to have configurations based on different symbols and timeframes. This indicator is perfect for scalp trades as well as swing trades. Royal Scalping is not just an indicator, but a trading strategy itself. Features Price Adaptive Trend Detector Algorithm Multi-Timeframe and Multi-Currency Trend Low
Trade smarter, not harder: Empower your trading with Harmonacci Patterns Special Offer: Purchase now to receive free bonuses worth $165! (Read more for details) This is arguably the most complete harmonic price formation auto-recognition indicator you can find for the MetaTrader Platform. It detects 19 different patterns, takes fibonacci projections as seriously as you do, displays the Potential Reversal Zone (PRZ) and finds suitable stop-loss and take-profit levels. [ Installation Guide | Upd
Ce tableau de bord découvre et affiche les zones   d'offre   et de   demande   sur le graphique, à la fois en mode scalping et à long terme, en fonction de votre stratégie de trading pour les symboles sélectionnés. En outre, le mode scanner du tableau de bord vous permet de vérifier tous les symboles souhaités en un coup d'œil et de ne manquer aucune position appropriée /   Version MT4 Indicateur gratuit:   Basic Supply Demand Caractéristiques Permet de visualiser les opportunités de tradin
QM Pattern Scanner MT5
Reza Aghajanpour
5 (4)
Contact me  to send you instruction and add you in group. QM (Quasimodo) Pattern is based on Read The Market(RTM) concepts. The purpose of this model is to face the big players of the market (financial institutions and banks), As you know in financial markets, big traders try to fool small traders, but RTM prevent traders from getting trapped. This style is formed in terms of price candles and presented according to market supply and demand areas and no price oscillator is used in it. RTM conc
Auto Order Block with break of structure based on ICT and Smart Money Concepts (SMC) Futures Break of Structure ( BoS )             Order block ( OB )            Higher time frame Order block / Point of Interest ( POI )    shown on current chart           Fair value Gap ( FVG ) / Imbalance   -  MTF      ( Multi Time Frame )    HH/LL/HL/LH  -  MTF      ( Multi Time Frame )  Choch  MTF      ( Multi Time Frame )  Volume Imbalance     ,  MTF          vIMB Gap’s Power of 3 Equal High / Low’s  
Volumatic VIDyA MT5
Duc Hoan Nguyen
5 (1)
Special offer : ALL TOOLS , just $35 each! New tools   will be   $30   for the   first week   or the   first 3 purchases !  Trading Tools Channel on MQL5 : Join my MQL5 channel to update the latest news from me Volumatic VIDYA (Variable Index Dynamic Average) est un indicateur avancé conçu pour suivre les tendances et analyser la pression d'achat et de vente à chaque phase d'une tendance. En utilisant la Moyenne Dynamique à Indice Variable (Variable Index Dynamic Average) comme technique centra
Dark Absolute Trend   is an Indicator for intraday trading. This Indicator is based on   Trend Following  strategy but use also candlestick patterns and Volatility. We can enter in good price with this Indicator, in order to follow the main trend on the current instrument. It is advised to use low spread ECN brokers. This Indicator does   Not repaint   and   N ot lag . Recommended timeframes are M5, M15 and H1. Recommended working pairs: All. I nstallation and  Update Guide   -  Troubleshooting
CONTACT US  after purchase to get the Indicator Manual. Try Now—Limited 50% Discount for First 10 Buyers! Download the  Metatrader 4 Version Due to regulatory restrictions, our service is unavailable in certain countries such as India, Pakistan, and Bangladesh. William Delbert Gann (W.D. Gann) was an exceptional market analyst, whose trading technique was based on a complex blend of mathematics, geometry, astrology, and ancient mathematics which proved to be extremely accurate. A Note from t
Plus de l'auteur
Gm TrendSignal
Antonio Augusto Barreto De Melo
4.5 (4)
We often need to know the sudden change in trend that happens on the graph and this can be confirmed through indicators. This indicator shows the moments of trend reversal and how in which trend the price is shifting. Custom background, no need to configure the colors in the chart, just drag the indicator! Indication with arrows. - Blue arrow: Upward trend. - Pink Arrow: Downward Trend. NOTE: Free indicator, support may take a while to respond.
FREE
Gm Vwap Point
Antonio Augusto Barreto De Melo
VWAP is an intraday calculation used primarily by algorithms and institutional traders to assess where a stock is trading in relation to its weighted average volume for the day. Day traders also use VWAP to assess market direction and filter out trading signals. This indicator is used to analyze and calculate the Vwap from a certain point on the graph, which is widely used to analyze the beginning of a movement of the price relationship with the volume. - Multi Vwaps on the same chart, placed
We often look for support and resistance points on the chart. One of the techniques that can be used is through the quantity of lots offered in the order book. This indicator searches for the largest lots in the order book and draws them on the graph in the form of lines, thereby obtaining where is the greatest concentration of lots offered on the centralized stock market at that time, thus configuring possible support and resistance lines. - The number of lines to draw can be defined by the u
Gm Aggressive Volume
Antonio Augusto Barreto De Melo
5 (1)
Volume is a resource used by analysts of various methodologies, precisely because it shows the confirmation of movements and the market's progress. It is an indicator that analyzes the financial quantity that was traded during a certain period. This indicator analyzes the amount of volume for each candle, when there is an excessive increase in this, it differs from the others by a colored bar. In addition to informing in the form of colored bars, this indicator allows you to emit an audible w
Filtrer:
KATTY2010
196
KATTY2010 2022.07.12 02:51 
 

bien

Bernardo Carvalho
683
Bernardo Carvalho 2022.01.24 10:00 
 

L'utilisateur n'a laissé aucun commentaire sur la note

Gena2905
14
Gena2905 2021.10.23 13:38 
 

Индикатор шикарный! Но, окрашивает сам цветовую схему в черный и включает линии bid, ask! Если-бы это убрать, было-бы круто!

Erison Francisco De Sales
1014
Erison Francisco De Sales 2021.06.22 20:54 
 

It's a good indicator, but we can't save our changed colors preferences.

Aleksandr Tamonin
4107
Aleksandr Tamonin 2021.01.23 16:20 
 

L'utilisateur n'a laissé aucun commentaire sur la note

Répondre à l'avis