• Aperçu
  • Avis (24)
  • Commentaires (63)
  • Nouveautés

Support and Resistance Screener Pro MT5

4.75

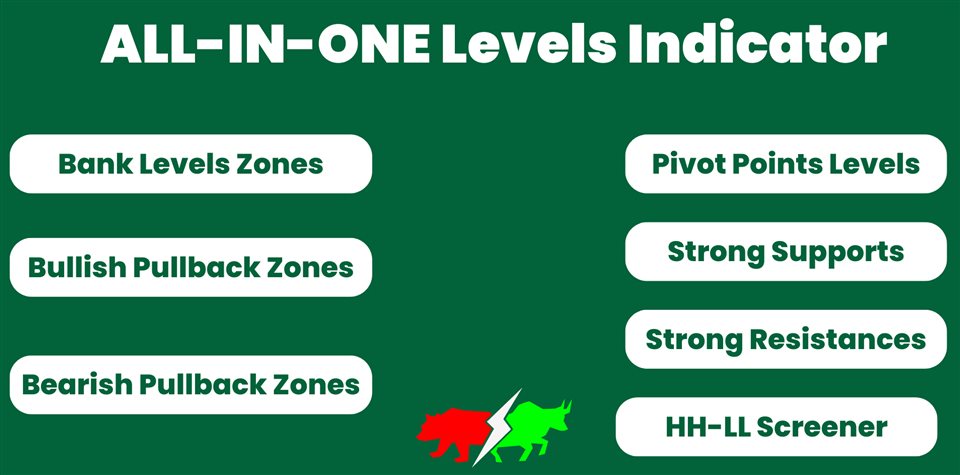
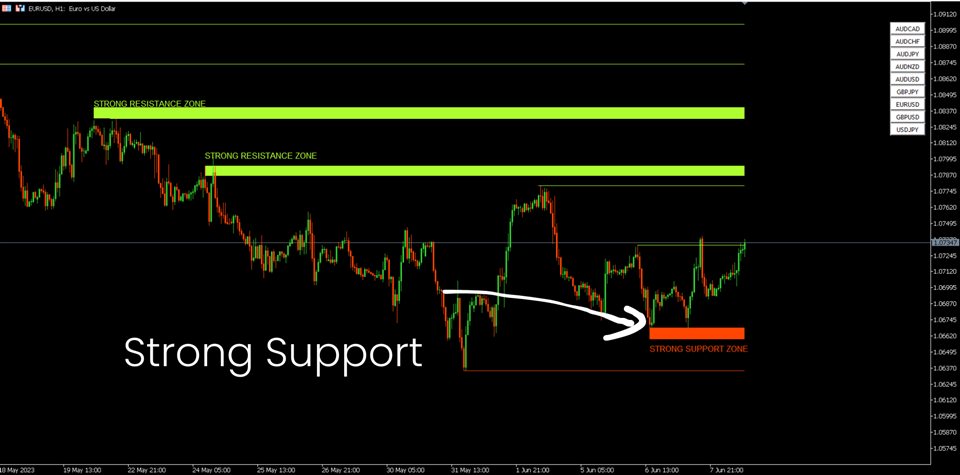
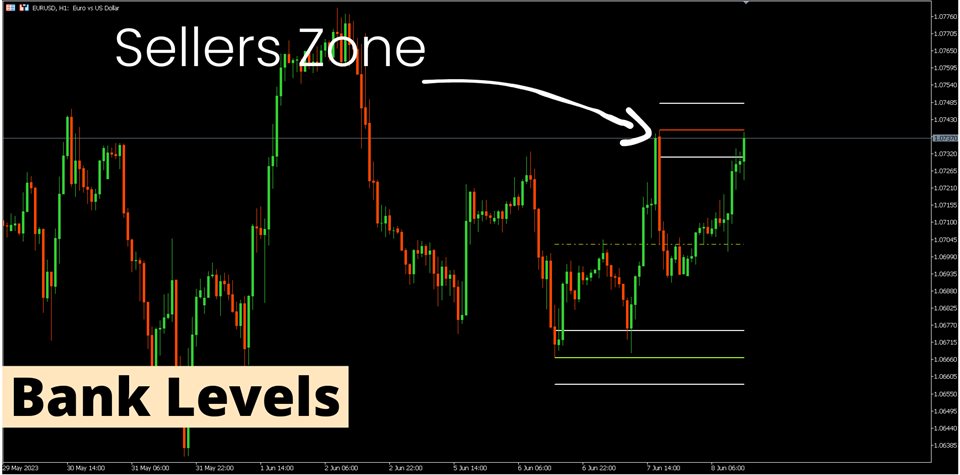
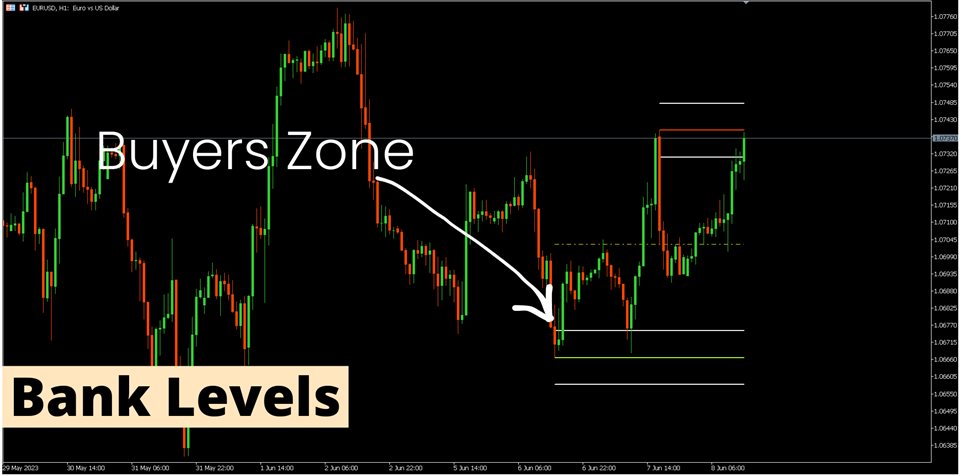
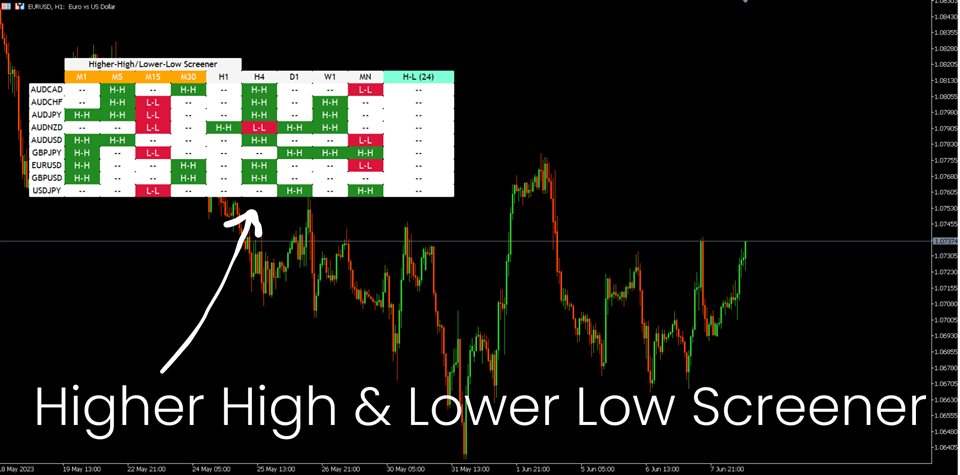
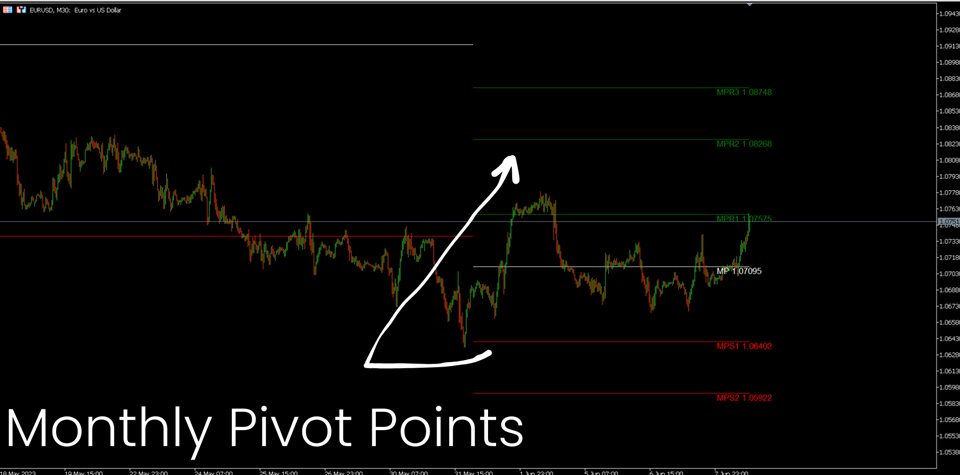
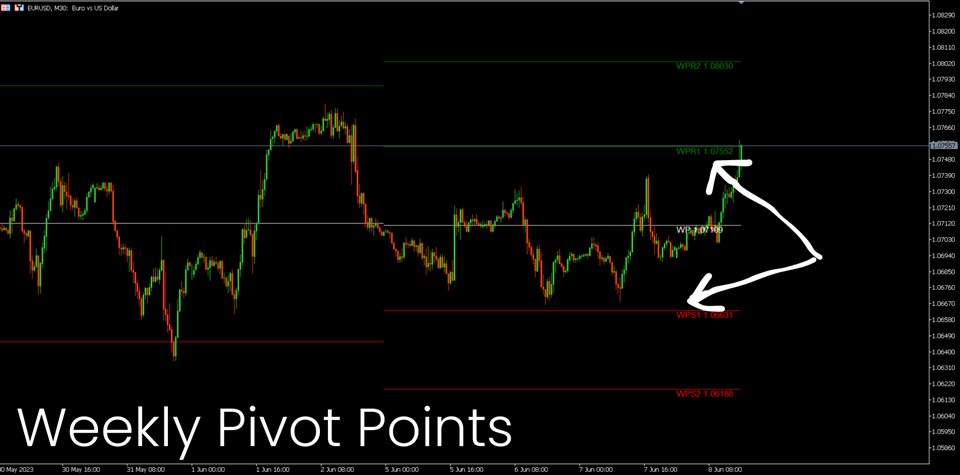
Support And Resistance Screener est dans un indicateur de niveau pour MetaTrader qui fournit plusieurs outils à l'intérieur d'un indicateur. Les outils disponibles sont :

1. Filtre de structure de marché.

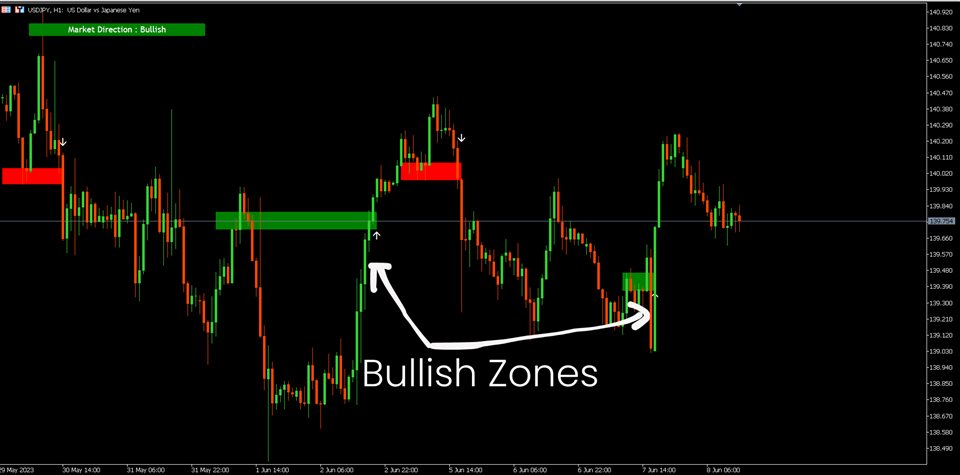
2. Zone de repli haussier.

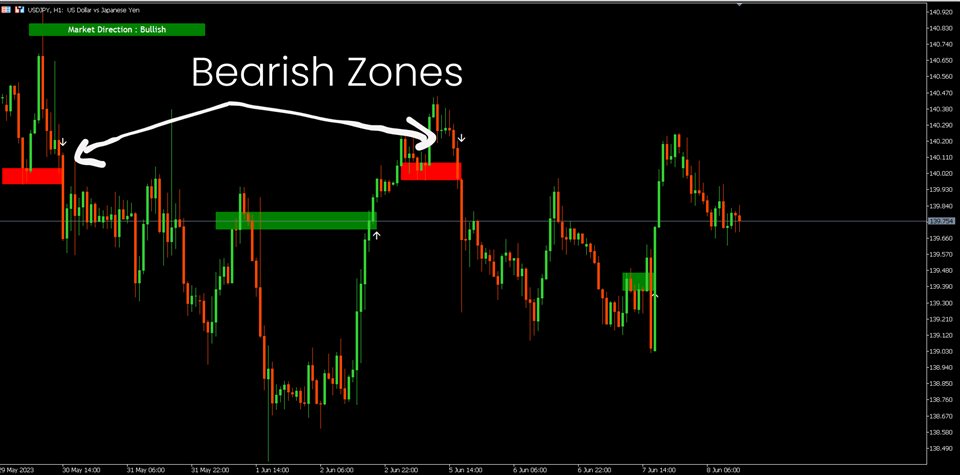
3. Zone de recul baissier.

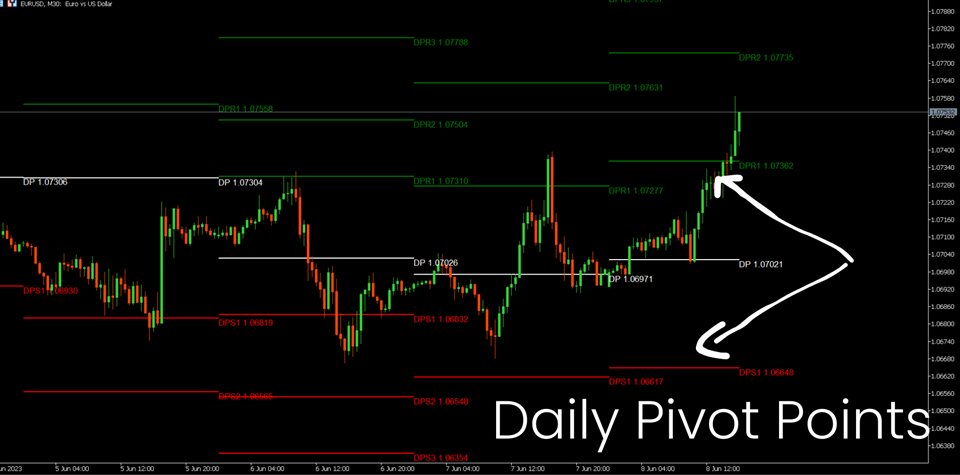
4. Points pivots quotidiens

5. points pivots hebdomadaires

6. Points pivots mensuels

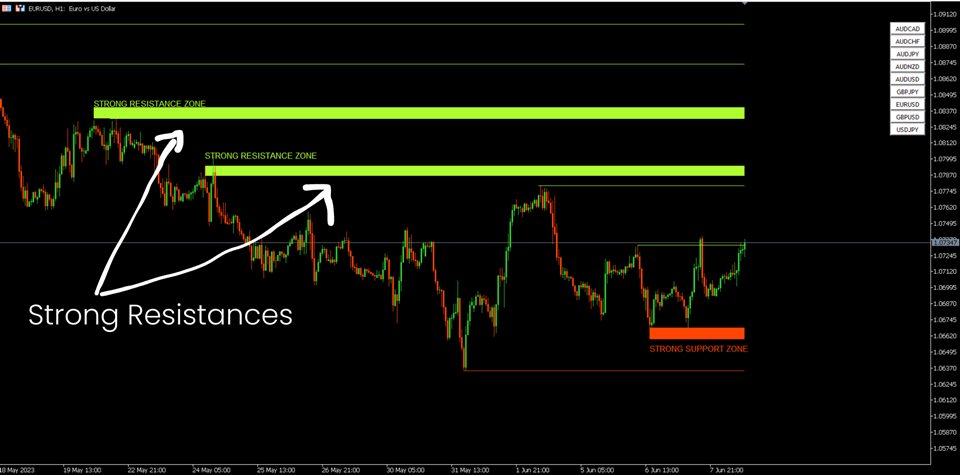
7. Support et résistance forts basés sur le modèle harmonique et le volume.

8. Zones au niveau de la banque.

OFFRE D'UNE DURÉE LIMITÉE : L'indicateur de support et de résistance HV est disponible pour seulement 50 $ et à vie. ( Prix d'origine 125$ )
En accédant à notre Blog MQL5, vous pouvez retrouver tous nos indicateurs premium avec des exemples d'analyse : Cliquez Ici


Principales caractéristiques

  • Zones de support et de résistance fortes basées sur les algorithmes d'harmonique et de volume.
  • Zones de retraits haussiers et baissiers basées sur des algorithmes harmoniques et de volume.
  • Analyseur de structure de marché
  • Points Pivots quotidiens, hebdomadaires et mensuels.


Documentation

Toutes les documentations de Support et Resistance Screener ( Instructions ) et les détails de la stratégie sont disponibles dans cet article de notre Blog MQL5 : Cliquez ici.


Contact

Si vous avez des questions ou si vous avez besoin d'aide, contactez-moi par Message Privé.


Auteur

SAYADI ACHREF , ingénieur logiciel fintech et fondateur de Finansya
Avis 24
USD Down
59
USD Down 2024.12.04 13:19 
 

this tool is very important to calculate the risk and using the lot calculator, you can get a good combination of support and resistance level in addition to calculating the risk, the cost is nothing compared to the advantage of having such as a tool in hands, the costumer service is very comprehensive and answerring the questions in clear and precise manner, i recommand this tool for all traders with the lot and size calculator you will never be in hasardous situation due to non calculated open positions .

Nice Trader OÜ
2270
Aller Uja 2024.12.01 17:53 
 

a good tool if you learn to use it

Clinton Van
118
Clinton Van 2024.09.25 15:43 
 

I love both indicators Trend screener Pro and Support and Resistance Screener Pro but you can't use them blindly. You need to understand market structure. I always try to trade a strong currency versus a weaker one. I then trade with the trend after price makes corrections. The Support and resistance indicator helps see how close price is from support or resistance. On uptrend I buy at support levels and downtrend I buy at resistance levels of price corrections. Together these indicators is all you need to make informed decisions. I do my analysis on the 1H time Frame and then I enter my trades using the 1min or 5min time frames. Thanks for these indicators. They really safe me allot of time.

Produits recommandés
Laguerre SuperTrend Clouds   adds an Adaptive Laguerre averaging algorithm and alerts to the widely popular SuperTrend indicator. As the name suggests,   Laguerre SuperTrend Clouds (LSC)   is a trending indicator which works best in trendy (not choppy) markets. The SuperTrend is an extremely popular indicator for intraday and daily trading, and can be used on any timeframe. Incorporating Laguerre's equation to this can facilitate more robust trend detection and smoother filters. The LSC uses the
Noize Absorption Index - is the manual trading system that measures the difference of pressure between bears forces and bulls forces. Green line - is a noize free index that showing curent situation. Zero value of index shows totally choppy/flat market.Values above zero level shows how powerfull bullish wave is and values below zero measures bearish forces.Up arrow appears on bearish market when it's ready to reverse, dn arrow appears on weak bullish market, as a result of reverse expectation.
An indicator of pattern #31 ("Long Island") from Encyclopedia of Chart Patterns by Thomas N. Bulkowski. The second gap is in the opposite direction. Parameters: Alerts - show alert when an arrow appears   Push - send a push notification when an arrow appears (requires configuration in the terminal) GapSize - minimum gap size in points ArrowType - a symbol from 1 to 17 ArrowVShift - vertical shift of arrows in points   ShowLevels - show levels ColUp - color of an upward line ColDn - color of a
Trading Utility for Forex Currency Pairs Only not for Gold  Functions Auto Lot Calculation based on Risk Auto stoploss  Auto TakeProfit Breakeven Auto Close Half % Close in percentage with respect to the PIPs Pending Orders BuyLimit Sell Limit with distances BuyStop Sell Stop    with distances Trading Informations Risk in percentage For Multiple trades Combine Takeprofit and Combine Stoplosses
[ MT4 Version ] Supply and Demand Multitimeframe Supply and Demand Multitimeframe is the first indicator in the market that combines multiple aspects like trading volume, price structure and momentum to identify Supply and Demand zones for every asset. The Supply and Demand indicator analyzes simultaneously up to 4 different TFs and represents their information in the current graph. Its interactive UI highlights everytime the price enters a Supply or Demand zone even if the zones are not visible
US30NinjaMT5
Satyaseelan Shankarananda Moodley
US30 Ninja is a 5 minute scalping indicator that will let know you when there is a trade set up (buy or sell). Once the indicator gives the trade direction, you can open a trade and use a 30 pip stop loss and a 30 pip to 50 pip take profit. Please trade at own own risk. This indicator has been created solely for the US30 market and may not yield positive results on any other pair. 
Volality Index Scalper
Lesedi Oliver Seilane
5 (1)
Volality Index scalper indicator  Meant for Volality pairs such as Volality 10, 25, 50, 75 and 100 The indicator works on all timeframes from the 1 minute to the monthly timeframe the indicator is non repaint the indicator has 3 entry settings 1 color change on zero cross 2 color change on slope change 3 color change on signal line cross Orange line is your sell signal Blue line is your buy signal.
Welcome to the Ultimate Harmonic Patterns recognition indicator that is focused to detect advanced patterns. The Gartley pattern, Bat pattern, and Cypher pattern  are popular technical analysis tools used by traders to identify potential reversal points in the market. Our Ultimate Harmonic Patterns recognition Indicator is a powerful tool that uses advanced algorithms to scan the markets and identify these patterns in real-time. With our Ultimate Harmonic Patterns recognition Indicator, you
Owl Smart Levels MT5
Sergey Ermolov
4.07 (28)
Version MT4   |  FAQ L' indicateur Owl Smart Levels est un système de trading complet au sein d'un seul indicateur qui comprend des outils d'analyse de marché populaires tels que les fractales avancées de Bill Williams , Valable ZigZag qui construit la structure d'onde correcte du marché et les niveaux de Fibonacci qui marquent les niveaux exacts d'entrée. sur le marché et les endroits où prendre des bénéfices. Description détaillée de la stratégie Mode d'emploi de l'indicateur Conseiller-Assis
You can change the time period of the chart at the touch of a button. You can also change multiple charts at the touch of a button. You can also change multiple charts at the touch of a button,   saving you the trouble of changing time periods. We are live-streaming the actual operation of the system. Please check for yourself if it is usable. Please check it out for yourself. https://www.youtube.com/@ganesha_forex We do not guarantee your investment results. Investments should be made at y
Advanced Trading Chaos  The main purpose of the indicator is to help the trader detect the signals described by Bill Williams in his books to make a quick and correct trading decision. 1)Bullish/Bearish Reversal Bar(BDB) 2) Divergent Bar(DB) 3) Second Sage Signal — the third consecutive Awesome Oscillator bar  4) Working fractals (Fractals that worked above/below the red forehead  5) Three bar coloring modes  5.1) Coloring of bars according to the AO indicator (Including the squatting bar)  5.
PZ Chart Overlay MT5
PZ TRADING SLU
4 (1)
Master the market: harness the power of statistical arbitrage This indicator showcases the price action of multiple instruments on a single chart, enabling you to compare the fluctuations of different assets and seamlessly implement statistical arbitrage strategies. Its main usage is to find correlated symbols which are temporarily out of whack. [ Installation Guide | Update Guide | Troubleshooting | FAQ | All Products ] Find overbought or oversold currency pairs easily Plot up to six curre
Notre indicateur   Basic Support and Resistance   est la solution dont vous avez besoin pour augmenter votre analyse technique.Cet indicateur vous permet de projeter les niveaux de support et de résistance sur le graphique /   Version MT4 Caractéristiques Intégration des niveaux de Fibonacci: avec la possibilité d'afficher les niveaux de Fibonacci aux côtés des niveaux de support et de résistance, notre indicateur vous donne un aperçu encore plus profond du comportement du marché et des zone
Le niveau Premium est un indicateur unique avec une précision de plus de 80 % des prédictions correctes ! Cet indicateur a été testé par les meilleurs Trading Specialists depuis plus de deux mois ! L'indicateur de l'auteur que vous ne trouverez nulle part ailleurs ! À partir des captures d'écran, vous pouvez constater par vous-même la précision de cet outil ! 1 est idéal pour le trading d'options binaires avec un délai d'expiration de 1 bougie. 2 fonctionne sur toutes les paires de de
HMA Trend Professional MT5
Pavel Zamoshnikov
4.25 (4)
Improved version of the free HMA Trend indicator (for MetaTrader 4) with statistical analysis. HMA Trend is a trend indicator based on the Hull Moving Average (HMA) with two periods. HMA with a slow period identifies the trend, while HMA with a fast period determines the short-term movements and signals in the trend direction. The main differences from the free version: Ability to predict the probability of a trend reversal using analysis of history data. Plotting statistical charts for analyz
An indicator of pattern #30 ("Island Reversal") from Encyclopedia of Chart Patterns by Thomas N. Bulkowski (two gaps, the second gap is in the direction of the first one). Parameters: Alerts - show alert when an arrow appears   Push - send a push notification when an arrow appears (requires configuration in the terminal) GapSize - minimum gap size in points ArrowType - a symbol from 1 to 17 ArrowVShift - vertical shift of arrows in pixels ShowLevels - show levels ColUp - color of an upward line
The   Supply and Demand Zones indicator   is one of the best tools we have ever made. This great tool automatically draws supply and demand zones, the best places for opening and closing positions. It has many advanced features such as multi timeframe zones support, displaying the width of zones, alert notifications for retouched zones, and much more. Because of market fractality, this indicator can be used for any kind of trading. Whether you are a positional, swing, or intraday trader does no
This indicator studies price action as an aggregation of price and time vectors, and uses the average vector to determine the direction and strength of the market. This indicator highlights the short-term directionality and strength of the market, and can be used to capitalize from short-term price movements by trading breakouts or binary options   [ Installation Guide | Update Guide | Troubleshooting | FAQ | All Products ] Find market direction easily Confirm with breakouts or other indicators
Fibo Channels
Jeffrey Quiatchon
Fibo Daily Channel Indicator The  Indicator is a powerful tool for traders, providing precise daily support and resistance levels based on Fibonacci retracement and extension calculations. This indicator automatically draws key pivot points (PP, R1, R2, S1, S2) as well as additional extension levels (R3, R4, S3, S4), helping traders identify potential reversal and breakout zones with ease. It includes customizable alerts and push notifications, allowing traders to receive updates whenever the pr
Pipfinite creates unique, high quality and affordable trading tools. Our tools may or may not work for you, so we strongly suggest to try the Demo Version for MT4 first. Please test the indicator prior to purchasing to determine if it works for you. We want your good reviews, so hurry up and test it for free...we hope you will find it useful. Combo Energy Beam with Swing Control Strategy: Confirm swing pullback signals Watch Video: (Click Here) Energy Beam with Trend Laser Strategy: Confirm Tr
Swing Points
Usiola Oluwadamilol Olagundoye
Swing Points Indicator for MetaTrader 5 The **Swing Points Indicator** is a custom-built technical tool designed for MetaTrader 5 (MT5), primarily used for identifying crucial reversal points in price action. By plotting swing highs and swing lows, it highlights potential trend reversals, making it a valuable tool for traders relying on price action analysis. This indicator helps traders anticipate changes in market direction by visually marking significant turning points on the chart. Main
Magic sl NASDAQ 100
Benyamin Naser Mokhtari Karchegani
The indicator now at your disposal is undoubtedly one of the best tools for trading in the NASDAQ 100 market, especially in the 1-minute and 5-minute timeframes. This indicator is meticulously designed for high precision and can be adjusted for other timeframes as well. Simply run it and receive good exit signals. Key Features: Specialized performance in the 1-minute and 5-minute timeframes: While this indicator works in other timeframes as well, its primary focus is on these two timeframes. Co
Ultimate Supply Demand MT5
Ramon Sobrevals Arce
5 (4)
After working during many months, with the help of Neural Networks, we have perfected the ultimate tool you are going to need for identifying key price levels (Supports and Resistances) and Supply and Demand zones. Perfectly suitable to trigger your trades, set up your future actions, decide your Take Profit and Stop Loss levels, and confirm the market direction. Price will always move between those levels, bouncing or breaking; from one zone to another, all the remaining movements are just mark
L'indicateur Boom and Crash Spike Detector est codé sur la base d'une stratégie avancée principalement pour détecter le Boom and Crash dans les prix. Des algorithmes complexes ont été implantés pour détecter les booms et les crashs à haute probabilité dans les prix. Il alerte sur d'éventuelles phases de Boom ou crash : Phase de Boom : Lorsque le prix augmente trop vite. Crash Phase : Lorsque le prix baisse trop vite. OFFRE À DURÉE LIMITÉE : L'indicateur est disponible pour seulement 30$ et à
Awesome Oscillator by Bill Williams with the ability to fine-tune and replace the averaging algorithms of the indicator, which significantly expands the possibilities of using this oscillator in algorithmic trading and brings it closer in its properties to such an indicator as the MACD. To reduce price noise, the final indicator is processed with an additional Smooth averaging. The indicator has the ability to give alerts, send mail messages and push signals when the direction of movement of th
Il s'agit d'un indicateur MTF des niveaux de support et de résistance basé sur les   extremums de l'indicateur Advanced ZigZag Dynamic   et/ou   Extended Fractals   avec des étiquettes de prix (peut être désactivé). Des TF plus élevés peuvent être sélectionnés pour le mode MTF. Par défaut, les niveaux sont générés en fonction des points indicateurs ZigZag. Les points indicateurs de fractales peuvent également être utilisés avec ZigZag ou à sa place. Afin de simplifier l'utilisation et d'économis
Snipeer2
Ignacio Agustin Mene Franco
Sniper2 , It has points of lines, with colors that are showing you an entrance, that work as support and resistance! green dotted lines green shows entry for sale, the red dotted lines show a buy entry, pay attention to the supports that work as a break to catch long candles in a longer period of time. works for forex all pairs works for synthetic indices all pairs ! indicator on sale!
An indicator of patterns #24, #25, #26 and #27 ("Head and Shoulders", "Complex Head and Shoulders") from Encyclopedia of Chart Patterns by Thomas N. Bulkowski. Parameters: Alerts - show alert when an arrow appears   Push - send a push notification when an arrow appears (requires configuration in the terminal) PeriodBars - indicator period K - an additional parameter that influences the accuracy of pattern shape recognition. The smaller the value is, the smoother the row of peaks/valleys shoul
Stratos Pali mt5
Michela Russo
5 (4)
Stratos Pali Indicator is a revolutionary tool designed to enhance your trading strategy by accurately identifying market trends. This sophisticated indicator uses a unique algorithm to generate a complete histogram, which records when the trend is Long or Short. When a trend reversal occurs, an arrow appears, indicating the new direction of the trend. Important Information Revealed Leave a review and contact me via mql5 message to receive My Top 5 set files for Stratos Pali at no cost ! Do
All Harmonics 26
Alexey Isavnin
3.5 (4)
Harmonic patterns are characteristic series of price movements with respect to Fibonacci levels, which statistically precede price reversals. This indicator searches for harmonic patterns. It is capable of recognising 26 classical and non-classical harmonic patterns : Classical Gartley Butterfly Alternate Butterfly Bat Alternate Bat Crab Deep Crab Three Drives Non-classical Shark Alternate Shark Cypher 5-0 Anti Gartley Anti Butterfly Anti Alternate Butterfly Anti Bat Anti Alternate Bat Anti Crab
Les acheteurs de ce produit ont également acheté
TPSproTREND PrO MT5
Roman Podpora
4.54 (13)
TPSpro TREND PRO  - is a trend indicator that automatically analyzes the market and provides information about the trend and each of its changes, as well as giving signals for entering trades without redrawing! The indicator uses each candle, analyzing them separately. referring to different impulses - up or down impulse. Exact entry points into transactions for currencies, crypto, metals, stocks, indices!  INSTRUCTIONS     RUS   -    ENG              R ecommended to use with an indicator   - 
TPSpro RFI Levels MT5
Roman Podpora
4.67 (15)
INSTRUCTIONS       RUS   -   ANGLAIS       Il   est recommandé de l'utiliser avec un indicateur       -       TPSpro   TENDANCE PRO -   Version MT4         Un élément clé du trading est constitué par les zones ou les niveaux à partir desquels les décisions d'achat ou de vente d'un instrument de trading sont prises. Malgré les tentatives des principaux acteurs de dissimuler leur présence sur le marché, ils laissent inévitablement des traces. Notre tâche était d'apprendre à identifier ces traces
Maintenant 147 $ (augmentant à 499 $ après quelques mises à jour) - Comptes illimités (PCS ou Mac) Manuel d'utilisation RelicusRoad + Vidéos de formation + Accès au groupe Discord privé + Statut VIP UNE NOUVELLE FAÇON DE REGARDER LE MARCHÉ RelicusRoad est l'indicateur de trading le plus puissant au monde pour le forex, les contrats à terme, les crypto-monnaies, les actions et les indices, offrant aux traders toutes les informations et tous les outils dont ils ont besoin pour rester renta
Ce tableau de bord affiche les derniers   modèles harmoniques   disponibles pour les symboles sélectionnés, ce qui vous permettra de gagner du temps et d'être plus efficace /   version MT4 . Indicateur gratuit:   Basic Harmonic Pattern Colonnes de l'indicateur Symbol :   les symboles sélectionnés apparaissent Trend   :   haussière ou baissière Pattern :   type de motif (gartley, papillon, chauve-souris, crabe, requin, cypher ou ABCD) Entry:   prix d'entrée SL:   prix du stop loss TP1:   1
Golden Trend Indicator MT5
Noha Mohamed Fathy Younes Badr
4.8 (10)
Golden Trend indicator  is The best indicator for predicting trend movement this indicator never lags and never repaints and never back paints    and give  arrow buy and sell    before the candle appear  and it will help you and  will make your trading decisions clearer its work on all currencies and  gold and crypto and all time frame This unique  indicator uses very secret algorithms to catch the  trends, so you can trade using this indicator and see the trend clear on charts  manual guide and
FX Power MT5 NG
Daniel Stein
5 (7)
Déverrouillez toute la puissance de FX Power NG : l'ultime mesureur de force des devises Depuis plus de huit ans, FX Power permet aux traders du monde entier de bénéficier d'une analyse fiable et précise de la force des devises. Aujourd'hui, FX Power NG fait passer cet outil de confiance au niveau supérieur, en offrant des fonctionnalités avancées qui apportent une précision, une personnalisation et des informations inégalées à votre trading. Qu'est-ce qui fait de FX Power NG un outil indisp
Atomic Analyst MT5
Issam Kassas
4.32 (19)
Tout d'abord, il convient de souligner que cet indicateur de trading n'est ni repainting, ni redrawing et ne présente aucun délai, ce qui le rend idéal à la fois pour le trading manuel et automatisé. Manuel de l'utilisateur : réglages, entrées et stratégie. L'Analyste Atomique est un indicateur d'action sur les prix PA qui utilise la force et le momentum du prix pour trouver un meilleur avantage sur le marché. Équipé de filtres avancés qui aident à éliminer les bruits et les faux signaux, et à
FX Volume MT5
Daniel Stein
4.93 (14)
Obtenez un véritable avantage sur le Forex avec FX Volume : L'indicateur de volume ultime FX Volume est le premier et le seul indicateur de volume à révéler le véritable sentiment du marché d'un point de vue d'initié. En fournissant des informations uniques sur la façon dont les acteurs institutionnels du marché et les courtiers sont positionnés, FX Volume vous permet de négocier avec la prévoyance habituellement réservée aux acteurs majeurs. Dites adieu aux délais des rapports COT - FX Volume
Quantum TrendPulse
Bogdan Ion Puscasu
5 (4)
Présentation de   Quantum TrendPulse   , l'outil de trading ultime qui combine la puissance de   SuperTrend   ,   RSI   et   Stochastic   dans un seul indicateur complet pour maximiser votre potentiel de trading. Conçu pour les traders qui recherchent précision et efficacité, cet indicateur vous aide à identifier les tendances du marché, les changements de dynamique et les points d'entrée et de sortie optimaux en toute confiance. Caractéristiques principales : Intégration SuperTrend :   suivez f
Tout d'abord, il convient de souligner que ce système de trading est un indicateur non repeint, non redessiné et non retardé, ce qui le rend idéal pour le trading manuel et automatisé. Cours en ligne, manuel et téléchargement de préréglages. Le "Système de Trading Smart Trend MT5" est une solution de trading complète conçue pour les traders débutants et expérimentés. Il combine plus de 10 indicateurs premium et propose plus de 7 stratégies de trading robustes, ce qui en fait un choix polyvalent
TPA True Price Action indicator reveals the true price action of the market makers through 100% non-repainting signals strictly at the close of a candle! TPA shows entries and re-entries, every time the bulls are definitely stronger than the bears and vice versa. Not to confuse with red/green candles. The shift of power gets confirmed at the earliest stage and is ONE exit strategy of several. There are available now two free parts of the TPA User Guide for our customers. The first "The Basics"
Découvrez les niveaux de change : Votre indicateur ultime de support et de résistance pour réussir dans le trading FX Levels est plus qu'un simple indicateur de support et de résistance ; il change la donne pour les traders sérieux qui recherchent la précision, la fiabilité et une fonctionnalité transparente sur tous les symboles de trading, qu'il s'agisse de paires de devises, d'indices, d'actions ou de matières premières. Basé sur la méthode éprouvée Lighthouse et amélioré par une adaptabili
Trend Forecaster
Alexey Minkov
5 (6)
!!!CHRISTMAS SALE!!! The Trend Forecaster indicator utilizes a unique proprietary algorithm to determine entry points for a breakout trading strategy. The indicator identifies price clusters, analyzes price movement near levels, and provides a signal when the price breaks through a level. The Trend Forecaster indicator is suitable for all financial assets, including currencies (Forex), metals, stocks, indices, and cryptocurrencies. You can also adjust the indicator to work on any time frames, al
FX Dynamic - Le seul indicateur ATR dont vous aurez besoin Prêt à booster vos stratégies de trading avec une précision et une perspicacité inégalées ? Voici FX Dynamic , le premier et le seul indicateur ATR conçu pour l' analyse des devises et l' ajustement automatique aux changements d'heure GMT des courtiers. Dites adieu aux outils dépassés et adoptez la solution ultime pour maîtriser la volatilité des marchés. Pourquoi FX Dynamic change la donne Analyse ATR basée sur les devises - Libére
Présentation       Quantum Breakout PRO   , l'indicateur révolutionnaire MQL5 qui transforme la façon dont vous négociez les zones d'évasion ! Développé par une équipe de traders expérimentés avec une expérience commerciale de plus de 13 ans,       Évasion quantique PRO       est conçu pour propulser votre parcours commercial vers de nouveaux sommets grâce à sa stratégie de zone de discussion innovante et dynamique. Quantum Breakout Indicator vous donnera des flèches de signalisation sur le
IX Power MT5
Daniel Stein
4.17 (6)
Voici IX Power - l'outil ultime pour décupler la précision de vos transactions ! Conçu avec la même précision imbattable que FX Power, IX Power vous permet de maîtriser n'importe quel symbole de trading, des indices et des actions aux matières premières, aux ETF et même aux crypto-monnaies. Préparez-vous à élever votre trading grâce à des informations précises sur les tendances à court, moyen et long terme de tous vos actifs préférés. Pourquoi choisir IX Power ? Avec IX Power, votre timing de
Atbot
Zaha Feiz
4.75 (44)
AtBot : Comment ça fonctionne et comment l'utiliser ### Comment ça fonctionne L'indicateur "AtBot" pour la plateforme MT5 génère des signaux d'achat et de vente en utilisant une combinaison d'outils d'analyse technique. Il intègre la Moyenne Mobile Simple (SMA), la Moyenne Mobile Exponentielle (EMA) et l'indice de la Plage Vraie Moyenne (ATR) pour identifier les opportunités de trading. De plus, il peut utiliser des bougies Heikin Ashi pour améliorer la précision des signaux. Laissez un avis ap
Top indicator for MT5   providing accurate signals to enter a trade without repainting! It can be applied to any financial assets:   forex, cryptocurrencies, metals, stocks, indices .  Watch  the video  (6:22) with an example of processing only one signal that paid off the indicator! MT4 version is here It will provide pretty accurate trading signals and tell you when it's best to open a trade and close it. Most traders improve their trading results during the first trading week with the help of
Matrix Arrow Indicator MT5
Juvenille Emperor Limited
5 (13)
Matrix Arrow Indicator MT5   est une tendance unique 10 en 1 suivant un indicateur multi-période   100% non repeint   qui peut être utilisé sur tous les symboles/instruments:   forex ,   matières premières ,   crypto-monnaies ,   indices ,  actions .  Matrix Arrow Indicator MT5  déterminera la tendance actuelle à ses débuts, en rassemblant des informations et des données à partir d'un maximum de 10 indicateurs standard, qui sont: Indice de mouvement directionnel moyen (ADX) Indice de canal de m
Ce tableau de bord découvre et affiche les zones   d'offre   et de   demande   sur le graphique, à la fois en mode scalping et à long terme, en fonction de votre stratégie de trading pour les symboles sélectionnés. En outre, le mode scanner du tableau de bord vous permet de vérifier tous les symboles souhaités en un coup d'œil et de ne manquer aucune position appropriée /   Version MT4 Indicateur gratuit:   Basic Supply Demand Caractéristiques Permet de visualiser les opportunités de tr
MetaForecast M5
Vahidreza Heidar Gholami
5 (2)
MetaForecast prédit et visualise l'avenir de n'importe quel marché en se basant sur les harmoniques des données de prix. Bien que le marché ne soit pas toujours prévisible, s'il y a un motif dans les prix, MetaForecast peut prédire l'avenir aussi précisément que possible. Comparé à d'autres produits similaires, MetaForecast peut générer des résultats plus précis en analysant les tendances du marché. Paramètres d'entrée Past size (Taille passée) Spécifie le nombre de barres que MetaForecast uti
CBT Quantum Maverick Système de Trading Binaire Haute Efficacité CBT Quantum Maverick est un système de trading binaire hautement performant, conçu pour les traders recherchant précision, simplicité et discipline. Aucune personnalisation n'est nécessaire : ce système est optimisé pour des résultats efficaces dès son installation. Avec un peu de pratique, il est facile de maîtriser les signaux. Caractéristiques principales : Précision des signaux : Signaux basés sur la bougie actuelle, ciblan
AT Forex Indicator MT5
Marzena Maria Szmit
5 (5)
The AT Forex Indicator MT5 is a sophisticated trading tool designed to provide traders with a comprehensive analysis of multiple currency pairs. This powerful indicator simplifies the complex nature of the forex market, making it accessible for both novice and experienced traders. AT Forex Indicator uses advanced algorithms to detect trends, patterns and is an essential tool for traders aiming to enhance their forex trading performance. With its robust features, ease of use, and reliable signal
Place price Alerts   on  extended  Rectangles   and   Trendlines -  Risk reward indicator mt5 Extend Rectangles & Trendlines to the right edge Mark your supply demand zones with extended rectangle and draw support resistance lines with extended trendline. Find detailed manuals   here .  Find contacts on my   profile . MT4 Rectangle extender indicator will simplify and make it easier for you to analyze markets and stay notified about important events. When you extend rectangle or trendline the a
Was: $249  Now: $99   Market Profile defines a number of day types that can help the trader to determine market behaviour. A key feature is the Value Area, representing the range of price action where 70% of trading took place. Understanding the Value Area can give traders valuable insight into market direction and establish the higher odds trade. It is an excellent addition to any system you may be using. Inspired by Jim Dalton’s book “Mind Over Markets”, this indicator is designed to suit the
MT4:  https://www.mql5.com/en/market/product/52715 This indicator is based on market profile theory. What exactly is a singles area? Theory: Market Profile Singles : Singles or single prints  or gap  of the profile are placed in the inside of a profile structure, not at the upper or lower edge. They are represented with single TPOs printed on the Market profile. Singles draw our attention to places where the price moved very fast (impulse movements). They leave low volume nodes with liquidi
TrendMaestro5
Stefano Frisetti
note: this indicator is for METATRADER4, if you want the version for METATRADER5 this is the link:  https://www.mql5.com/it/market/product/108106 TRENDMAESTRO ver 2.4 TRENDMAESTRO recognizes a new TREND in the bud, he never makes mistakes. The certainty of identifying a new TREND is priceless. DESCRIPTION TRENDMAESTRO identifies a new TREND in the bud, this indicator examines the volatility, volumes and momentum to identify the moment in which there is an explosion of one or more of these data a
Le   TW Volume Signal Pro MT5 , utilisant des technologies avancées d'IA et des algorithmes intelligents propriétaires, vous permet de trader sur le marché de l'or avec une plus grande confiance et vous offre une expérience de trading unique et inégalée. Vous recherchez une haute précision et des signaux de trading exceptionnels sur le marché de l'or ? Avec le TW Volume Signal Pro MT5, vous pouvez devenir un trader professionnel et réussir brillamment sur le marché de l'or. Alors essayez-le gra
Berma Bands
Muhammad Elbermawi
The Berma Bands (BBs) indicator is a valuable tool for traders seeking to identify and capitalize on market trends. By analyzing the relationship between the price and the BBs, traders can discern whether a market is in a trending or ranging phase. Berma Bands are composed of three distinct lines: the Upper Berma Band, the Middle Berma Band, and the Lower Berma Band. These lines are plotted around the price, creating a visual representation of the price movement relative to the overall trend.
PipFinite Volume Critical MT5
Karlo Wilson Vendiola
5 (3)
Volume Gives Depth To Price Action! Volume Critical can accurately locate the cheapest areas to place trades. Enter reversals as early as possible to get the best Risk Reward setups! Features Aggressive algorithm that anticipates reversals Volume Classifications Gray Histograms - Normal Volume, average market activity Orange Histogram - Trending Volume, increased market activity Pink Histograms - Overbought Volume, we can wait for further confirmation to sell Blue Histograms - Oversold Condit
Plus de l'auteur
Trend Screener Pro MT5
STE S.S.COMPANY
4.88 (68)
Indicateur de tendance, solution unique révolutionnaire pour le trading et le filtrage des tendances avec toutes les fonctionnalités de tendance importantes intégrées dans un seul outil ! Il s'agit d'un indicateur multi-période et multi-devises 100 % non repeint qui peut être utilisé sur tous les symboles/instruments : forex, matières premières, crypto-monnaies, indices et actions. Trend Screener est un indicateur de suivi de tendance efficace qui fournit des signaux de tendance fléchés avec des
Trend Screener
STE S.S.COMPANY
4.81 (89)
Indicateur de tendance, solution unique révolutionnaire pour le trading et le filtrage des tendances avec toutes les fonctionnalités de tendance importantes intégrées dans un seul outil ! Il s'agit d'un indicateur multi-période et multi-devises 100 % non repeint qui peut être utilisé sur tous les symboles/instruments : forex, matières premières, crypto-monnaies, indices et actions. OFFRE À DURÉE LIMITÉE : L'indicateur Support and Resistance Screener est disponible pour seulement 50 $ et à vie. (
Trend Line Map Pro
STE S.S.COMPANY
4.47 (15)
Trend Line Map indicator is an addons for Trend Screener Indicator . It's working as a scanner for all signals generated by Trend screener ( Trend Line Signals ) . It's a Trend Line Scanner based on Trend Screener Indicator.  If you don't have Trend Screener Pro Indicator, the Trend Line Map Pro will not work. LIMITED TIME OFFER : Trend Line Map Indicator is available for only 50 $ and lifetime. ( Original price 125$ ) By accessing to our MQL5 Blog,  you can find all our premium indicators w
Support Resistance screnner
STE S.S.COMPANY
4.97 (35)
Support And Resistance Screener est dans un indicateur de niveau pour MetaTrader qui fournit plusieurs outils à l'intérieur d'un indicateur. Les outils disponibles sont : 1. Filtre de structure de marché. 2. Zone de repli haussier. 3. Zone de recul baissier. 4. Points pivots quotidiens 5. points pivots hebdomadaires 6. Points pivots mensuels 7. Support et résistance forts basés sur le modèle harmonique et le volume. 8. Zones au niveau de la banque. OFFRE D'UNE DURÉE LIMITÉE : L'indicateur de sup
L'analyseur de volatilité est un indicateur de momentum, qui capitalise sur la tendance des prix à éclater fortement après s'être consolidés dans une fourchette de négociation étroite. L'indicateur utilise également un oscillateur de momentum pour montrer la direction attendue du mouvement lorsque la compression se déclenche. Cet histogramme oscille autour de la ligne zéro, l'augmentation de l'élan au-dessus de la ligne zéro indique une opportunité d'achat long, tandis que l'élan tombant en des
Trend Line Map Pro MT5
STE S.S.COMPANY
4.09 (11)
Trend Line Map indicator is an addons for   Trend Screener Indicator . It's working as a scanner for all signals generated by Trend screener ( Trend Line Signals ) . It's a Trend Line Scanner based on Trend Screener Indicator.  If you don't have Trend Screener Pro Indicator,   the Trend Line Map Pro will not work.     LIMITED TIME OFFER : Trend Line Map Indicator is available for only 50 $ and lifetime. ( Original price 125$ ) By accessing to our MQL5 Blog,  you can find all our premium indica
La plage quotidienne moyenne montre la plage de pip moyenne d'une paire Forex mesurée sur un certain nombre de périodes. Les traders peuvent utiliser l'ADR pour visualiser l'action potentielle des prix en dehors du mouvement quotidien moyen. Lorsque l'ADR est supérieur à la moyenne, cela signifie que la volatilité quotidienne est plus élevée que d'habitude, ce qui implique que la paire de devises peut s'étendre au-delà de sa norme. Notre ADR Analyzer est composé de 5 fonctionnalités principal
L'indicateur Boom and Crash Spike Detector est codé sur la base d'une stratégie avancée principalement pour détecter le Boom and Crash dans les prix. Des algorithmes complexes ont été implantés pour détecter les booms et les crashs à haute probabilité dans les prix. Il alerte sur d'éventuelles phases de Boom ou crash : Phase de Boom : Lorsque le prix augmente trop vite. Crash Phase : Lorsque le prix baisse trop vite. OFFRE À DURÉE LIMITÉE : L'indicateur est disponible pour seulement 30$ et à
Les niveaux de support ou de résistance PR se forment lorsque l'action des prix d'un marché s'inverse et change de direction, laissant derrière lui un pic ou un creux (point de basculement) sur le marché. Les niveaux de support et de résistance peuvent créer des fourchettes de négociation. L'indicateur identifie le Swing High et le Swing Low en fonction du nombre de barres X (période) défini dans l'ensemble d'indicateurs. Remarque : Si vous aimez notre indicateur d'action sur les prix, es
FREE
Chaque commerçant sait qu'il ne devrait jamais risquer plus de 5% (ou 7%) par transaction. Il s'agit d'une loi de gestion de l'argent et une taille de lot utilisable doit être calculée à chaque fois car un trader doit utiliser une valeur StopLoss différente pour différents niveaux de trading. Cet indicateur calculera un LotSize approprié pour le moment où vous le mettrez sur le graphique et chaque fois que vous ferez glisser la "Stop Loss Line" dans n'importe quelle direction. OFFRE À DURÉE
L'analyseur de volatilité est un indicateur de momentum, qui capitalise sur la tendance des prix à éclater fortement après s'être consolidés dans une fourchette de négociation étroite. L'indicateur utilise également un oscillateur de momentum pour montrer la direction attendue du mouvement lorsque la compression se déclenche. Cet histogramme oscille autour de la ligne zéro, l'augmentation de l'élan au-dessus de la ligne zéro indique une opportunité d'achat long, tandis que l'élan tombant en des
L'indicateur Boom and Crash Spike Detector est codé sur la base d'une stratégie avancée principalement pour détecter le Boom and Crash dans les prix. Des algorithmes complexes ont été implantés pour détecter les booms et les crashs à haute probabilité dans les prix. Il alerte sur d'éventuelles phases de Boom ou crash : Phase de Boom : Lorsque le prix augmente trop vite. Crash Phase : Lorsque le prix baisse trop vite. OFFRE À DURÉE LIMITÉE : L'indicateur est disponible pour seulement 30$ et à
Currency Strength Meter, gives you a quick visual guide to which currencies are currently strong, and which ones are weak. The meter measures the strength of all forex cross pairs and applies calculations on them to determine the overall strength for each individual currency. We calculate based the strength of currency based on the trend of 28 pairs. By accessing to our MQL5 Blog,  you can download the   Demo   Version of the indicator. Try it before you buy ,without the Metatrader Tester rest
Currency strength meter gives you a quick visual guide to which currencies are currently strong, and which ones are weak. The meter measures the strength of all forex cross pairs and applies calculations on them to determine the overall strength for each individual currency.We calculate based the strength of currency based on the trend of 28 pairs. LIMITED TIME OFFER : Trend CSM Indicator is available for only 50 $. ( Original price 125$ ) By accessing to our MQL5 Blog,  you can find all our
Chaque commerçant sait qu'il ne devrait jamais risquer plus de 5% (ou 7%) par transaction. Il s'agit d'une loi de gestion de l'argent et une taille de lot utilisable doit être calculée à chaque fois car un trader doit utiliser une valeur StopLoss différente pour différents niveaux de trading. Cet indicateur calculera un LotSize approprié pour le moment où vous le mettrez sur le graphique et chaque fois que vous ferez glisser la "Stop Loss Line" dans n'importe quelle direction. OFFRE À DURÉE
La plage quotidienne moyenne montre la plage de pip moyenne d'une paire Forex mesurée sur un certain nombre de périodes. Les traders peuvent utiliser l'ADR pour visualiser l'action potentielle des prix en dehors du mouvement quotidien moyen. Lorsque l'ADR est supérieur à la moyenne, cela signifie que la volatilité quotidienne est plus élevée que d'habitude, ce qui implique que la paire de devises peut s'étendre au-delà de sa norme. Notre ADR Analyzer est composé de 5 fonctionnalités principal
Filtrer:
USD Down
59
USD Down 2024.12.04 13:19 
 

this tool is very important to calculate the risk and using the lot calculator, you can get a good combination of support and resistance level in addition to calculating the risk, the cost is nothing compared to the advantage of having such as a tool in hands, the costumer service is very comprehensive and answerring the questions in clear and precise manner, i recommand this tool for all traders with the lot and size calculator you will never be in hasardous situation due to non calculated open positions .

Nice Trader OÜ
2270
Aller Uja 2024.12.01 17:53 
 

a good tool if you learn to use it

168622
64
168622 2024.11.06 13:02 
 

L'utilisateur n'a laissé aucun commentaire sur la note

Clinton Van
118
Clinton Van 2024.09.25 15:43 
 

I love both indicators Trend screener Pro and Support and Resistance Screener Pro but you can't use them blindly. You need to understand market structure. I always try to trade a strong currency versus a weaker one. I then trade with the trend after price makes corrections. The Support and resistance indicator helps see how close price is from support or resistance. On uptrend I buy at support levels and downtrend I buy at resistance levels of price corrections. Together these indicators is all you need to make informed decisions. I do my analysis on the 1H time Frame and then I enter my trades using the 1min or 5min time frames. Thanks for these indicators. They really safe me allot of time.

Dang Minh Tien
592
Dang Minh Tien 2024.02.08 08:01 
 

My indicator doesn't draw the S/R zone; it only shows text. Bank levels work fine. I think it's a minor bug because it looks like the indicator isn't compatible when you change your chart color scheme.

STE S.S.COMPANY
291992
Réponse du développeur Sayadi Achraf 2024.02.09 11:54
Hi sir, Thank you for taking time to write your review. I'm sending you ASAP a private message to check the issue you're facing.
--- best regards.
SAYADI ashref.
dutchguy076
74
dutchguy076 2023.10.23 22:09 
 

L'utilisateur n'a laissé aucun commentaire sur la note

STE S.S.COMPANY
291992
Réponse du développeur Sayadi Achraf 2023.11.17 14:57
Dear sir, Thank you for taking time to write your review. We have just sent you an email to fix the issue that you're facing with u.
--- Please if you have any questions, feel free to contact me. Best regards.
SAYADI ashref.
Jerry Slagger
92
Jerry Slagger 2023.09.15 20:10 
 

This is one of the main indicators I use and I have been using it for 2 months now. The new version 13 is awesome. It allows all the levels to be displayed at the same time. So I can see that price is pushing a major or minor level, etc. These levels, along with the PullBack feature bring it all together so one can easily see the best entry / exit points. The HH LL Scanner is awesome as well. I use it to see if price is too high / low to enter, to make sure I am not entering after the move has already happened. Support is top notch and responsive.

STE S.S.COMPANY
291992
Réponse du développeur Sayadi Achraf 2023.09.20 17:46
Thank you for taking the time to share your review, Mr. Jerry.
Wilfried Pelletier
160
Wilfried Pelletier 2023.08.30 17:37 
 

L'utilisateur n'a laissé aucun commentaire sur la note

STE S.S.COMPANY
291992
Réponse du développeur Sayadi Achraf 2023.08.30 17:39
Thank you for your review, we are happy to know that you liked our indicator. Any questions, please feel free to contact us.
Dunstan Wafula Namusonge
851
Dunstan Wafula Namusonge 2023.06.09 19:26 
 

The reason why I like this forex indicator so much is because it is easy to use. The indicator accurately gives me both price action and technical analysis at the same time. The multi-functional features make this a unique product. Alerts are accurate with precise signals. The author is very responsive and available. I strongly recommend this indicator.Trust me when I say that this will be your go to indicator once you try it.

STE S.S.COMPANY
291992
Réponse du développeur Sayadi Achraf 2023.09.20 17:46
Thank you for taking time to share your review MR. Wafula.
Олег Похилько
160
Олег Похилько 2023.04.06 16:48 
 

Good indicator, but Sayadi just the best!

Andres.Morelo
129
Andres.Morelo 2023.01.26 10:33 
 

excellent indicator, I like me very much. It complements my trading plan very well and customer service is exceptional, too good for price. I recommend 100% I give you five stars

Agbakeleke Idowu
576
Agbakeleke Idowu 2023.01.21 22:37 
 

Very Worst Indicator in mql5 market. You will do yourself a great disadvantage buying it. Don't be deceived by the fake comments you saw here. It is a total waste of money. Wasted my hard earned $50 on this Garbage of a Thing. I once added a review but this Big man Liar has deleted it. The Creator did a very lazy Job on this indicator, and I consider it a big theft taking $50 for this nonesense indicator.

Deleting my Review on this indicator means this is a scam indicator. Nonesense

A BAD SELLER. DON'T EVER BUY FROM HIM. FAKE REVIEWS EVERYWHERE

STE S.S.COMPANY
291992
Réponse du développeur Sayadi Achraf 2023.06.06 00:17
Hello Mr. Idowu, Thank you for taking the time to share your feedback with us. I must say, I was taken aback by your review. As sellers, we do not have the capability to remove customer reviews and we always value constructive criticism as it helps us improve our services. However, it seemed from your review that you may have had a misunderstanding about our indicator/service. We have been selling on the MQL5 market since 2020 and our primary goal has always been to provide the best possible service to our customers. Any suggestions that we have engaged in dishonest activities are deeply unsettling and contrary to our principles. We believe in transparency and honest communication with our customers. Thank you once again for your feedback, and we wish you a safe and prosperous trading journey. Best regards,
SAYADI Ashref
26 Trades, LLC
370
JASON ALAN MYERS 2022.12.03 16:45 
 

Awesome indicator! I use the Pullback Zones on higher timeframes, set and wait for alert, then go to lower timeframe and wait for alert to enter trade. Also, there is no repaint on this indicator. Most indicators have great signals until you realize they have repainted, but not this indicator. Support is always prompt and helpful.

STE S.S.COMPANY
291992
Réponse du développeur Sayadi Achraf 2023.03.23 10:29
Thank you for your review, Mr. Jason.
25170142
144
25170142 2022.10.24 13:55 
 

Very good indicator, I use the pullback function in combination with indices and trade the pullbacks. That works great. Also the support is very good always quick response to questions.

STE S.S.COMPANY
291992
Réponse du développeur Sayadi Achraf 2023.03.23 10:28
Thank you for your review sir.
Long Zhang
62
Long Zhang 2022.08.25 07:56 
 

你好,可能因为防火墙的原因看不到视频,您可以将视频发到我的邮箱吗

STE S.S.COMPANY
291992
Réponse du développeur Sayadi Achraf 2022.08.25 18:05
Dear sir, Thank you for taking time to write your review. I'm sending you now the request video via PM. Best regards.
SAYADI Ashref.
SparksyB
102
SparksyB 2022.08.20 23:11 
 

Amazing indicator with pivot points features !

GoldHulk
955
GoldHulk 2022.03.26 02:49 
 

I got that SR Indicator for MT4+5 and observe it now for quite some time (4 months +)

- I have to say it still impresses me of how good these SR Zones are.

There are many SR/SnD Indicators, some of them are pretty good (I also like Blahtech Supply and Demand very much), but this SR Indicator here just masters an incredible difficult part (especially for coding this)

>> It only gives you the IMPORTANT SR Zones on your screen and doesnt clutter your whole screen til its useless.

Also I like the Settings very much on this indicator, they are smart trimmed down to the necessary but still versatile enough for adjustments (very good in not to overwhelm you with a shitload of settings like many others do)

In short: If you have a good foundation in basic trading skills/knowledge, then this Indicator here is an amazing tool

(for me: it helps me to get more structured in my own trading approach - without this indicator I tend to be all over the charts, have difficulties to prioritize - so its a great help to overcome my weaknesses)

PS: @Sayadi Achraf, not sure if thats possible, but if you can manage to make this working in similar quality on major crypto assests as well, then this would be amazing :)

STE S.S.COMPANY
291992
Réponse du développeur Sayadi Achraf 2022.03.26 14:47
Hi sir, Thank you for your review and I'm to know that you liked our indicator. I sent crypto request to my technical team and we will for this crypto feature in our next upgrade. Best regards.
SAYADI Ashref.
33225272
159
33225272 2022.02.05 18:14 
 

THE BEST TOOL EVER...

KUSPRAPTONO
35
KUSPRAPTONO 2022.01.13 09:26 
 

L'utilisateur n'a laissé aucun commentaire sur la note

STE S.S.COMPANY
291992
Réponse du développeur Sayadi Achraf 2022.01.13 14:01
Hi sir,ù Thank you for your message. This section for reviews only and for the request of support, you need to use the comment section, sir.
As i see that you bought the indicator since 3 hours ago, please don't worry we will give you all the necessary support to install the indicator properly in your Metatrader sir. We are sending you now a PM to check what issue you're facing to solve it with you. About exchange of product from MT5 to MT4, that's not possible sir. Best regards.
SAYADI Ashref.
peace55
45
peace55 2021.06.14 02:19 
 

I bought your product on Support and Resistance Pro... Please what timeframe works perfectly for it. Secondly, I wanted to get your order product the Currency strength meter but isn't in market place anymore

STE S.S.COMPANY
291992
Réponse du développeur Sayadi Achraf 2022.01.14 09:44
Hi sir. Thank you for choosing our products. This section for reviews only and for the request of support, you need to use the comment section, sir. The best timeframe is H1 and H4 sir. We published again the Currency Strength Meter for MT5, we are removed for upgrade, sir. You can find in our seller profile. Please if you have any questions, feel free to contact me sir.
12
Répondre à l'avis
Version 13.20 2023.12.13
1. Fixed email alert issue with the last metatrader version.
Version 13.0 2023.09.15
1. Add options to enable-disable every feature
Version 12.0 2023.06.05
1. Optimize Pullback zones to include markets ( Deriv pairs )
2. Enable 3 types of Pivots points.
3. Optimize Bank level zones.
Version 11.1 2023.02.03
1. Combine Breakout/Pullback Zones to provide one zone with arrows.
Version 10.12 2023.01.23
1. Fixing speeling mistakes in the text of the alerts.
Version 10.10 2023.01.23
1. Fixing alert issue with In Buyers and Sellers Zones. ( PullBack - Breakout Zones Alerts )
2. Optimizing Buyers and Sellers backtesting speed.
Version 10.0 2023.01.18
1. Change Pullback Zones logic.
2. Add Breakout zones.
3. Remove the Bank level feature.
Version 9.30 2023.01.13
1. Improve the PullBack zone algorithm to wait for the bar to close to confirm the zone.
Version 9.2 2022.11.24
1. Add a Central line for Bank levels.
2. Optimizing and improving the Strong Support and Resistance zones Algorithm.
Version 9.1 2022.08.08
1. Fixing changing mode issues and cleaning old zones
Version 9.0 2022.08.07
1. Optimizing Pullback feature algorithm.
2. Add an option to keep old pullback zones.
Version 8.50 2022.05.30
1. Add a new feature: Bank Levels.
2. Add Alerts to the Price Action Screener.
Version 8.40 2022.02.08
1. Add Line Width for Pivots lines.
Version 8.30 2022.02.03
1. Add support for US30 via sensitivity parameter.
Version 8.21 2021.12.24
1. Optimizing Indicator code and speed performance.
2. Add Pivots points levels.
Version 8.20 2021.10.06
1. Optimizing indicator algorithm.
Version 8.10 2021.05.09
1. Increase indicator speed.
Version 8.0 2021.04.27
- Fixing issue of pairs navigator with GKFX Broker.
Version 7.50 2020.12.03
1. Algorithm optimization.
Version 7.20 2020.11.29
1. Fixing refreshing issue.