FXC iCorrelatioN Specialized For DAX vs Dow Jones
- Indicateurs
- Zsolt Haromszeki
- Version: 1.9
- Mise à jour: 16 juillet 2024
- Activations: 20
FXC iCorrelatioN MT4 Indicator (Specialized for DAX - Dow Jones)
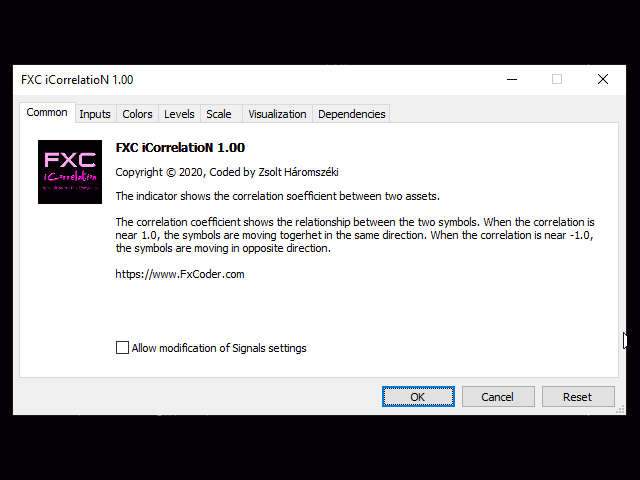
The indicator shows the correlation soefficient between two assets. Correlations are useful because they can indicate a predictive relationship that can be exploited in practice.
The correlation coefficient shows the relationship between the two symbols. When the correlation is near 1.0, the symbols are moving togerhet in the same direction. When the correlation is near -1.0, the symbols are moving in opposite direction.
Important: You can not run test in Tester, because this is a multicurrency indicator.
Main features:
- Multicurrency
- Developed for DAX - Dow Jones pair
- Based on Open or Close prices
- Time synchronization based on M1 data
- Buy/Sell open signals
- PUSH notifications
- E-mail sending
- Pop-up alert
- Customizeable Information panel
Tips for using:
- It is best used for assets that usually move together to the same direction. (The indicator is specialized for DAX - Dow Jones pair.)
- Suggested timeframes are up-to H4.
- Always use time synchronization for the right result.
- Stay open secondary symbol M1 chart when using Time Synchronization. Or stay open secondary symbol chart on the current timeframe at Bars Synchronization.
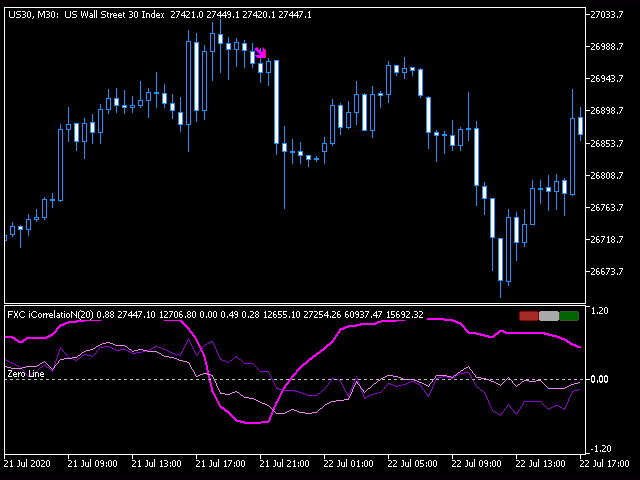
- At signals, open position to the indicated direction on the primary symbol. And open reverse position on the secondary symbol.
Input parameters:
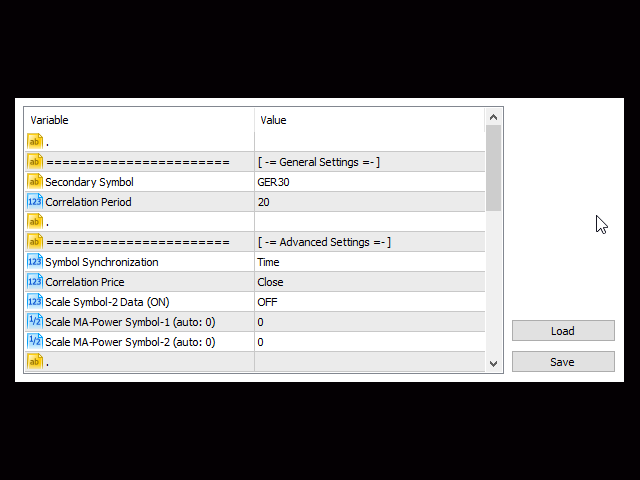
- Secondary Symbol: Specify the secondary symbol.
- Correlation Period: Period size of the correlation data.
- Symbol Synchronization:
- Bars: This procedure synchronizes the data based on candles.
- Time: This method synchronizes the data based on M1 chart prices. - Correlation Price: You can choose between Close and Open prices.
- Scale Symbol-2 Data (ON): This function brings the secondary symbol data to the same scale with primary symbol.
- Scale MA-Power Symbol-1 (auto: 0): Scaling primary symbol MA data fitt to the indicator window.
- Scale MA-Power Symbol-2 (auto: 0): Scaling secondary symbol MA data fitt to the indicator window.
- Signal Arrow (ON): Draws arrows to the chart at signals.
- PUSH Notification (ON): Sends PUSH notifications at signals.
- E-mail Sending (ON): Sends e-mails at signals.
- Pop-up Window Alert (ON): Sends pop-up alerts at signals.
- Signal Min. Correlation Turn: Sets the minimal correlation turn for signals.
- Signal Min. MA-Difference: Sets the minimal MA-Power difference for signals.
- Arrow Color Buy: Arrows color for Buy signals.
- Arrow Color Sell: Arrows color for Sell signals.
- Arrow Size (pixel): Arrows size in pixel.
- Arrow Shift Buy (Low + X pip): With this parameter, you can shift the price of the Buy arrows relative to the Low price.
- Arrow Shift Sell (High + X pip): With this parameter, you can shift the price of the Sell arrows relative to the High price.
- Infopanel (ON): Switch Turns the information panel on or off.
- Infopanel Color-1: Color-1 of the information panel.
- Infopanel Color-2: Color-2 of the information panel.
- Infopanel Color-3: Color-3 of the information panel.
- Infopanel Background (ON): Turns the background of the information panel on or off.
- Infopanel Background Color: Sets the background color of the information panel.
- Infopanel Font Size (pixel): Font size of the information panel. Use it when Windows 'Scale and layout' requires.
- Infopanel Row Size (pixel): Row size of the information panel.
Information Panel:
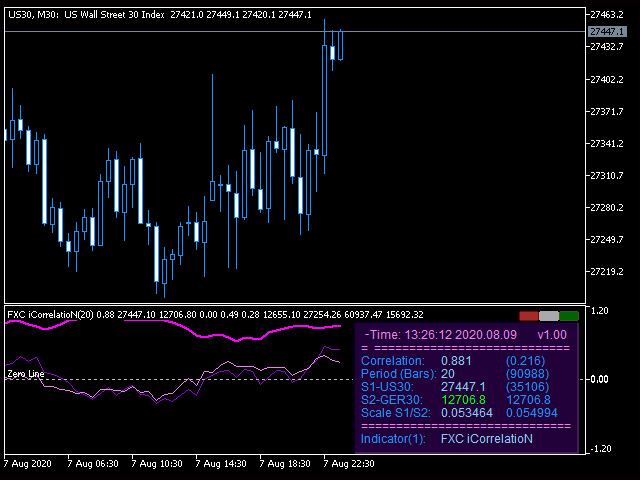
- Correlation: Shows the current correlation coefficient. In parentheses there is the difference of the MA-Powers.
- Period (Bars): Shows the correlation period size. In parentheses, it shows the number of bars in the chart of secondary symbol.
- S1-US30: 'US30' is the name of the primary symbol. It shows the current Bid price. In parentheses, there is the number of bars in the current chart.
- S2-GER30: 'GER30' is the name of the secondary symbol. It shows the current Bid price. The color of the first data has to be Lime. This shows proper operation.
- Scale S1/S2: Scaling variables of the MA-Power data for the primary and secondary symbols.
- Indicator(1): Shows the name of the indicator. The number in the parentheses represents the subwindow of the indicator.
Buttons:
- There are three little buttons at the right-upper corner of the information panel.
- RED button: It removes the indicator from the chart.
- WHITE button: Do nothing.
- GREEN button: It turns on or off the information panel.












L'utilisateur n'a laissé aucun commentaire sur la note