ClusterSecondForex
- Utilitaires
- Rafil Nurmukhametov
- Version: 1.3
- Mise à jour: 6 août 2020
- Activations: 9
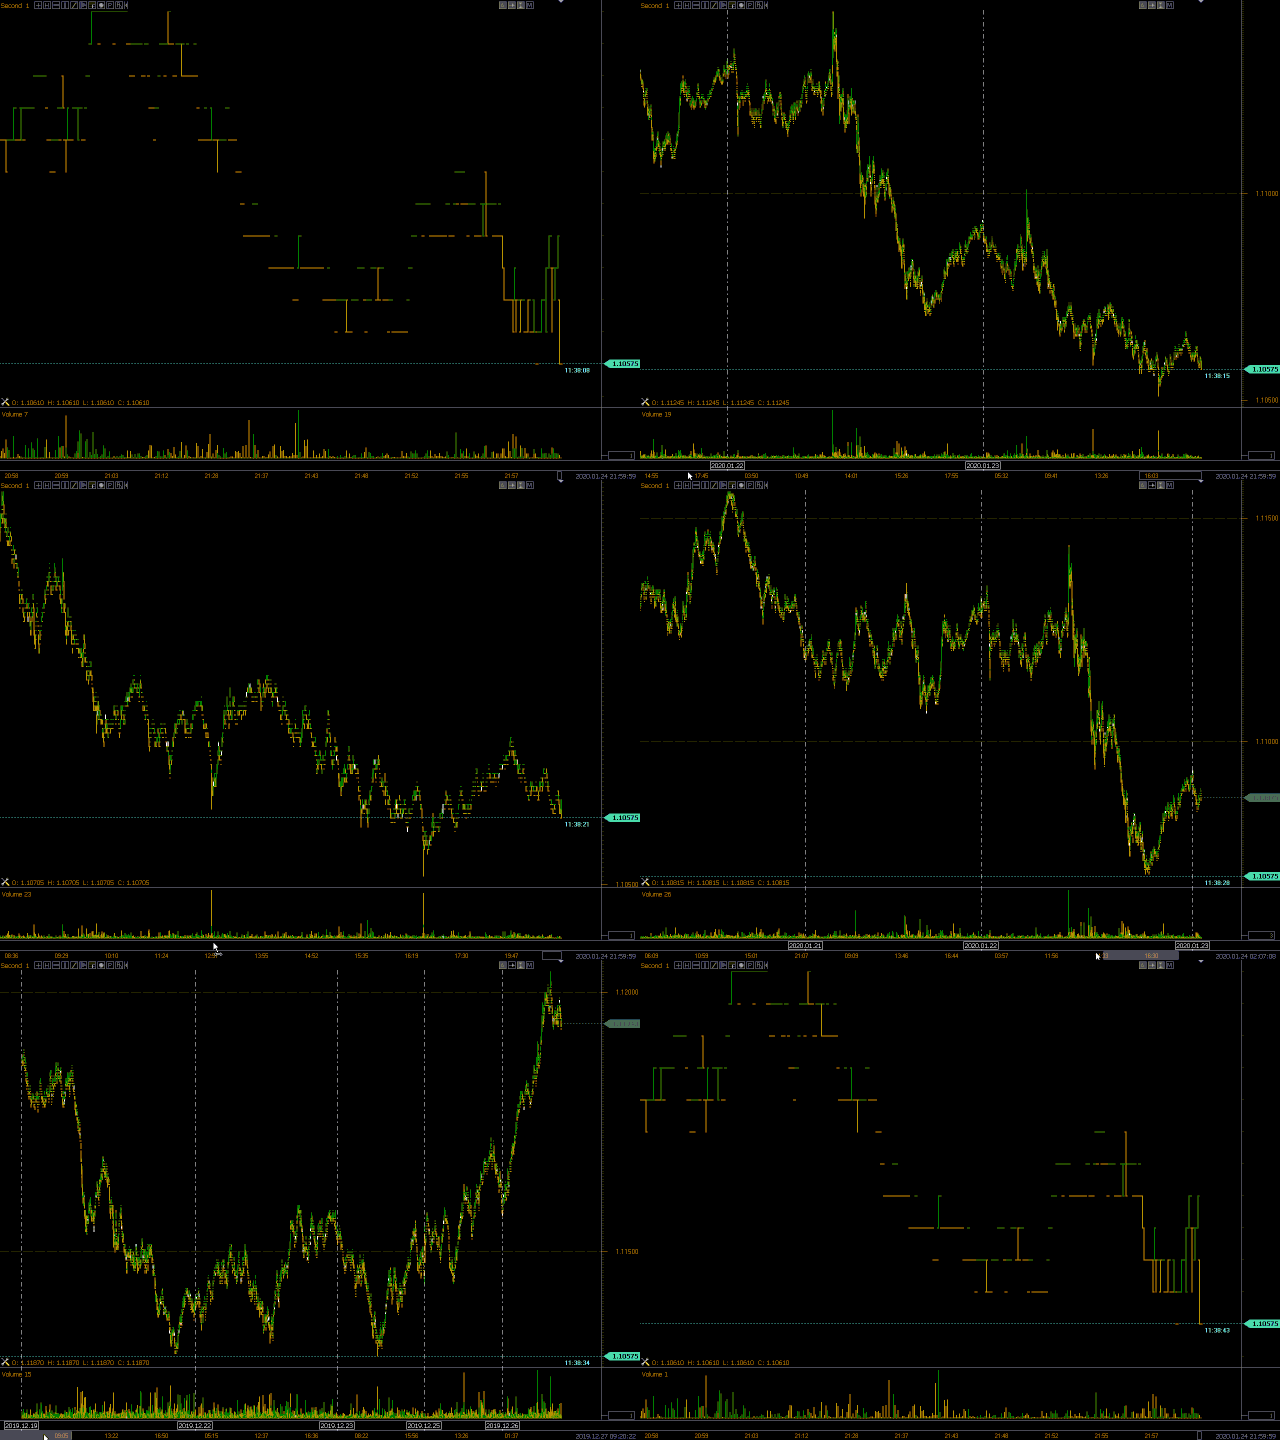
The utility allows you to build different types of graphs:
- Seconds chart from 1 second to 86400 seconds
- Tick chart from 1 tick and above
- The volume chart
- Delta chart
- Renko chart
- Range chart
Product demo https://www.mql5.com/ru/channels/clustersecondforex
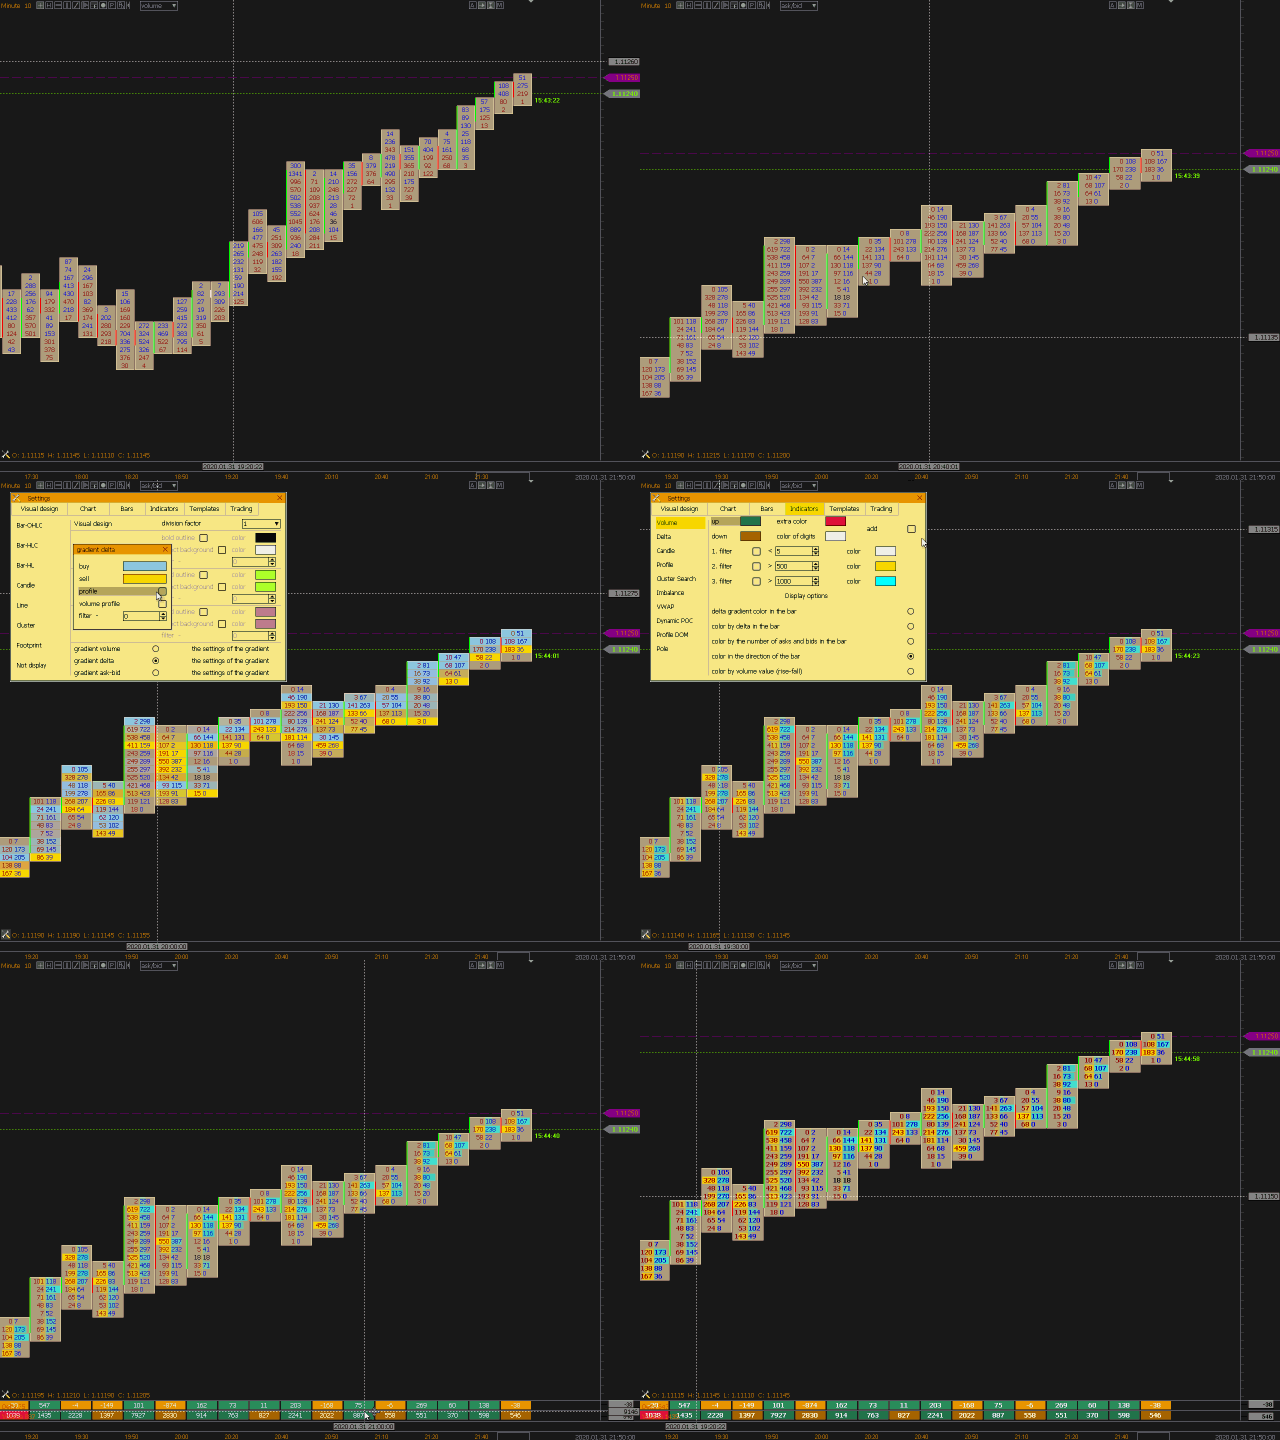
Built-in indicators for volumetric analysis:
- daily market profile and market profile of the selected timeframe,
- Cluster Search
- Imbalance
- VWAP
- Dynamic POC, VAH, VAL
- the profile depth of the market
- vertical volume with various display options,
- delta with various display options,
- pole of the current and higher timeframe
- basement candle display indicator
To manage the schedule are used:
- Left mouse button - moving the graph, selecting various modes in the settings, calling up the main settings window, located under the icon with a screwdriver in the lower left corner of the screen;
- Right mouse button - used to enter the settings of graphical constructions located under the icons in the upper left corner of the screen, as well as the individual settings of drawn vertical, horizontal, trend lines and rectangles.
- Rotating the mouse wheel in the chart area - moving the chart left-right, while holding the Ctrl key - moving the chart up and down, in the price scale area - scaling by price, in the timeline area - scaling with time;
- Key H - set the horizontal line on the chart or in the volume area (the "horizontal line drawing" icon should be turned on), Shift + H - delete all horizontal lines;
- Key V - set the vertical line (the "vertical line drawing" icon should be turned on), Shift + V - delete all vertical lines;
- Key T - set a trend line (the icon "drawing a trend line and a rectangle" should be turned on), Shift + T - delete all trend lines and rectangles;
- Key R - set the rectangle (the icon "drawing a trend line and a rectangle" must be enabled), Shift + R - delete all trend lines and rectangles;
- Key P - set the market profile (the icon "drawing a market profile" must be enabled), Shift + P - delete all built profiles;
- Key F- set Fibonacci levels ( the icon "drawing Fibo levels " must be enabled), Shift + F- delete all built Fibo levels;
- Keys Q and W- enable/disable profile display of the senior and daytime timeframe;
- Keys A, S, D- enable/disable display of ClusterSearch indicator (volume, delta, askbid);
- Spacebar - call the "ruler" mode to measure the number of points;
- Arrow keys to the left and arrow to the right - one-way movement of the graph;
- Up arrow and down arrow keys - move the graph up and down;
- A right click in the lower right corner of the window returns the chart to the current bar with auto-scaling by price and sets the default time scale;
- A right click in the upper right corner of the window updates the data without initializing other parameters;
- Click the right mouse button in the upper left corner of the window to call the menu with the "Chart" tab opened.
Input parameters
- Depth of Market add? - If the broker broadcasts data in the Depth of Market Adder, this parameter must be enabled for the Depth of Market Adder Profile indicator to work.
Custom indicators are not used in the utility and it is not possible to install them!!! Does not work in the strategy tester. There is no trading panel and no ability to trade from the chart.





























Yo tengo la versión que usa datos de volumen en mercados de futuros utilizando MQL5 y fue estupenda. Ahora que tengo la versión para Forex es la misma utilidad, es exactamente lo mismo y estoy gratamente impresionado por el excelente desempeño que tiene el indicador. Lo recomiendo para todos aquellos que utilizan footprint o order flow y market profile en su operativa diaria. Este indicador no le pide nada a los indicadores del mismo tipo utilizados en mercados de futuros.