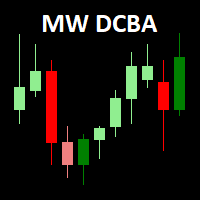
MW Market Sides Strength
- Indicateurs
- Martin Bittencourt
- Version: 1.7
- Mise à jour: 1 juin 2023
- Activations: 5
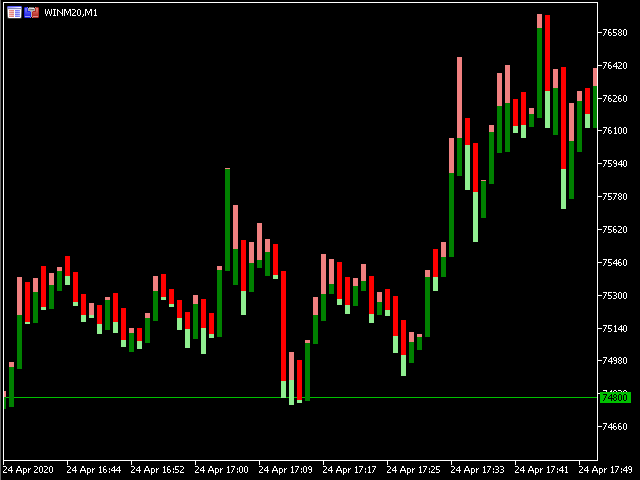
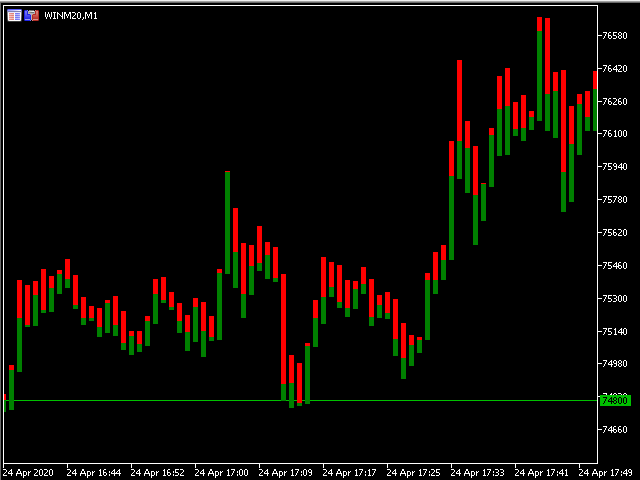
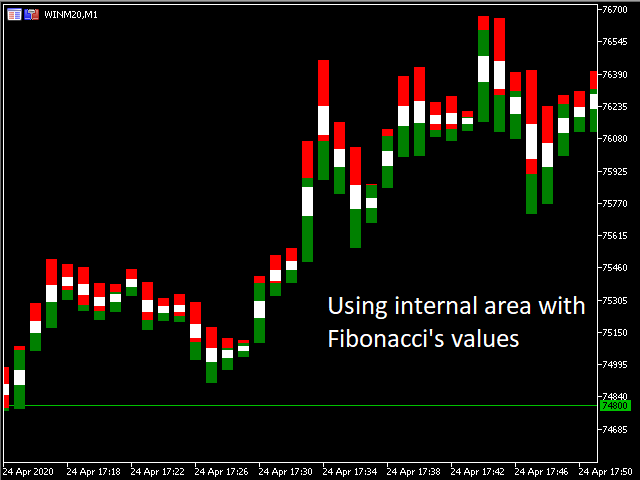
The Martinware™ Market Sides' Strength indicator shows the candlestick chart in a different manner allowing for a clearer view of which side, bullish or bearish is dominating the asset in the current period. As a bonus, it can also show an internal area that can be used to visualize two levels of Fibonacci retracements inside the bars.
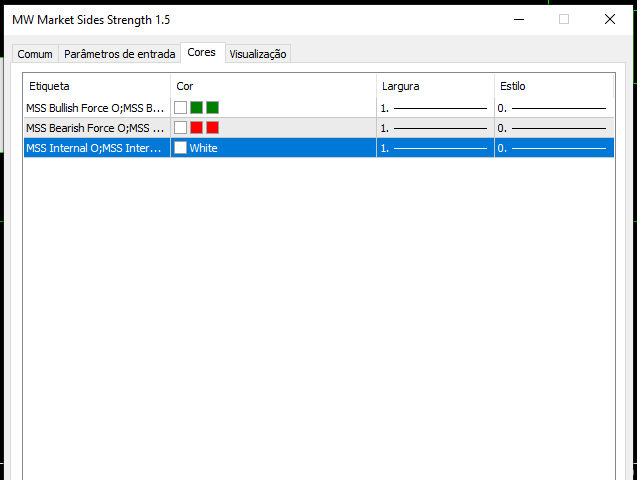
The default configuration shows the MSS bars with 4 main colors, two representing the bullish force, and two representing the bearish one. The primary colors are shown depending on the position of the closing price relative to the previous bar's close. So, if the current close is higher then the previous close, the primary bullish color is shown alongside the secondary bearish color and vice-versa.
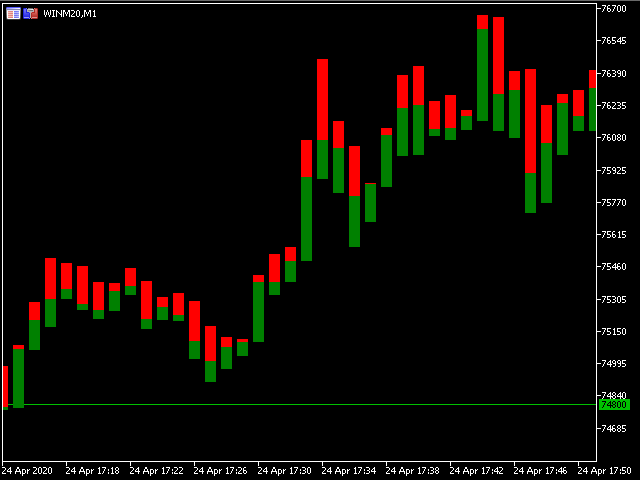
A secondary (and more recommended) way of using the indicator is by setting only one main color for each market force. In this way, the closing price's position becomes irrelevant and the MSS bars show the strength of each market side in a clearer way.
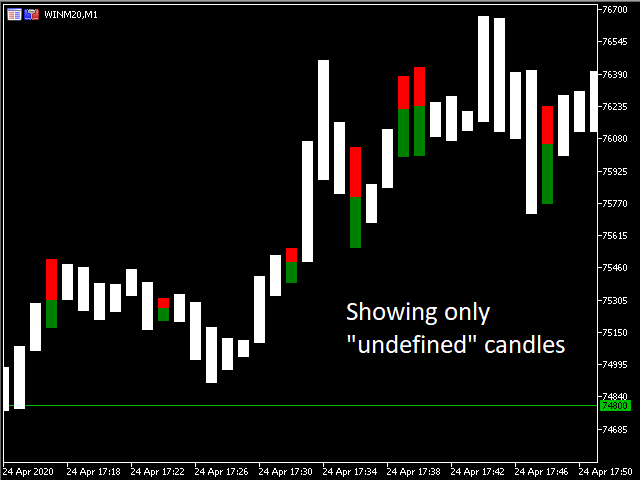
The indicator also allows filtering wich bars to show depending on the side's strength. For that, it divides each MSS bar into 5 areas using Fibonacci numbers representing strong bullish, defined bullish, undefined, defined bearish, and strong bearish bars. This way, the trader may easier focus on only the moments that matters to his trading strategy. Filtered bars are painted using the third color (white by default).
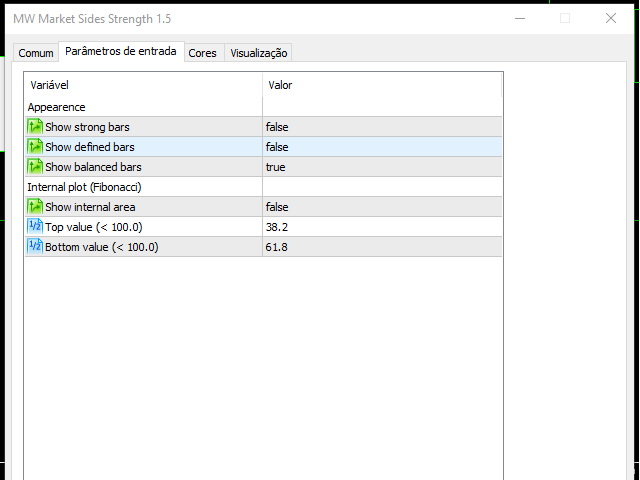
Input parameters:
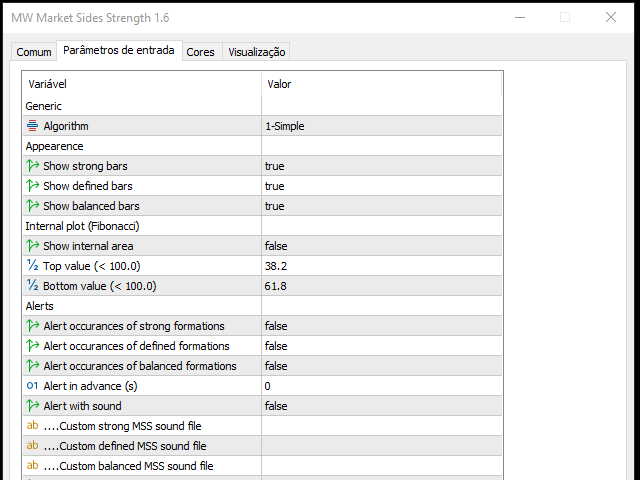
Show strong bars: makes visible the bars with strong forceShow defined bars: makes visible the weaker barsShow balanced bars: makes visible the balanced barsShow internal area: enables the drawing of the internal areaTop value: the top value of the internal areaBottom value: the bottom value of the internal area
