Lomb Periodogram
- Indicateurs
- Alfred Mirzasalikhov
- Version: 1.0
- Activations: 5
The Lomb algorithm is designed to find the dominant cycle length in noisy data. It is used commonly in the field of astronomy and is very good at extracting cycle out of really noisy data sets.
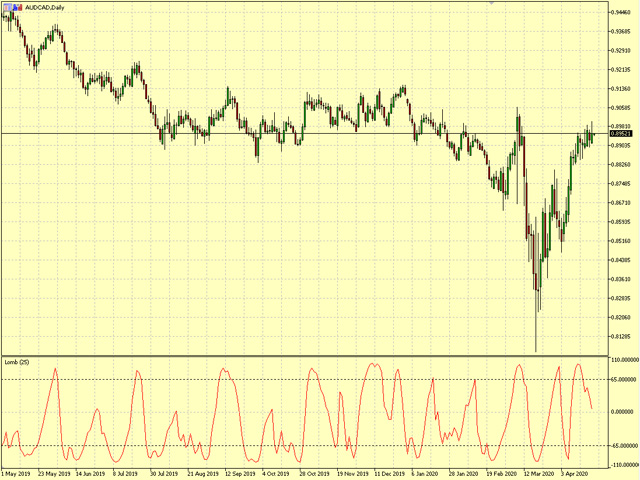
The Lomb phase plot is very similar to the Stochastics indicator. It has two threshold levels. When it crosses above the lower level it’s a buy signal. When it crosses the upper level it’s a sell signal.
This is cycle-based indicator, the nicer waves look, the better the signal.
Caution
Also It’s really important not to focus on only one indicator. That’s a very one-dimensional approach, and one-dimensional approaches don’t work very well in trading. It’s better to use different indicators at the same time and only trade when the majority of them come together.
Parameters
- Number of bars to use to find the dominant cycle - Maximum number of bars the indicator uses to find the dominant cycle. It also limits maximum length of the cycle. (Recommended 25, 60 or can be any other)
- Smooth - Number of the periods to smooth the line (Recommended 1-3, default 1)


