Gann Line
- Indicateurs
- Sergio D. Rocha
- Version: 1.30
- Mise à jour: 22 novembre 2021
- Activations: 5
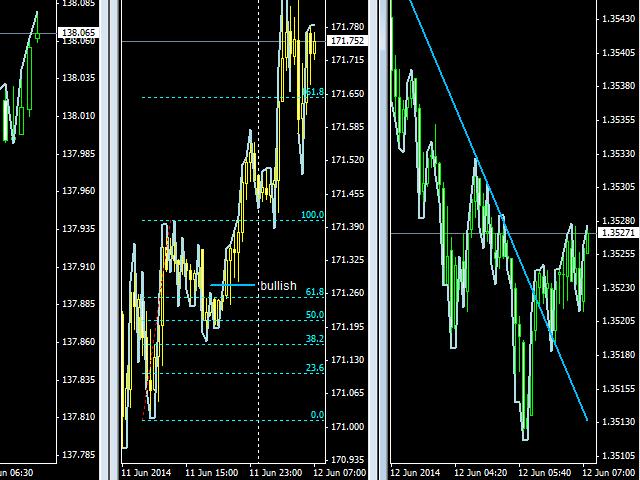
Gann Line indicator is usually used in combination with other Gann’s techniques, some say this is a key point in its success.
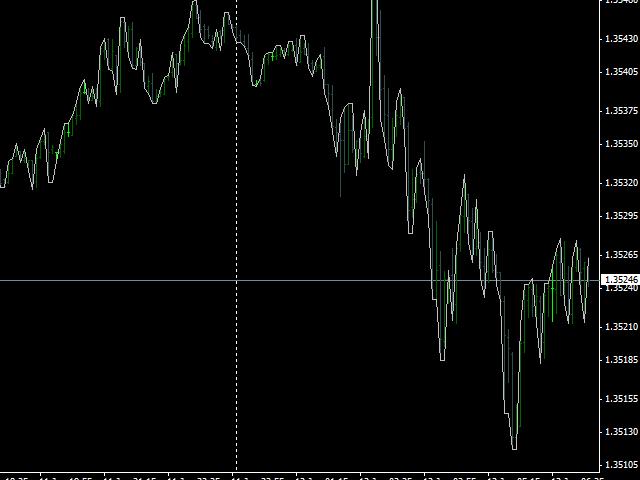
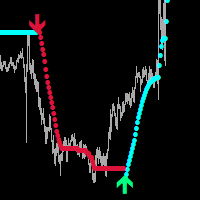
The Gann line is interpreted as trend indicator, a series of higher highs and higher lows in it's trend are considered bullish, and a series of lower lows and lower highs are bearish.
As with other technical indicators, for better results Gann Line should be used in combination with other technical concepts as Gann Fan, fibo, swings, supports and resistance, etc.
When reversal confirmation is needed you can use the Gann Line as well, wait until the Gann Line sets a new trend (2 higher highs and at least 1 higher low to confirm up side reversal or 2 lower lows and at least 1 lower high to confirm down side reversal).
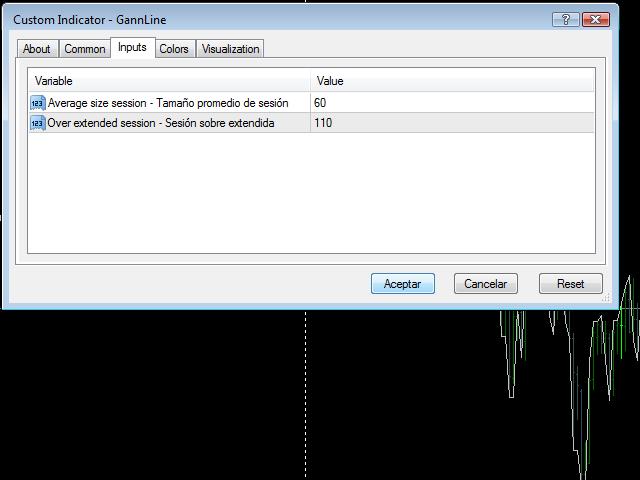
As a plus, the Gann Line indicator had been provided with a capacity to show when the daily range is smaller than an average size daily session (first color indicator), larger than average session -mostly of pairs beyond 60 pips, but you can set it as you wish- (second color) or over extended session (third color).
This is particularly handy when trading small time frames, due it helps you to asses the chances for a new signals. VG: when the size of the session is below the average session (first color) the chances for a new trade to pay within that session, if needs to make a new extreme, are better than when you have an all ready average session (second color) and those chances are even lesser to pay of this trade when you have an over extended session (third color).

