Chart Overlay Indicator
- Indicateurs
- Roy Meshulam
- Version: 1.1
- Mise à jour: 2 juin 2020
- Activations: 5
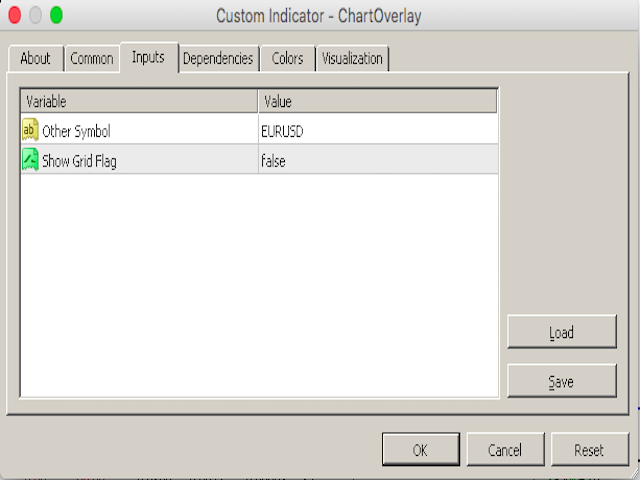
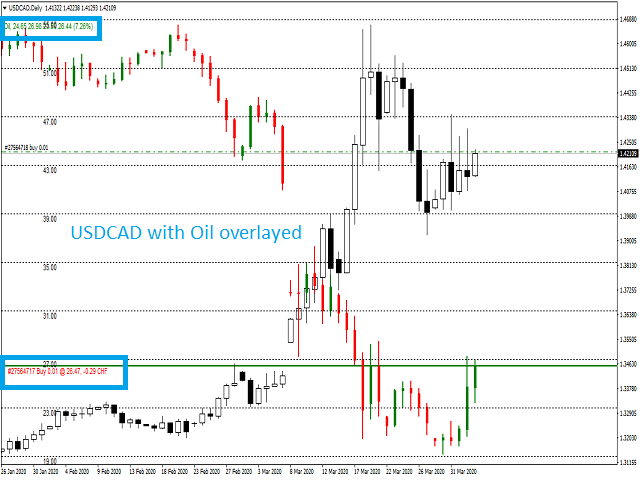
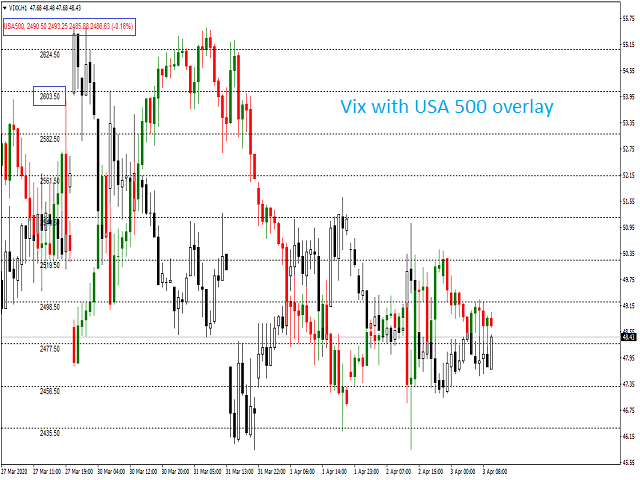
The Chart Overlay indicator displays the price action of different products on the same chart, allowing you to evaluate how different symbols fluctuate relative to each other. You may use it to make trading decisions based on convergence / divergence of the displayed products, i.e. USDCAD - XTIUSD, EURUSD - USDCHF etc.
Usage
- Find overbought or oversold products
- Adapts to chart size, zoom and timeframe
- Automatic price level calculation
- Customizable colors
- Click 'c' to open underline product in separate charts (both hourly and daily periods)
- Displays overlayed prodct positions
- Displays overlayed product Open, High, Low and close prices

