• Aperçu
  • Avis (2)
  • Commentaires (13)
  • Nouveautés

VR System MT 5

VR System n'est pas seulement un indicateur, c'est un système commercial complet et bien équilibré pour négocier sur les marchés financiers. Le système est construit sur des règles de trading classiques et une combinaison d'indicateurs Moving Average et Donchian Channel. Le VR System prend en compte les règles d'entrée sur le marché, de maintien d'une position sur le marché et les règles de sortie d'une position. Des règles de trading simples, des risques minimes et des instructions claires font du système VR une stratégie de trading attrayante pour les traders sur les marchés financiers.

Les paramètres, les fichiers de configuration, les versions de démonstration, les instructions, la résolution de problèmes peuvent être obtenus auprès de [Blog]
Vous pouvez lire ou écrire des critiques sur [lien]
Version pour [MetaTrader 4]

Le système commercial se compose de deux indicateurs combinés : la moyenne mobile et le canal Donchian.

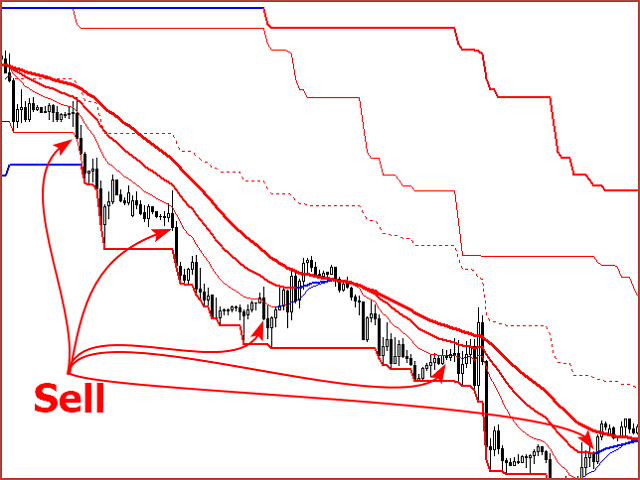
Canal Donchian – conçu pour déterminer l'état actuel d'un instrument financier ; l'indicateur est construit selon les règles classiques pour déterminer une tendance ou un plat. Un nouveau maximum local est supérieur au précédent, un nouveau minimum local est supérieur au précédent, on considère que l'instrument financier est « à la hausse ». Un nouveau maximum local est inférieur au précédent, un nouveau minimum local est inférieur au précédent est considéré que l'instrument financier est « Tendance à la baisse ». Si nous ne pouvons appliquer aucune des règles décrites ci-dessus, on considère qu'il existe une incertitude ou un plat sur l'instrument financier.

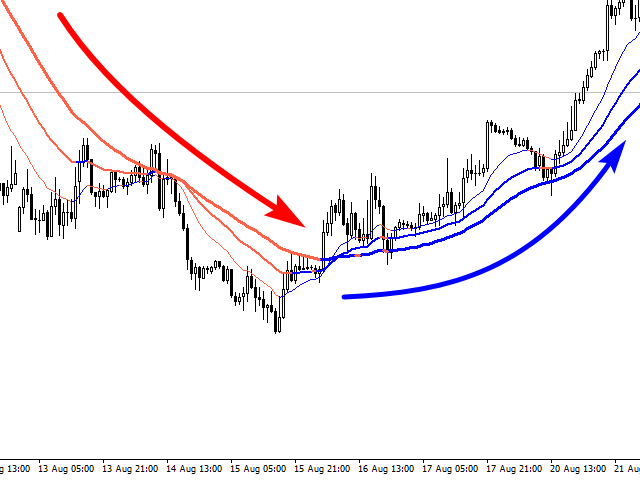
Moyenne mobile – moyenne mobile, conçue pour déterminer le point d'entrée sur le marché. L'indicateur comporte trois moyennes mobiles avec des périodes différentes. Moyenne mobile lente - montre la direction pour entrer sur le marché. Moyenne mobile – confirme la tendance actuelle sur un instrument financier. Moyenne mobile rapide – affiche le point d’entrée ainsi que la barre fermée actuelle.

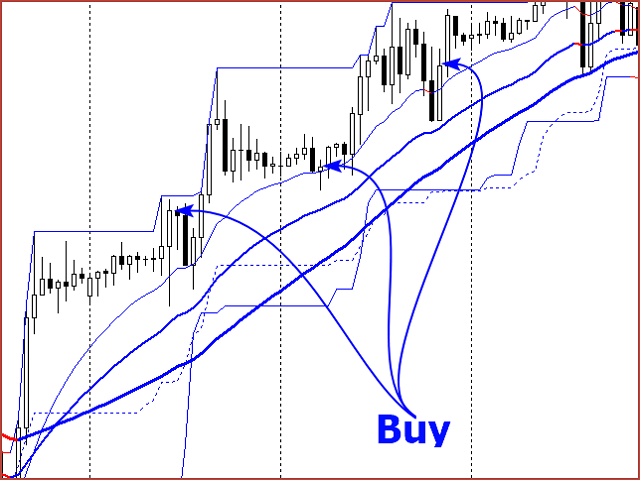
Achat d'un instrument financier :

Pour acheter, vous devez prendre en compte l'état suivant de l'indicateur : Pour des périodes de 1 heure, 4 heures et 1 jour, il y a une tendance à la hausse selon la règle du canal Donchian décrite ci-dessus. - Trois moyennes mobiles ont changé de couleur et montrent une tendance croissante. La dernière bougie de la période s'est clôturée sur une croissance, tandis que le plus bas de la dernière bougie est inférieur à la moyenne mobile rapide. Pour vendre un instrument financier, un signal inverse est pris en compte.

Détenir un poste :

Pour une position ouverte, le Stop Loss, le Take Profit et le Trailing Stop sont utilisés : le Take Profit est placé en dessous de la ligne supérieure du canal Donchian. Le Stop Loss est placé sous la ligne inférieure du canal Donchian. Le Trailing Stop doit être placé à la taille d’un tiers du canal.

Clôture d'un poste :

Selon Trailing Stop, si le volume d'une position est supérieur au lot minimum, il est possible de clôturer une partie de la position et de transférer le reste sans perte. Basé sur le signal opposé de la stratégie de trading.

Recommandations générales.

  • Commencez à analyser un instrument financier à partir de périodes plus anciennes de 4 heures et 1 jour.
  • Définissez toujours le Stop Loss et le Take Profit, protégez votre position par n'importe quelle méthode, l'essentiel est de ne pas subir de pertes supérieures à 1 à 2 % du dépôt.
  • Laissez vos profits croître, utilisez la clôture partielle de la position, transférez les soldes sans perte et laissez-les longtemps.
  • Travaillez avec plusieurs instruments financiers afin de recevoir plus de signaux pour le trading.
  • Suivez strictement les règles de base de la stratégie de trading.

Les paramètres du système

  • < --- I --- > - Paramètres de période du canal Donchian
  • Period Donchian - Canal Donchian de la période plus jeune
  • Period Big Donchian - Canal Donchian période senior
  • < --- II --- > - Paramètres de la moyenne mobile 1
  • Period Moving Average 1 - Moyenne mobile de la période 1
  • Method Moving Average 1 - Méthode Moving_Average 1
  • Price Moving Average 1 - Prix Moving_Average 1
  • < --- III --- > - Paramètres de moyenne mobile 2
  • Period Moving Average 2 - Période Moving_Average 2
  • Method Moving Average 2 - Méthode Moving_Average 2
  • Price Moving Average 2 - Prix Moving_Average 2
  • < --- IV --- > - Moyenne mobile 3 paramètres
  • Period Moving Average 3 - Période Moving_Average 3
  • Method Moving Average 3 - Méthode Moving_Average 3
  • Price Moving Average 3 - Prix Moving_Average 3
  • < --- V --- > - Paramètres des messages
  • Push - notifications sur un smartphone
  • Alert - notifications dans le terminal
  • Mail - notification par e-mail
  • < --- VI --- > - Autres paramètres
  • Show Bars (-1 all) - Nombre de calculs affichés (-1 tous)
Produits recommandés
The Analytical cover trend indicator is a revolutionary trend trading and filtering solution with all the important features of a trend tool built into one tool! The Analytical cover indicator is good for any trader, suitable for any trader for both forex and binary options. You don’t need to configure anything, everything is perfected by time and experience, it works great during a flat and in a trend. The Analytical cover trend indicator is a tool for technical analysis of financial markets
The indicator detects and displays М. Gartley's Butterfly pattern. The pattern is plotted by the extreme values of the ZigZag indicator (included in the resources, no need to install). After detecting the pattern, the indicator notifies of that by the pop-up window, a mobile notification and an email. The pattern and wave parameters are displayed on the screenshots. The default parameters are used for demonstration purposes only in order to increase the amount of detected patterns. Parameters
Basic Theme Builder MT5
Mehran Sepah Mansoor
5 (1)
Basic Theme Builder : Simplifiez la personnalisation de vos graphiques Transformez votre expérience de trading avec l'indicateur Basic Theme Builder , un outil polyvalent conçu pour simplifier la personnalisation de l'apparence de vos graphiques sur MetaTrader 5. Cet indicateur intuitif offre un panneau facile à utiliser qui vous permet de passer d'un thème à l'autre et de changer les schémas de couleurs en toute simplicité, améliorant ainsi l'apparence visuelle et la fonctionnalité de votre en
FREE
Vip Gold
Ignacio Agustin Mene Franco
VIP Gold It has the last indicator of the session Gold of the 4! It works in all temporalities. It is an indicator where it marks blocks of structures. the rebounds are on the red line up, and the green line down depending on which pair you use it, It is made for synthetic indices, crash and boom pairs It works as support and resistance also to better find the floor and ceiling of each pair.
MACalcAuto MT5
Tatiana Savkevych
As you know, the main invariable indicator of all traders is the moving average; it is used in some way in most strategies. It is also obvious that this indicator is capable of showing good entries in every local area. For which it usually needs to be optimized or just visually adjusted. This development is intended for automatic optimization of the indicator. Once placed on the chart, the indicator will automatically re-optimize itself with the specified period ( PeriodReOptimization ) and dis
Follow The Line MT5
Oliver Gideon Amofa Appiah
4.48 (27)
This indicator obeys the popular maxim that: "THE TREND IS YOUR FRIEND" It paints a GREEN line for BUY and also paints a RED line for SELL. (you can change the colors). It gives alarms and alerts of all kinds. IT DOES NOT REPAINT and can be used for all currency pairs and timeframes. Yes, as easy and simple as that. Even a newbie can use it to make great and reliable trades. NB: For best results, get my other premium indicators for more powerful and reliable signals. Get them here: https://www.m
FREE
The indicator identifies when a divergence occurs between price and an indicator or oscillator. It identifies both regular and hidden divergences. Combined with your own rules and techniques, this indicator will allow you to create (or enhance) your own powerful system. Features Can detect divergences for the following oscillators/indicators:   MACD, OsMA, Stochastics, RSI, CCI, RVI, Awesome, ADX, ATR, OBV, Composite index, MFI and Momentum. Only one oscillator/indicator can be selected. Draws
FREE
Combined
Ahmed Alaaeldin Abdulrahman Ahmed Elherzawi
5 (1)
Welcome to Investment Castle products This product is exclusively available in the MQL5 market and is not available and will not be available anywehere else. The Combined indicator is a multi-time frame indicator and it is built using 3 indicators: Bands indicator which draws the support and resistance key levels using up to 5 different time frames Patterns indicator which draws the chart patterns using up to 6 different time frames Spots indicator which shows the common candlestick patterns Yo
Mitimom
Danil Poletavkin
The indicator is based on Robert Miner's methodology described in his book "High probability trading strategies" and displays signals along with momentum of 2 timeframes. A Stochastic oscillator is used as a momentum indicator. The settings speak for themselves period_1 is the current timeframe, 'current' period_2 is indicated - the senior timeframe is 4 or 5 times larger than the current one. For example, if the current one is 5 minutes, then the older one will be 20 minutes The rest of the
FREE
Reversal Composite Candles
MetaQuotes Ltd.
3.62 (13)
The idea of the system is to indentify the reversal patterns using the calculation of the composite candle. The reversal patterns is similar to the "Hammer" and "Hanging Man" patterns in Japanese candlestick analysis. But it uses the composite candle instead the single candle and doesn't need the small body of the composite candle to confirm the reversal. Input parameters: Range - maximal number of bars, used in the calculation of the composite candle. Minimum - minimal size of the composite can
FREE
Macd Rsi
Ignacio Agustin Mene Franco
macd rsi It is a macd indicator added to the rsi to capture perfect entries in the average crossovers! As seen in the indicator, it has 2 lines, one of gold color and the other violet line, where the cross of the violet with the gold downwards is a sell signal when it crosses the violet up from the gold it is a buy signal! very good to make shorts works for forex markets and synthetic indices It is used in any temporality! Good profit! World Investor.
Advanced Trend Builder is a trend indicator using the original calculation algorithm. ATB can be used on any data and timeframe. My recommendation use for calculation numbers 4 - 16 - 64 - 256 and so on ..., but this is only recommendation. The middle of the trend wave is a special place where market behavior is different, when developed ATB was main idea to find the middle of the wave trend. Input parameters: Bars will be used for calculation - number of bars used for a trend line calculation.
FREE
This indicator uses the chart information and your inputs to display a calculated lot size and associated stop for long or short positions. It uses an ATR based percent volatility position sizing calculation and splits your account equity into two parts, each having its own risk percentage. The concept behind "Market's Money" is using a lower risk percentage for your base account equity and then using a higher risk percentage for any equity above your base equity. This lets you potentially grow
FREE
Trend indicator based on the ADX / ADXWilder indicator The indicator shows trend areas using ADX or ADXWilder indicator data. How the indicator works: if PDI is greater than NDI, then it`s bullish movement; if PDI is less than NDI, then it`s bearish movement; if ADX is less than or equal to the filter value specified in the parameters, then there is no movement state. Input parameters of the indicator: Calculate Timeframe - timeframe for calculation; ADX Type - type of ADX calculation
FREE
Important Lines
Terence Gronowski
4.84 (19)
This indicator displays Pivot-Lines, preday high and low, preday close and the minimum and maximum of the previous hour. You just have to put this single indicator to the chart to have all these important lines, no need to setup many single indicators. Why certain lines are important Preday high and low : These are watched by traders who trade in a daily chart. Very often, if price climbs over or falls under a preday low/high there is an acceleration in buying/selling. It is a breakout out of
FREE
What is this indicator? This indicator is the MACD (Moving Average Convergence/Divergence) supporting Virtual Trading mode of  Knots Compositor . When the mode is turned on, the indicator will be recalculated based on the displayed candlesticks. When the mode is turned off, the indicator will be recalculated based on the original chart candlesticks. Types of the applied price - Close - Open - High - Low - Median Price (HL/2) - Typical Price (HLC/3) - Weighted Price (HLCC/4) KC-Indicators
FREE
Size Bars
Viktor Loginov
Size Bars – индикатор отображает на графике максимальный, минимальный, текущий и средний размер баров (свечей) за выбранный период. Отображаемые параметры индикатора Size Bars: 1)       Текущий размер бара в писах (по максимум/минимум, тело бара). 2)       Максимальный, минимальный и средний размер свечей BUY . 3)       Максимальный, минимальный, средний размер свечей SELL . 4)       Количество свечей BUY и количество свечей SELL . 5)       Среднее количество свечей подряд BUY и SELL . 6)    
Renko System
Marco Montemari
This indicator can be considered as a trading system. It offers a different view to see the currency pair: full timeless indicator, can be used for manual trading or for automatized trading with some expert advisor. When the price reaches a threshold a new block is created according to the set mode. The indicator beside the Renko bars, shows also 3 moving averages. Features renko mode median renko custom median renko 3 moving averages wicks datetime indicator for each block custom notificatio
PFKBreakOut
Stanislav Korotky
This indicator displays breakouts on Point-And-Figure-like or Kagi-like custom symbol charts, generated by special expert advisers, such as PointFigureKagiCharts . This indicator is applicable only for custom instruments generated in appropriate way (with time-invariant bars which are multiples of a predefined box size). It makes no sense to apply it to other charts. The breakouts in up or down direction are marked by arrows. The breakout price is found at crossing of one of imaginary lines of
FREE
HighLow MT5
Azamat Mullayanov
3 (1)
The indicator plots two lines by High and Low prices. The lines comply with certain criteria. The blue line is for buy. The red one is for sell. The entry signal - the bar opens above\below the lines. The indicator works on all currency pairs and time frames It can be used either as a ready-made trading system or as an additional signal for a custom trading strategy. There are no input parameters. Like with any signal indicator, it is very difficult to use the product during flat movements. You
FREE
Donchian Channel DC is the indicator of Donchian Channels, that plots maximum and minimum values of a specific period, besides mean value line. It´s possible to configure simple period for analysis and the indicator will plot all three values. You can trade with this indicator as trend or reversal, according to each strategy. Do not let to test others indicators as soon as others expert advisors.
This indicator is a zero-lag indicator and displays  strength of trend change . True Trend  Oscillator Pro works best in combination with True Trend Moving Average Pro that displays exact trend as is. Oscillator value is exact price change in given direction of the trend. True Trend Moving Average Pro: https://www.mql5.com/en/market/product/103586 If you set PERIOD input parameter to 1 this indicator becomes a sharpshooter for binary options. Developers can use True Trend Oscillator in E
FREE
JAC Trend Color Candle
Eduardo Da Costa Custodio Santos
L'indicateur "JAC Trend Color Candle" pour Meta Trader 5, a été créé pour faciliter visuellement la tendance pour le trader. Il est basé sur trois paramètres, qui identifient la tendance haussière, la tendance baissière et le marché sans tendance. Les couleurs sont configurables par le commerçant, et le commerçant moyen également. les paramètres de tendance ne peuvent pas être configurés car ils sont le différentiel de l'indicateur.
HMA Color with Alerts MT5
Pavel Zamoshnikov
4.71 (45)
Hull Moving Average (HMA) is well-deservedly popular among traders because of the effective averaging of market noise and a relatively small delay. The current MetaTrader 5 version changes its color when the movement direction changes. Sound and text signals are available. It also supports sending email and push messages. It is possible to trigger a signal on the current incomplete bar, although such a signal may be canceled before completion if conditions are no longer appropriate. One of the p
FREE
Ichimoku Kinko Hyo is a purpose-built trend trading charting system that has been successfully used in nearly every tradable market. It is unique in many ways, but its primary strength is its use of multiple data points to give the trader a deeper, more comprehensive view into price action. This deeper view, and the fact that Ichimoku is a very visual system, enables the trader to quickly discern and filter "at a glance" the low-probability trading setups from those of higher probability. This i
Easy GOLD MT5
Franck Martin
4.29 (21)
Easy Gold is the latest addition to the BotGPT family. It is surprising and very powerful. It is ideal for beginners due to its simplicity.  There is absolutely nothing to do, it's 100% automated, simply indicate the percentage of risk you want to take per trade and the EA is ready. Whatever your capital, the EA takes care of everything. Optimized on (XAUUSD).  Unleash all the power with the professional version (AGI Gold) and its connection to the neural network, available in my store. My othe
FREE
Free automatic Fibonacci is an indicator that automatically plots a Fibonacci retracement based on the number of bars you select on the BarsToScan setting in the indicator. The Fibonacci is automatically updated in real time as new highest and lowest values appears amongst the selected bars. You can select which level values to be displayed in the indicator settings. You can also select the color of the levels thus enabling the trader to be able to attach the indicator several times with differe
FREE
Are you tired of drawing trendlines every time you're analyzing charts? Or perhaps you would like more consistency in your technical analysis. Then this is for you. This indicator will draw trend lines automatically when dropped on a chart. How it works Works similar to standard deviation channel found on mt4 and mt5. It has 2 parameters: 1. Starting Bar 2. Number of bars for calculation The   starting bar   is the bar which drawing of the trend lines will begin, while the   number of bars for c
FREE
Multi-timeframe trend indicator based on the ADX / ADXWilder indicator with Fibonacci levels The indicator shows trend areas using ADX or ADXWilder indicator data from multiple timeframes. The impulse mode of the indicator allows you to catch the beginning of a trend, and several "Screens" with different timeframes allow you to filter out market noise. Fibonacci levels are added to the price chart, which have flexible settings. How the indicator works: if PDI is greater than NDI, then   it`
FREE
Divergence MACD indicator shows price and MACD indicator divergence. The indicator is not redrawn! The algorithm for detection of price and MACD extremums has been balanced for the earliest entry allowing you to use the smallest SL order possible. The indicator displays all types of divergences including the hidden one, while having the minimum number of settings. Find out more about the divergence types in Comments tab. Launch settings: Max Bars - number of bars calculated on the chart. Indent
Les acheteurs de ce produit ont également acheté
Atomic Analyst MT5
Issam Kassas
4.5 (16)
Tout d'abord, il convient de souligner que cet indicateur de trading n'est ni repainting, ni redrawing et ne présente aucun délai, ce qui le rend idéal à la fois pour le trading manuel et automatisé. Manuel de l'utilisateur : réglages, entrées et stratégie. L'Analyste Atomique est un indicateur d'action sur les prix PA qui utilise la force et le momentum du prix pour trouver un meilleur avantage sur le marché. Équipé de filtres avancés qui aident à éliminer les bruits et les faux signaux, et à
Atbot
Zaha Feiz
5 (18)
AtBot : Comment ça fonctionne et comment l'utiliser ### Comment ça fonctionne L'indicateur "AtBot" pour la plateforme MT5 génère des signaux d'achat et de vente en utilisant une combinaison d'outils d'analyse technique. Il intègre la Moyenne Mobile Simple (SMA), la Moyenne Mobile Exponentielle (EMA) et l'indice de la Plage Vraie Moyenne (ATR) pour identifier les opportunités de trading. De plus, il peut utiliser des bougies Heikin Ashi pour améliorer la précision des signaux. Laissez un avis ap
Tout d'abord, il convient de souligner que ce système de trading est un indicateur non repeint, non redessiné et non retardé, ce qui le rend idéal pour le trading manuel et automatisé. Cours en ligne, manuel et téléchargement de préréglages. Le "Système de Trading Smart Trend MT5" est une solution de trading complète conçue pour les traders débutants et expérimentés. Il combine plus de 10 indicateurs premium et propose plus de 7 stratégies de trading robustes, ce qui en fait un choix polyvalent
TPSpro RFI Levels MT5
Roman Podpora
4.63 (8)
Reversal First Impulse levels (RFI)      INSTRUCTIONS        RUS       -       ENG              R ecommended to use with an indicator   -   TPSpro  TREND PRO -  Version MT4                 A key element in trading is zones or levels from which decisions to buy or sell a trading instrument are made. Despite attempts by major players to conceal their presence in the market, they inevitably leave traces. Our task was to learn how to identify these traces and interpret them correctly. Main functi
Quantum Trend Sniper
Bogdan Ion Puscasu
4.82 (45)
Présentation       Quantum Trend Sniper Indicator   , l'indicateur révolutionnaire MQL5 qui transforme la façon dont vous identifiez et négociez les inversions de tendance ! Développé par une équipe de traders expérimentés avec une expérience commerciale de plus de 13 ans,       Indicateur Quantum Trend Sniper       est conçu pour propulser votre parcours de trading vers de nouveaux sommets grâce à sa manière innovante d'identifier les inversions de tendance avec une précision extrêmement élevée
TPSproTREND PrO MT5
Roman Podpora
4.89 (9)
TPSpro TREND PRO  - is a trend indicator that automatically analyzes the market and provides information about the trend and each of its changes, as well as giving signals for entering trades without redrawing! The indicator uses each candle, analyzing them separately. referring to different impulses - up or down impulse. Exact entry points into transactions for currencies, crypto, metals, stocks, indices!  Version MT4               DETAILED DESCRIPTION               R ecommended to use with an
FX Power MT5 NG
Daniel Stein
5 (4)
Obtenez votre mise à jour quotidienne du marché avec des détails et des captures d'écran via notre Morning Briefing ici sur mql5 et sur Telegram ! FX Power MT5 NG est la nouvelle génération de notre très populaire indicateur de force des devises, FX Power. Et qu'est-ce que ce compteur de force de nouvelle génération offre ? Tout ce que vous avez aimé de l'original FX Power PLUS Analyse de la force de l'OR/XAU Des résultats de calcul encore plus précis Périodes d'analyse configurables individuel
Trend Screener Pro MT5
STE S.S.COMPANY
4.86 (56)
Indicateur de tendance, solution unique révolutionnaire pour le trading et le filtrage des tendances avec toutes les fonctionnalités de tendance importantes intégrées dans un seul outil ! Il s'agit d'un indicateur multi-période et multi-devises 100 % non repeint qui peut être utilisé sur tous les symboles/instruments : forex, matières premières, crypto-monnaies, indices et actions. Trend Screener est un indicateur de suivi de tendance efficace qui fournit des signaux de tendance fléchés avec des
Tout d'abord, il convient de souligner que cet outil de trading est un indicateur non repeint, non redessiné et non retardé, ce qui le rend idéal pour le trading professionnel. Cours en ligne, manuel utilisateur et démonstration. L'indicateur Smart Price Action Concepts est un outil très puissant à la fois pour les nouveaux et les traders expérimentés. Il regroupe plus de 20 indicateurs utiles en un seul, combinant des idées de trading avancées telles que l'analyse du trader Inner Circle et
Top indicator for MT5   providing accurate signals to enter a trade without repainting! It can be applied to any financial assets:   forex, cryptocurrencies, metals, stocks, indices .  Watch  the video  (6:22) with an example of processing only one signal that paid off the indicator! MT4 version is here It will provide pretty accurate trading signals and tell you when it's best to open a trade and close it. Most traders improve their trading results during the first trading week with the help of
FX Volume MT5
Daniel Stein
5 (12)
Obtenez votre mise à jour quotidienne du marché avec des détails et des captures d'écran via notre Morning Briefing ici sur mql5 et sur Telegram ! FX Volume est le PREMIER et SEUL indicateur de volume qui fournit un VRAI aperçu du sentiment du marché du point de vue d'un courtier. Il fournit des informations impressionnantes sur la façon dont les acteurs institutionnels du marché, comme les courtiers, sont positionnés sur le marché des changes, bien plus rapidement que les rapports COT. Voir c
Trend Hunter MT5
Andrey Tatarinov
5 (1)
Trend Hunter est un indicateur de tendance pour travailler sur les marchés du Forex, des cryptomonnaies et des CFD. Une particularité de l'indicateur est qu'il suit la tendance avec confiance, sans changer le signal lorsque le prix dépasse légèrement la ligne de tendance. L'indicateur n'est pas redessiné; un signal d'entrée sur le marché apparaît après la fermeture de la barre. Lorsque vous suivez une tendance, l'indicateur affiche des points d'entrée supplémentaires dans la direction de la t
Golden Spikes Premium
Kwaku Bondzie Ghartey
Golden Spikes Detector Acknowledgement and Dedications:  The name of this indicator was Inspired by an Original; Mr Grant Koopman; a Knowledgeable and experienced Synthetics trader. I dedicate this indicator to Mr Grant.  Overview: The Golden Spikes Premium is a groundbreaking trading indicator meticulously crafted for the Boom and Crash indices on the Deriv market. Tailored to meet the needs of discerning traders, this powerful tool operates exclusively on the one-minute timeframe, providin
Unlock hidden profits: accurate divergence trading for all markets Special Offer: Purchase now to receive free bonuses worth $90! (Read more for details) Tricky to find and scarce in frequency, divergences are one of the most reliable trading scenarios. This indicator finds and scans for regular and hidden divergences automatically using your favourite oscillator. [ Installation Guide | Update Guide | Troubleshooting | FAQ | All Products ] Easy to trade Finds regular and hidden divergences S
ATREND ATREND : Comment ça fonctionne et comment l'utiliser Comment ça fonctionne L'indicateur "ATREND" pour la plateforme MT5 est conçu pour fournir aux traders des signaux d'achat et de vente robustes en utilisant une combinaison de méthodologies d'analyse technique. Cet indicateur s'appuie principalement sur la plage vraie moyenne (ATR) pour mesurer la volatilité, ainsi que sur des algorithmes de détection de tendance pour identifier les mouvements potentiels du marché. Laissez un message ap
Maintenant 147 $ (augmentant à 499 $ après quelques mises à jour) - Comptes illimités (PCS ou Mac) Manuel d'utilisation RelicusRoad + Vidéos de formation + Accès au groupe Discord privé + Statut VIP UNE NOUVELLE FAÇON DE REGARDER LE MARCHÉ RelicusRoad est l'indicateur de trading le plus puissant au monde pour le forex, les contrats à terme, les crypto-monnaies, les actions et les indices, offrant aux traders toutes les informations et tous les outils dont ils ont besoin pour rester renta
Auto Order Block with break of structure based on ICT and Smart Money Concepts (SMC) Futures Break of Structure ( BoS )             Order block ( OB )            Higher time frame Order block / Point of Interest ( POI )    shown on current chart           Fair value Gap ( FVG ) / Imbalance   -  MTF      ( Multi Time Frame )    HH/LL/HL/LH  -  MTF      ( Multi Time Frame )  Choch  MTF      ( Multi Time Frame )  Volume Imbalance     ,  MTF          vIMB Gap’s Power of 3 Equal High
Vous recherchez un puissant indicateur de trading forex qui peut vous aider à identifier facilement des opportunités de trading rentables ? Ne cherchez pas plus loin que le Beast Super Signal. Cet indicateur basé sur les tendances facile à utiliser surveille en permanence les conditions du marché, en recherchant de nouvelles tendances en développement ou en sautant sur celles existantes. Le Beast Super Signal donne un signal d'achat ou de vente lorsque toutes les stratégies internes s'alignent
Advanced Supply Demand MT5
Bernhard Schweigert
4.46 (13)
La meilleure solution pour tout commerçant débutant ou expert ! Cet indicateur est un outil de trading unique, de haute qualité et abordable car nous avons intégré un certain nombre de fonctionnalités propriétaires et une nouvelle formule. Avec cette mise à jour, vous pourrez afficher des zones à double horaire. Vous pourrez non seulement afficher un TF plus élevé, mais afficher les deux, le graphique TF, PLUS le TF supérieur : AFFICHAGE DES ZONES NICHÉES. Tous les traders Supply Demand vont ado
The Smart Liquidity Profile is color-coded based on the importance of the traded activity at specific price levels, allowing traders to identify significant price levels such as support and resistance levels, supply and demand zones, liquidity gaps, consolidation zones, Buy-Side/Sell-Side Liquidity and so on.  Smart Liquidity Profile allows users to choose from a number of different time periods including 'Auto,' 'Fixed Range,' 'Swing High,' 'Swing Low,' 'Session,' 'Day,' 'Week,' 'Month,' 'Quart
Ce tableau de bord affiche les derniers   modèles harmoniques   disponibles pour les symboles sélectionnés, ce qui vous permettra de gagner du temps et d'être plus efficace /   version MT4 . Indicateur gratuit:   Basic Harmonic Pattern Colonnes de l'indicateur Symbol :   les symboles sélectionnés apparaissent Trend   :   haussière ou baissière Pattern :   type de motif (gartley, papillon, chauve-souris, crabe, requin, cypher ou ABCD) Entry:   prix d'entrée SL:   prix du stop loss TP1:   1
Unlock key market insights with automated support and resistance lines Special Offer: Purchase now to receive free bonuses worth $75! (Read more for details) Tired of plotting support and resistance lines? This is a multi-timeframe indicator that detects and plots supports and resistance lines in the chart with the same precision as a human eye would. As price levels are tested over time and its importance increases, the lines become thicker and darker, making price leves easy to glance and ev
Step into the realm of Forex trading with confidence and precision using XQ, a cutting-edge Forex indicator designed to elevate your trading game to unprecedented heights. Whether you're a seasoned trader or just stepping into the world of currency exchange, XQ Forex Indicator empowers you with the insights and signals needed to make informed trading decisions. The signal conditions are a combination of three indicators, and XQ Forex Indicator only display  medium and long-term trends . The ind
Native Channels
BeeXXI Corporation
5 (1)
This indicator recognizes all support and resistance levels. A number of unique high-performance techniques have been applied, which made the existence of this indicator possible. All formed channels are naturally visible: horizontal linear linear parabolic cubic (Polynomial 3 degrees - Wave) This is due to a bundle of approximating channels. The formed channels form "standing waves" in a hierarchical sequence. Thus, all support and resistance levels are visible. All parameter management is
PZ Day Trading MT5
PZ TRADING SLU
2.4 (5)
Effortless trading: non-repainting indicator for accurate price reversals Special Offer: Purchase now to receive free bonuses worth $60! (Read more for details) This indicator detects price reversals in a zig-zag fashion, using only price action analysis and a donchian channel. It has been specifically designed for short-term trading, without repainting or backpainting at all. It is a fantastic tool for shrewd traders aiming to increase the timing of their operations. [ Installation Guide | Upd
Support And Resistance Screener est dans un indicateur de niveau pour MetaTrader qui fournit plusieurs outils à l'intérieur d'un indicateur. Les outils disponibles sont : 1. Filtre de structure de marché. 2. Zone de repli haussier. 3. Zone de recul baissier. 4. Points pivots quotidiens 5. points pivots hebdomadaires 6. Points pivots mensuels 7. Support et résistance forts basés sur le modèle harmonique et le volume. 8. Zones au niveau de la banque. OFFRE D'UNE DURÉE LIMITÉE : L'indicateur de sup
Gartley Hunter Multi
Siarhei Vashchylka
5 (8)
Gartley Hunter Multi - An indicator for searching for harmonic patterns simultaneously on dozens of trading instruments and on all possible timeframes. Manual (Be sure to read before purchasing) | Version for MT4 Advantages 1. Patterns: Gartley, Butterfly, Shark, Crab. Bat, Alternate Bat, Deep Crab, Cypher 2. Simultaneous search for patterns on dozens of trading instruments and on all possible timeframes 3. Search for patterns of all possible sizes. From the smallest to the largest 4. A
Gold Trend 5
Sergei Linskii
5 (1)
Gold Trend - il s'agit d'un bon indicateur technique boursier. L'algorithme de l'indicateur analyse le mouvement du prix d'un actif et reflète la volatilité et les zones d'entrée potentielles. Les meilleurs signaux de l'indicateur: - Pour la VENTE = histogramme rouge + pointeur SHORT rouge + flèche de signalisation jaune dans la même direction. - Pour l'ACHETER = histogramme bleu + pointeur LONG bleu + flèche de signalisation aqua dans la même direction. Avantages de l'indicateur: 1
Was: $249  Now: $99   Market Profile defines a number of day types that can help the trader to determine market behaviour. A key feature is the Value Area, representing the range of price action where 70% of trading took place. Understanding the Value Area can give traders valuable insight into market direction and establish the higher odds trade. It is an excellent addition to any system you may be using. Inspired by Jim Dalton’s book “Mind Over Markets”, this indicator is designed to suit the
Allows multiple indicators to be combined into a single indicator, both visually and in terms of an alert. Indicators can include standard indicators, e.g. RSI, CCI, etc., and also Custom Indicators, even those purchased through Market, or where just have the ex4 file. An early alert is provided, say when 4 out 5 indicators have lined up, and a confirmed alert when all are in agreement. A‌lso features a statistics panel reporting the success of the combined indicator by examining the current cha
Plus de l'auteur
VR Black Box
Vladimir Pastushak
3.67 (3)
Conseiller VR Black Box – est une stratégie de trading puissante basée sur le suivi strict des prix. L'algorithme du programme analyse le mouvement du prix dans la situation : lorsque le prix augmente, le conseiller effectue une transaction pour acheter un instrument financier ; si la position est fermée par le Stop Loss, la transaction est inversée, et le conseiller continue à effectuer une transaction pour la vente. Toutes les transactions ont lieu automatiquement, sans intervention d'un trade
VR Lollipop MT5
Vladimir Pastushak
2.33 (6)
Faire fructifier les bénéfices - c'est la stratégie de base du robot de trading VR Lollipop . Trader dans le sens de la tendance, ajouter des positions dans le sens de la tendance, transférer des positions vers des positions sans perte et réduire les pertes aussi rapidement que possible, tels sont les principes qui sous-tendent la stratégie de trading de VR Lollipop. Le trading en suivi de tendance, combiné à trailing stop dynamique , permet de capter tous les mouvements de tendance de la manièr
VR Lollipop
Vladimir Pastushak
4.6 (10)
Faire fructifier les bénéfices - c'est la stratégie de base du robot de trading VR Lollipop . Trader dans le sens de la tendance, ajouter des positions dans le sens de la tendance, transférer des positions vers des positions sans perte et réduire les pertes aussi rapidement que possible, tels sont les principes qui sous-tendent la stratégie de trading de VR Lollipop. Le trading en suivi de tendance, combiné à trailing stop dynamique , permet de capter tous les mouvements de tendance de la manièr
VR Smart Grid
Vladimir Pastushak
4.32 (156)
VR Smart Grid est un robot de trading, capable de fermer partiellement un grand nombre de positions de marché avec un petit profit. La fermeture en petites parties permet de sortir rapidement et efficacement des positions perdantes. L'algorithme du robot contient plusieurs stratégies intelligentes de trading. La principale stratégie de trading est basée sur la construction d'un réseau de positions et la fermeture de positions en petites parties avec un profit déterminé. Le robot analyse les posi
VR Smart Grid MT5
Vladimir Pastushak
4.29 (24)
VR Smart Grid est un robot de trading, capable de fermer partiellement un grand nombre de positions de marché avec un petit profit. La fermeture en petites parties permet de sortir rapidement et efficacement des positions perdantes. L'algorithme du robot contient plusieurs stratégies intelligentes de trading. La principale stratégie de trading est basée sur la construction d'un réseau de positions et la fermeture de positions en petites parties avec un profit déterminé. Le robot analyse les posi
VR Donchian MT5
Vladimir Pastushak
4.85 (13)
L'indicateur VR Donchian est une version améliorée du canal Donchian. Les améliorations ont touché presque toutes les fonctions du canal, mais l'algorithme de fonctionnement principal et la construction du canal ont été préservés. Un changement de couleur des niveaux a été ajouté à l'indicateur de balle en fonction de la tendance actuelle - cela montre clairement au trader un changement de tendance ou un plat. La possibilité d'informer le trader de la cassure de l'un des deux niveaux de canal su
FREE
VR Sync Charts
Vladimir Pastushak
5 (4)
VR Sync Charts is a tool for synchronizing layout between windows. INDICATOR DOES NOT WORK IN STRATEGY TESTER!!! How to get a trial version with a test period, instructions, training, read the blog https://www.mql5.com/ru/blogs/post/726504 . VR Sync Charts allow you to synchronize trend levels, horizontal levels and Fibonacci layout with all charts. With this you can synchronize all standard graphic objects in the MetaTrader terminal. All your trends, Gann lines and other objects are exactly cop
VR Donchian
Vladimir Pastushak
4.92 (13)
L'indicateur VR Donchian est une version améliorée du canal Donchian. Les améliorations ont touché presque toutes les fonctions du canal, mais l'algorithme de fonctionnement principal et la construction du canal ont été préservés. Un changement de couleur des niveaux a été ajouté à l'indicateur de balle en fonction de la tendance actuelle - cela montre clairement au trader un changement de tendance ou un plat. La possibilité d'informer le trader de la cassure de l'un des deux niveaux de canal su
FREE
VR ATR Pro
Vladimir Pastushak
4.2 (5)
VR ATR Pro is a powerful professional tool for determination of target levels on a financial instrument. The indicator's effectiveness has been proved by thousands tests on real and demo accounts. VR ATR Pro is the indicator that works on real data using live true statistics. Statistics is stubborn, the usage of real statistical data in mathematical calculations allows you to calculate the exact target levels for a financial instrument. Pour un ensemble de fichiers, des instructions, un joli bon
VR Calculate Martingale
Vladimir Pastushak
5 (3)
The VR Calculate Martingale indicator is a powerful order and position calculator for calculating profit or loss. With the help of the order and position calculator, a trader can calculate the average price of any forex currency, stocks or crypto currency. Now you can connect the indicator and start superimposing virtual orders on your real orders and positions. By creating additional virtual positions, you can calculate any development of the situation. The indicator has a built-in lot calculat
VR Color Levels est un outil pratique pour ceux qui appliquent l'analyse technique à l'aide d'éléments tels que la ligne de tendance, le rectangle et le texte. Il est possible d'ajouter du texte directement au graphique et de prendre des captures d'écran. Les paramètres, les fichiers de configuration, les versions de démonstration, les instructions, la résolution de problèmes peuvent être obtenus auprès de [Blog] Vous pouvez lire ou écrire des critiques sur [lien] Version pour [MetaTrader 4]
FREE
Liste de surveillance VR et Linker - application de filtrage pour le terminal MétaTrader . Facilite la recherche des instruments financiers les plus intéressants et techniques. Ce filtre est utilisé par les traders pour négocier sur des bourses telles que bybit, la Bourse de Moscou, l'American Exchange, le marché des changes et des crypto-monnaies, le marché des métaux, et est utilisé pour le trading dans des sociétés accessoires. La sélection des instruments financiers est effectuée manuellemen
FREE
VR Sync Charts MT5
Vladimir Pastushak
5 (3)
VR Sync Charts is a tool for synchronizing layout between windows. INDICATOR DOES NOT WORK IN STRATEGY TESTER!!! How to get a trial version with a test period, instructions, training, read the blog https://www.mql5.com/ru/blogs/post/726504 . VR Sync Charts allow you to synchronize trend levels, horizontal levels and Fibonacci layout with all charts. With this you can synchronize all standard graphic objects in the MetaTrader terminal. All your trends, Gann lines and other objects are exactly cop
VR Locker MT5
Vladimir Pastushak
3.5 (4)
Le conseiller Forex VR Locker est une stratégie de trading automatique basée sur le trading de grille utilisant des verrous positifs. Un blocage positif est une situation dans un compte de trading où une position de vente est supérieure à une position d'achat et où les deux positions sont ouvertes avec le même lot. Pour un ensemble de fichiers, des instructions, un joli bonus écrivez-moi Le suivi du travail du robot peut être consulté dans le profil de l'auteur Le conseiller expert a été dével
VR Ticks MT5
Vladimir Pastushak
4.33 (3)
VR Ticks   est un indicateur spécial pour les stratégies basées sur le scalping. Grâce à cet indicateur, le trader peut voir le graphique des ticks directement sur le graphique principal de l'instrument financier. Un graphique à ticks vous permet d'entrer une position sur le marché ou de clôturer une position sur le marché aussi précisément que possible. VR Ticks trace les données des tiques sous la forme de lignes qui changent de couleur en fonction de la direction - cela vous permet de compren
FREE
VR Assistant Charts MT5
Vladimir Pastushak
5 (3)
VR Assistant Charts — Il s'agit d'un outil pratique pour les traders travaillant avec des objets graphiques dans la fenêtre du terminal de trading MetaTrader. Le programme vous permet de modifier la couleur, le style, l'épaisseur et d'autres caractéristiques des lignes de tendance, des niveaux de Fibonacci, des éventails de Gann et d'autres éléments graphiques dans le terminal MetaTrader en un seul clic de souris. Les paramètres, les fichiers de configuration, les versions de démonstration, les
FREE
VR Template switcher
Vladimir Pastushak
5 (1)
VR Template Switcher est un utilitaire puissant permettant de gérer les modèles de graphiques dans le terminal MetaTrader. Vous n'aurez plus besoin d'accomplir de nombreuses actions pour télécharger, enregistrer et supprimer des modèles. L'utilitaire VR Template Switcher vous permet d'enregistrer le modèle de graphique actuel avec tous les indicateurs, niveaux et paramètres, puis d'en charger un autre en un seul clic. Vous avez des modèles pour différents instruments financiers ? VR Template Swi
VR Grid Mt5
Vladimir Pastushak
3.43 (7)
L'indicateur VR Grid est conçu pour créer une grille graphique avec des paramètres définis par l'utilisateur. Contrairement à la grille standard , VR Grid est utilisée pour créer des niveaux circulaires . Selon le choix de l'utilisateur, le pas entre les niveaux ronds peut être arbitraire. De plus, contrairement à d'autres indicateurs et utilitaires, VR Grid maintient la position de la grille même lorsque la période de temps change ou que le terminal est redémarré. Les paramètres, les fichiers d
FREE
VR Watch list and Linker
Vladimir Pastushak
4.57 (7)
Liste de surveillance VR et Linker - application de filtrage pour le terminal MétaTrader . Facilite la recherche des instruments financiers les plus intéressants et techniques. Ce filtre est utilisé par les traders pour négocier sur des bourses telles que bybit, la Bourse de Moscou, l'American Exchange, le marché des changes et des crypto-monnaies, le marché des métaux, et est utilisé pour le trading dans des sociétés accessoires. La sélection des instruments financiers est effectuée manuellemen
FREE
VR Color Levels est un outil pratique pour ceux qui appliquent l'analyse technique à l'aide d'éléments tels que la ligne de tendance, le rectangle et le texte. Il est possible d'ajouter du texte directement au graphique et de prendre des captures d'écran. Les paramètres, les fichiers de configuration, les versions de démonstration, les instructions, la résolution de problèmes peuvent être obtenus auprès de [Blog] Vous pouvez lire ou écrire des critiques sur [lien] Version pour [MetaTrader 5]
FREE
VR Alert MT5
Vladimir Pastushak
5 (1)
The VR Alert indicator utility is designed to monitor the price or other indicators and to inform the trader when the price or indicator reaches the given level. The signal levels can be set not only horizontally but also inclined. Thus, the trader gets the opportunity to receive notifications from the inclined trend levels. Thanks to the VR Alert utility, you will no longer need to sit near the monitor for a long time. You can calmly do about your household chores, perform your work duties and
VR Grid
Vladimir Pastushak
5 (1)
L'indicateur VR Grid est conçu pour créer une grille graphique avec des paramètres définis par l'utilisateur. Contrairement à la grille standard , VR Grid est utilisée pour créer des niveaux circulaires . Selon le choix de l'utilisateur, le pas entre les niveaux ronds peut être arbitraire. De plus, contrairement à d'autres indicateurs et utilitaires, VR Grid maintient la position de la grille même lorsque la période de temps change ou que le terminal est redémarré. Les paramètres, les fichiers d
FREE
VR Cub
Vladimir Pastushak
VR Cub est un indicateur permettant d'obtenir des points d'entrée de haute qualité. L'indicateur a été développé pour faciliter les calculs mathématiques et simplifier la recherche de points d'entrée dans un poste. La stratégie de trading pour laquelle l'indicateur a été rédigé prouve son efficacité depuis de nombreuses années. La simplicité de la stratégie de trading est son grand avantage, qui permet même aux traders débutants de négocier avec succès avec elle. VR Cub calcule les points d'ouve
VR Template Switcher est un utilitaire puissant permettant de gérer les modèles de graphiques dans le terminal MetaTrader. Vous n'aurez plus besoin d'accomplir de nombreuses actions pour télécharger, enregistrer et supprimer des modèles. L'utilitaire VR Template Switcher vous permet d'enregistrer le modèle de graphique actuel avec tous les indicateurs, niveaux et paramètres, puis d'en charger un autre en un seul clic. Vous avez des modèles pour différents instruments financiers ? VR Template Swi
VR Atr Pro MT5
Vladimir Pastushak
5 (2)
VR ATR Pro is a powerful professional tool for determination of target levels on a financial instrument. The indicator's effectiveness has been proved by thousands tests on real and demo accounts. VR ATR Pro is the indicator that works on real data using live true statistics. Statistics is stubborn, the usage of real statistical data in mathematical calculations allows you to calculate the exact target levels for a financial instrument. Pour un ensemble de fichiers, des instructions, un joli bon
VR Pivot
Vladimir Pastushak
VR Pivot is an indicator of key pivot points. Pivot points are a special type of support and resistance levels that are used to determine the strongest price zones. Professional traders use pivot levels to determine prices at which there is a high probability of a price reversal. The levels are calculated using special mathematical formulas, which include the closing, opening, high, and low prices of the previous time period. The most effective is the daily period. It is important to note that a
The VR Calculate Martingale indicator is a powerful order and position calculator for calculating profit or loss. With the help of the order and position calculator, a trader can calculate the average price of any forex currency, stocks or crypto currency. Now you can connect the indicator and start superimposing virtual orders on your real orders and positions. By creating additional virtual positions, you can calculate any development of the situation. The indicator has a built-in lot calculat
VR Close Orders MT5
Vladimir Pastushak
1 (1)
The VR Close orders script is designed to close positions in the terminal at a profit or loss mark set by the trader. The program is written as a script and can work together on the same chart with any other indicators and expert advisors. The program has a simple visual panel and is easy to configure with the mouse. With this program's help, the trader can automatically close positions and delete orders depending on the conditions set.  There is often a situation when you need to close position
FREE
VR Ticks
Vladimir Pastushak
VR Ticks est un indicateur spécial pour les stratégies basées sur le scalping. Grâce à cet indicateur, le trader peut voir le graphique des ticks directement sur le graphique principal de l'instrument financier. Un graphique à ticks vous permet d'entrer une position sur le marché ou de clôturer une position sur le marché aussi précisément que possible. VR Ticks trace les données des tiques sous la forme de lignes qui changent de couleur en fonction de la direction - cela vous permet de comprendr
FREE
The VR Object Delete All script solves the problem of garbage on the chart. it is often necessary to completely clear the chart of everything that is put on it, comments, lines, objects. The script completely deletes everything, even those objects that are not visible. When working, VR Object Delete All writes everything it does in the terminal log, as well as the names of objects to delete. Displays the number of deleted objects as a separate line. in case of any errors, it will display an erro
FREE
Filtrer:
ynotnA
71
ynotnA 2021.10.19 21:47 
 

L'utilisateur n'a laissé aucun commentaire sur la note

Wan Ping Fei
1690
Wan Ping Fei 2020.04.06 02:32 
 

L'utilisateur n'a laissé aucun commentaire sur la note

Répondre à l'avis
Version 23.110 2023.11.13
The indicator is compiled in build 4061 with x64 Regular for compatibility with all processors.
Version 23.90 2023.09.03
Optimized the code for calculating the levels of the Donchan channel

Changes made to sending notifications:

Removed buttons for enabling notifications from the chart. Previously, there were notification buttons on the chart; when a signal was triggered, the buttons were released. These buttons were garbage on the chart and obscured some of the information. Now a trader can enable notifications directly in the indicator settings.

Added setting (Number of displayed calculations (-1 all)) - this setting allows you to limit the indicator's calculation history. In cases when it is necessary to consider indicator signals throughout the history, set -1, in other cases, set the required number of bars for calculation. This setting allows you to minimize the indicator calculation time.

In order to save system resources, all code working for system statistics has been removed.
Version 21.80 2021.08.17
The program is compiled in the latest version of the MetaTrader terminal
Version 21.40 2021.04.22
The indicator for the strategy has been rewritten.
The code is optimized.
All previously identified issues have been fixed.
Version 20.60 2020.06.24
Code optimization for new build terminal
Version 20.57 2020.05.27
Code optimization
Error correction