ForexToolsFree
- Indicateurs
- Kourosh Hossein Davallou
- Version: 1.2
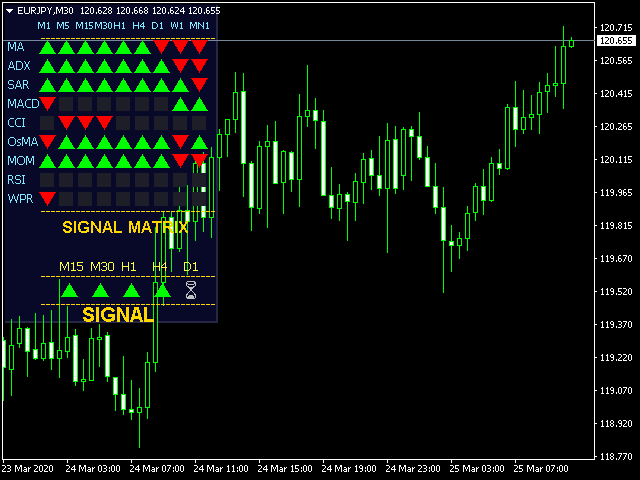
This Indicator works based on several well-known Technical Indicators in different time frame Works.
These Technical Indicators include:
· Moving Averages(MA)
· Average Directional Index (ADX)
· Parabolic Stop and Reverse (SAR)
· Moving Average Convergence Divergence (MACD)
· Commodity Channel Index (CCI)
· Oscillator of a Moving Average (OsMA)
· Momentum(MOM)
· Relative Strength Index (RSI)
· Williams' Percent Range (WPR)
This free version Indicator . you can download full version .
https://www.mql5.com/en/market/product/47636#