RangeBorder Buy Sell Non Repaint
- Indicateurs
- Wartono
- Version: 1.20
- Mise à jour: 27 janvier 2020
- Activations: 10
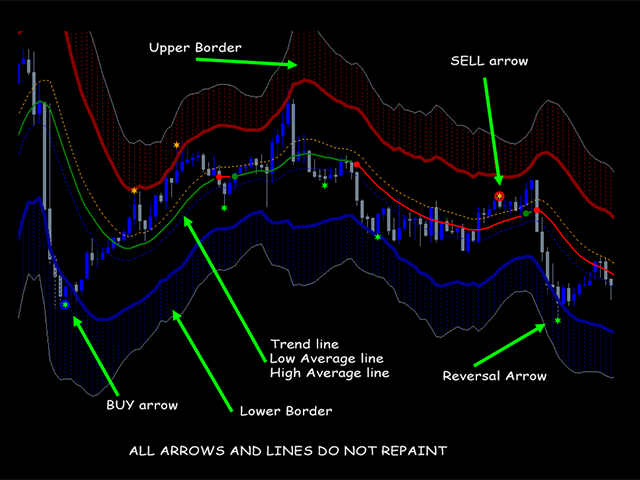
Some informations on the chart with the single attachment. RangeBorder Buy Sell (RBBS) Non Repaint Indicator will provide trend line, buy sell arrows,reversal arrows, range channel, order exit area,high average price line and low average price line.All arrows and lines don't repaint and not lagging. Once candle closed it won't repaint.
Reading Indicator:
1. Small Stars , Indicates oversold and overbought with certain logic and price may reverse when this small star triggers. Useful to identify the current market price for entry or exit order.
2. Red and Blue Circle Arrows , They are entry signals. No repaint arrows once candle closed. This is the combination of Multi Moving Averages, Bollinger Bands ,Stochastics, and Price Action.
3. Middle Line. Default color Green and Red. This is Trend Lines and can be adjusted externally.
4. High-Low Dot Lines. Located near the middle line. Upper dot Line is the Average of High price on the current chart. And Lower Dot Line is the Average of Low price on the current chart.
5. Outer Histograms. This is the market Border Channels . Began the wide inner lines to SlateGray outer lines. Upper Histogram indicates that price currently on the overbought area and vise versa Lower Histogram indicates that price currently on oversold area. If price cross over the SlateGray outer lines, it's strongly oversold or overbought. The time to exit order or the time to wait the best moment to enter the market.
How to use:
Recommended TimeFrame M15 or above
Any Currency pair
Order Entry.
Buy Entry Signal arrow is always below the trend line ( middle line) and Sell entry Signal arrow is always above the
trend line.
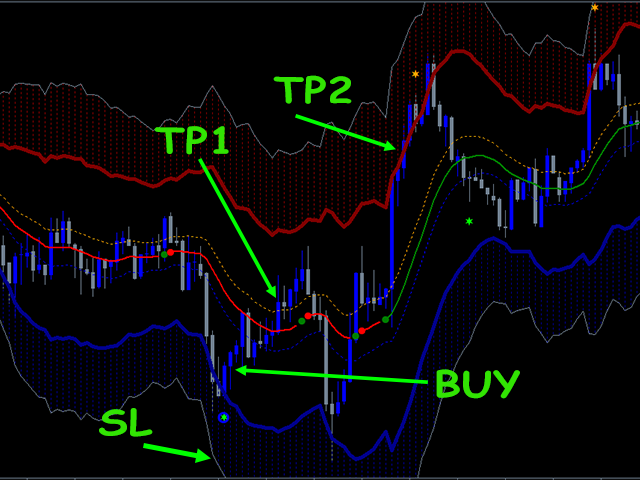
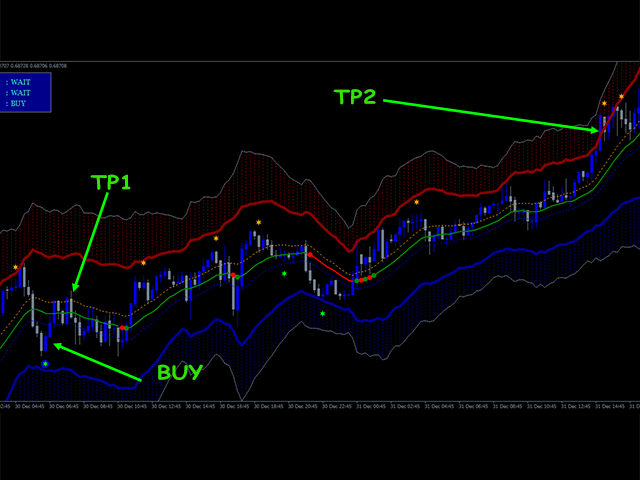
- Order Buy when Buy Entry Signal triggers.
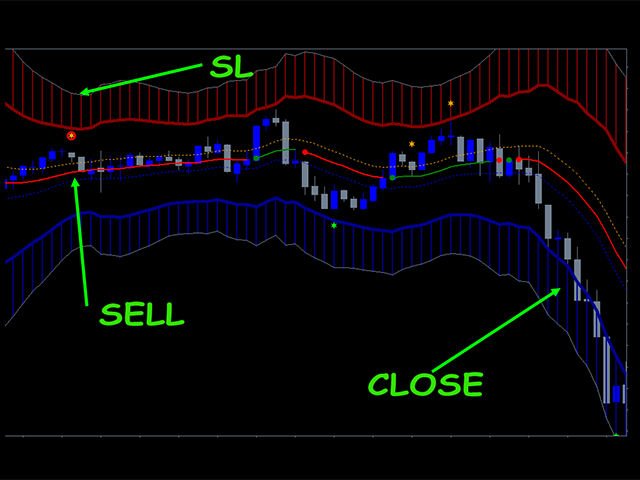
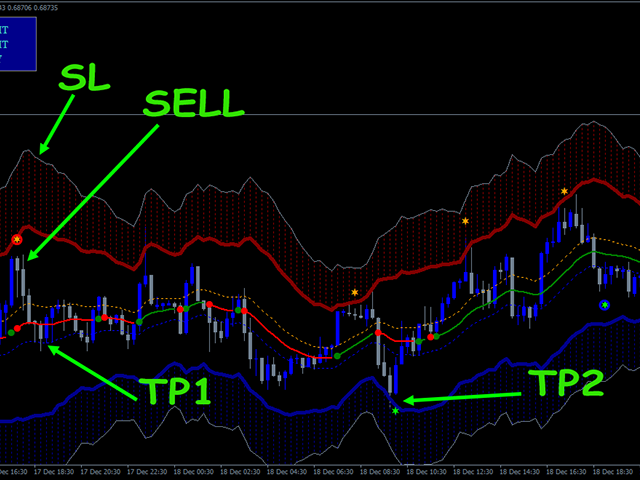
- Order Sell when Buy Entry signal triggers.
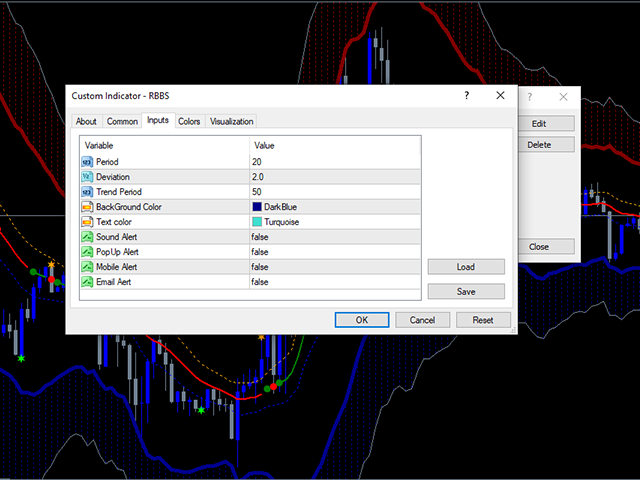
Alerts included to get notifications.PopUp,Sound,Email and mobile alerts.
Recommended to wait for candle closed because the arrow may triggers starting from the candle started.
Order Exit can use some the following options depending on the price condition:
- when the opposite small star triggers.
- when the price crossover the high-low dot line.
- when the price crossover the opposite inner wide line on the histogram border channel.
Examples can be seen on the screenshot images.
Please note to understand that no perfect indicator. In certain case,there may be a false entry signal .Trader involvement will be very useful to increase the profit opportunity. One of the most important is that arrows and lines won't repaint. So it can be said it is " the real arrows and lines" that will help the trader easier to make a decision.

