• Aperçu
  • Avis (2)
  • Commentaires (3)
  • Nouveautés

MultiCharts MT4

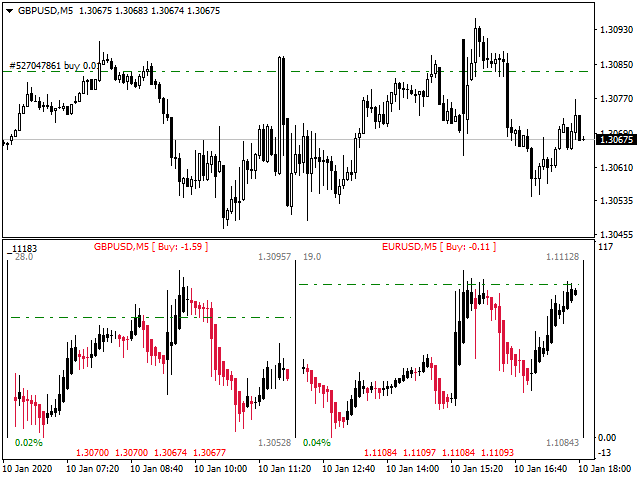
MultiCharts - indicateur multidevises pour l'analyse visuelle de plusieurs instruments de trading.

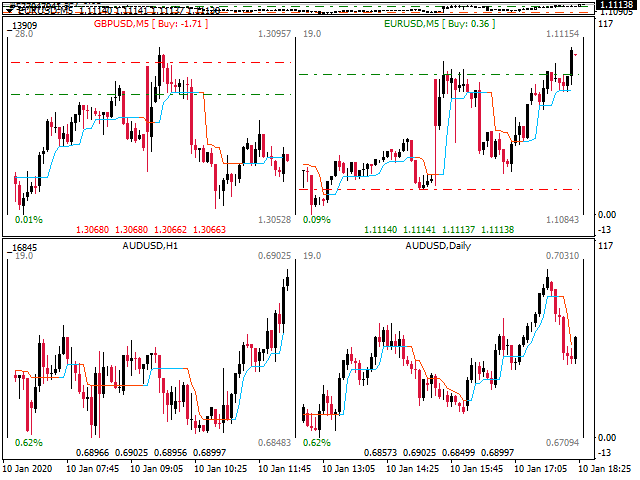
  • construit des graphiques des instruments sélectionnés dans une fenêtre séparée
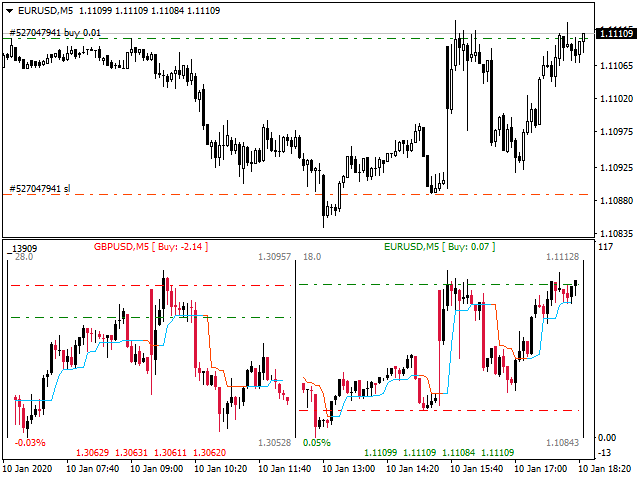
  • montre les niveaux de tous les ordres établis
  • affiche le résultat, le nombre et le type de positions ouvertes
  • construit des indicateurs techniques de la Moving Average, Trend filter et des graphiques Heiken Ashi
  • montre la propagation, OHLC - prix de la barre actuelle
  • montre le changement de prix relatif pour le jour en cours *

* - pour les périodes jusqu'à et y compris Daily, le changement de prix est calculé pour le jour en cours. Au-dessus Daily - pour la période sélectionnée (semaine en cours, mois en cours, respectivement).

Toutes les propriétés répertoriées peuvent être facilement modifiées par l'utilisateur à tout moment via les paramètres d'entrée de l'indicateur.

  • Bear candle color - couleur pour les bougies baissières
  • Bull candle color - couleur pour les bougies haussières
  • Labels color - couleur du texte (nom de l'instrument, OHLC)
  • Labels TP color - la couleur du texte si le prix approche du niveau de Take Profit
  • Labels SL color - la couleur du texte si le prix s'approche du niveau Stop Loss
  • Profit color - la couleur du texte, s'il y a un profit pour le symbole commercial
  • Loss color - couleur du texte s'il y a une perte pour un symbole commercial
  • Text color - couleur du texte (propagation, changement de prix, bordure de cellule)
  • Orders line color - couleur pour les lignes de positions et les ordres en attente
  • Stops line color - couleur pour les lignes des niveaux Stop Loss et Take Profit
  • Fast MA color - couleur de la ligne de l'indicateur Moving Average, Trend filter
  • Slow MA color - couleur de la ligne de l'indicateur Moving Average, Trend filter
  • Fast MA period - période de la moyenne mobile «rapide»
  • Slow MA period - la période de la moyenne mobile «lente»
  • MA method - méthode de moyennage
  • Applied price - un ensemble de prix pour le calcul de l'indicateur
  • Trend filter period - période indicatrice Trend filter (la période recommandée pour la saisie par l'indicateur est de 2 à 5)
  • Trend filter MA metod - méthode de moyennage
  • SDL period - période de l'indicateur SDL
  • SDL MA method - méthode de calcul de la moyenne
  • SDL applied price - un ensemble de prix pour le calcul de l'indicateur
  • Add Indicator - afficher les indicateurs techniques la Moving Average, SDL, Trend filter ou des graphiques Heiken Ashi
  • Show OHLC prices - afficher les prix OHLC
  • Draw orders - afficher les lignes de commande
  • Monitoring positions - afficher le nombre et le total des profits / pertes sur les positions ouvertes
  • Show profit - méthode d'affichage du résultat sur les positions ouvertes (en points ou dans la devise du dépôt)
  • Show growth - montrer le changement de prix relatif
  • Orders line style - style de ligne pour les commandes
  • Allow Email notifications - envoyer des notifications par e-mail lorsque le filtre de tendance, les signaux de l'indicateur SDL apparaissent
  • Allow Alert - utiliser une alerte lorsque le filtre de tendance, les signaux de l'indicateur SDL apparaissent
  • Allow Push notifications - envoyer des notifications au terminal mobile lorsque le filtre de tendance, les signaux de l'indicateur SDL apparaissent
  • Broker company label - nom de l'entreprise à utiliser dans les notifications Push, par exemple : (MQ MT4) - 'EURUSD,H1: Possible change trend direction on uptrend!'  Si vous mettez le symbole -?, alors le nom de l'entreprise par défaut sera utilisé
  • UID - numéro d'indicateur unique. S'il y a plus d'une copie de l'indicateur sur le graphique de l'instrument, alors pour chaque copie, il est nécessaire de définir son propre numéro unique
  • Open chart in the... - ouvrir la fenêtre du graphique en cliquant sur le nom du symbole dans la fenêtre actuelle ou dans une nouvelle fenêtre
  • Chart 1....Chart 6 - noms des symboles de trading (EURUSD, M5 ... USDCAD, H1)Allowed pairs for Notifications - les noms des paires de trading pour lesquelles les notifications sont autorisées. Précisez, séparées par un espace, les paires sur lesquelles les notifications sont autorisées, par exemple : EURUSD, M5 GBPUSD, H1 USDJPY, M15 Si le paramètre est laissé vide, les notifications seront autorisées pour toutes les paires spécifiées dans les paramètres de l'indicateur (Chart1...Chart6)


Produits recommandés
Fibonacci Wave Bands Indicator The Fibonacci Wave Bands indicator utilizes Fibonacci ratios to create dynamic bands around a central moving average. These bands are derived from key Fibonacci ratios (typically 38.2%, 50%, 61.8%) and adapt to market volatility, offering insights into potential support and resistance zones. Key Features: Fibonacci Levels: The indicator plots multiple bands above and below a central moving average based on Fibonacci ratios. Dynamic Support and Resistance: Bands ser
UPD1 Fibo Levels
Vitaliy Kuznetsov
5 (1)
L'indicateur analyse le nombre de bougies spécifié et construit des niveaux de Fibonacci basés sur le maximum-minimum. Comme les niveaux sont reconstruits, nous sommes intéressés par la partie droite de la fourchette. Le prix est magnétique par rapport aux niveaux et réagit à un contact. Utilisez cet outil pour trouver un point d'entrée dans la tendance après une correction. Si, à gauche, nous constatons que les niveaux sont parfaitement relevés, nous pouvons supposer que nous avons trouvé la f
FREE
Simply drop the indicator to the chart and Fibonacci levels will be shown automatically! The indicator is developed for automatic drawing of Fibonacci levels on the chart. It provides the abilities to: Select the standard Fibo levels to be shown Add custom levels Draw the indicator on the timeframes other than the current one. For example, the indicator is calculated on the weekly period (W1) and is displayed on the monthly period (MN1) Select the timeframes the indicator will be available on Ca
Free automatic Fibonacci is an indicator that automatically plots a Fibonacci retracement based on the number of bars you select on the BarsToScan setting in the indicator. The Fibonacci is automatically updated in real time as new highest and lowest values appears amongst the selected bars. You can select which level values to be displayed in the indicator settings. You can also select the color of the levels thus enabling the trader to be able to attach the indicator several times with differe
FREE
AutoPivot
Hafis Mohamed Yacine
This indicator will draw monthly, weekly, and daily pivot. Pivot line will be calculated automatically again when the period ends. Auto Pivot Metatrader 4 Indicator The Auto Pivot indicator for Metatrader 4 automatically updates the pivot point (PP), support (S1,S2,S3) and resistance levels (r1,r2,r3) every day. Price above the pivot point means positive while price below the pivot point means negative. S3 indicates extremely oversold while price above resistance r3 means extremely overbought.
Cet indicateur fonctionne en conjonction avec la théorie des vagues d'Elliott de deux manières : Mode automatique : Dans ce mode, l'indicateur détectera automatiquement les cinq vagues motrices sur le graphique conformément à la théorie des vagues d'Elliott. Il fournira des prédictions et identifiera les zones potentielles de retournement. De plus, il a la capacité de générer des alertes et des messages push pour informer les traders des développements importants. Cette fonctionnalité automatiqu
Auto Fibo mq
DMITRII GRIDASOV
"Auto FIBO" indicator    - is great auxiliary tool in trading! Indicator automatically calculate and place on chart Fibo levels and local trend lines (red color) Fibonacci levels indicate key areas where price can reverse Most important levels are 23.6%, 38.2%, 50% and 61.8% You can use it   for reversal scalping  or for zone grid trading There are plenty of opportunities to  improve your current system using Auto FIBO indicator as well // More great Expert Advisors and Indicators are availab
Fibonacci SR Indicator This indicator creates support and resistance lines. This indicator is based on Fibonacci Retracement and Extension levels. It will consider many combinations of the Fibonacci levels and draw support/resistance lines based on these. This indicator uses tops and bottoms drawn by the ZigZag indicator in its calculations. The ZigZag can also be drawn on the chart, if necessary. The indicator considers many combinations of past reversal points and Fibonacci ratio levels, and
FREE
Le Capteur de Tendance : La Stratégie du Capteur de Tendance avec Indicateur d'Alerte est un outil d'analyse technique polyvalent qui aide les traders à identifier les tendances du marché et les points d'entrée et de sortie potentiels. Elle présente une stratégie dynamique de Capteur de Tendance, s'adaptant aux conditions du marché pour une représentation visuelle claire de la direction de la tendance. Les traders peuvent personnaliser les paramètres selon leurs préférences et leur tolérance
FREE
Possible Price reversals levels - based on  Fibonacci + Support +  Resistance Levels Auto levels drawn based on input index (Bars Count )  ---->>> Price Over 50% Fibo line ---> UP TREND ---> BUY when price drop near Support Lines  ---->>> Price Down 50% Fibo line ---> DOWN TREND ---> SELL when price goes up  near Resistance Lines  --->>> The more close price levels ----> the more possibility for price reversals --->>> are you a scalper --> try it on M1 charts with big index like 5000 bars  or
The indicator is designed for determining Fibonacci levels. Does not repaint/redraw The blue level shows the zero Fibonacci value (it is also the Pivot level) Red levels show calculated Fibonacci levels (used as a rollback or reversal point) Automatic period detection (periods can be entered manually) Adjustable display calculation method. Settings BarsHistory - the number of bars to be used to display the indicator. Method - method of calculation. AutoPeriod - automated period calculation (true
Capital Pivot
Mr Nisit Noijeam
Pivot Points และระดับ (Support) และ(Resistance) บนแผนภูมิการเทรดใน MetaTrader 4 สำหรับตลาด Forex : คำนวณ Pivot Points : สคริปต์คำนวณจุด Pivot โดยใช้ข้อมูลราคาประวัติศาสตร์ เช่น ราคาเปิด, ราคาสูงสุด, ราคาต่ำสุด, และราคาปิด จากช่วงเวลาที่กำหนด (เช่น วัน, ชั่วโมง, ฯลฯ) จุด Pivot และระดับต่างๆ เช่น R1, R2, R3 (ระดับการต้านทาน) และ S1, S2, S3 (ระดับการสนับสนุน) ถูกคำนวณออกมา แสดงบนแผนภูมิ : หลังจากคำนวณจุด Pivot และระดับต่างๆ, สคริปต์จะแสดงเส้นเหล่านี้บนแผนภูมิ MT4 เพื่อช่วยให้นักเทรดสามารถเห็นจุดที่
The indicator detects and displays the 5-0 harmonic pattern on the chart according to the scheme provided in the screenshot. The pattern is plotted by the extreme values of the ZigZag indicator (included in the resources, does not require additional installation). After detecting the pattern, the indicator notifies of that by the pop-up window, a mobile notification and an email. The indicator highlights not only the complete figure, but also the time of its formation. During the formation the f
Strong Retracement Points Pro demo edition! SRP (Strong Retracement/Reversal Points) is a powerful and unique support and resistance indicator. It displays the closest important levels which we expect the price retracement/reversal! If all level are broken from one side, it recalculates and draws new support and resistance levels, so the levels might be valid for several days depending on the market! If you are still hesitating to start using this wonderful tool, you can check this link to see h
ZigZag Professional
Dmitriy Kashevich
5 (1)
the zigzag indicator draws lines on the chart from the highest point to the lowest There are built-in fibonacci levels built-in sound alert the indicator highlights trends on small timeframes with a thin line and trends highlights with a coarse line Fibonacci levels can be turned on and off in the settings settings are very simple and clear the same sound alert can be turned on and off, you can change the colors of the lines.
Fibonaccitools
Aymn Sʿyd Ahmd Hsn Alkwmy
Fibonacci retracements are popular tools that traders can use to draw support lines, identify resistance levels, place stop-loss orders, and set target prices. A Fibonacci retracement is created by taking two extreme points on a stock chart and dividing the vertical distance by the key Fibonacci ratios of 23.6%, 38.2%, 50%, 61.8%, and 100%. Fibonacci tools indicator will Draw Fibonacci Tools e.g. Retracement, Arc, Fan, Expansion, TimeZones. Based on zigzag indicator"
Auto AndrewFork
Noor Ghani Rahman
1 (1)
Auto Pitchfork Indicator The indicator calculate the Pitch fork for the previous Day (Selectable) with multiple Support and Resistance lines from the Median price which acts as Magnet for the Price that if price touch the above warning (1) or below warning (1) lines and not cross up or down then there is maximum possibilities that it will return to the Median Line, and thus maintain the Price Action in Cyclic Pattern to the Market Move. You are able to select how many warning lines you want to k
Pivot Point Multi Method is a fully automatic pivot point indicator and indicate support and resistances (S1,S2,S3,S4,R1,R2,R3,R4) based on four Methods that you can select on of them Pivot point detection and drawing support resistances Methods( Classic ,Camarilla ,Woodie ,Fibonacci) Pivot Point Multi Method is working on all time frames and all currency pairs and gold silver and crypto currencies . Recommended Setting : Pivot_Method    select one of the methods ( Classic ,Camarilla ,Woodi
Индикатор высчитывается по сложному авторскому алгоритму. Он строится с учетом тенденции по зонам перекупленности перепроданности объёмов . Это позволяет выявлять дивергенцию объёмов , выявить так называемые приседающие бары. Также он определяет уровни входа в рынок и цели. Средняя линия канала является предполагаемым уровнем отката. RPeriod- период расчета индикатора Indicator_Level - уровень зон перекупленности перепроданности Draw Fibo Levels - отображаем целевые уровни Fibo Level Col
Trend Ray
Andriy Sydoruk
The indicator shows the potential trend direction by cyclical-wave dependence. Thus, all the rays of the intersection will be optimal rays, in the direction of which the price is expected to move, taking into account the indicator period. Rays can be used as a direction for potential market movement. But we must not forget that the approach must be comprehensive, the indicator signals require additional information to enter the market.
Description: The indicator measures, through the zigzag indicator, the levels of trend or correction. It shows in the chart the levels of each low or high detected. KEY LINKS:   How to Install  –  Frequent Questions  -  All Products  How is this indicator useful? This indicator determines, depending on Zigzag parameter if a trend is beginning, developing, or ending This indicator determines the direction of the trend Components Levels as positive or negative numbers, depending on the direction
FREE
The indicator detects and displays Shark harmonic pattern (see the screenshot). The pattern is plotted by the extreme values of the ZigZag indicator (included in the resources, no need to install). After detecting the pattern, the indicator notifies of that by a pop-up window, a mobile notification and an email. The indicator highlights the process of the pattern formation and not just the complete pattern. In the former case, it is displayed in the contour triangles. After the pattern is comple
Key level wedge pro
Presley Annais Tatenda Meck
5 (1)
We have combined all of our beloved indicators the likes of: Key level order block , Key level supply and demand , Key level liquidity grab and Key level wedge into one single indicator and dashboard. Whats new Dashboard : There is an easy access dashboard for all your needs. Multi-timeframe button : There is now a multi-timeframe option for Order Blocks and Supply and demand zones, making it easy to see higher timeframe zones easily on the current timeframe by just clicking the desired timefr
Average Daily Weekly Monthly Range Alerts. The most complete multi-period dynamic range indicator with full alert options. Visually displays the Average Range lines on chart + real time distances to the Range Highs and Lows. Notifications are sent when the average ranges are hit. An essential tool for any serious trader! Average period ranges, especially the ADR (Average Daily Range) for day traders, are one of the most useful and consistently reliable indicators available to traders. Always a
FiboZag
Andriy Sydoruk
Indicator FiboZag - transfer the indicator to the chart and the Fibonacci levels will be built automatically on the last ZigZag turn. The main advantage lies in the correct construction of Fibonacci levels and markup of price levels. Simple, visual and effective use. The indicator is not redrawn and does not lag. Works on all currency pairs and on all timeframes.
Market Structure Zig Zag
Lesedi Oliver Seilane
4.65 (26)
Free Market structure zig zag to assist in price action trading the screenshots describe how to use and how to spot patterns new version comes with alerts, email alert and  push notification alert can be used on all pairs  can be used on all timeframes  you can add additional confirmation indicators the indicator shows you your higher high and low highs as well as your lower lows and lower highs  the indication makes price action analysis easier to spot.
FREE
The indicator detects and displays 3 Drives harmonic pattern (see the screenshot). The pattern is plotted by the extreme values of the ZigZag indicator (included in the resources, no need to install). After detecting the pattern, the indicator notifies of that by a pop-up window, a mobile notification and an email. The indicator highlights the process of the pattern formation and not just the complete pattern. In the former case, it is displayed in the contour triangles. After the pattern is com
Candle EA MT4
Mansour Babasafary
4.43 (49)
This expert is based on patterns The main patterns of this specialist are candlestick patterns Detects trends with candlestick patterns It has a profit limit and a loss limit, so it has a low risk The best time frame to use this expert is M30 time frame The best currency pairs to use with this expert is the EURUSD, GBPUSD, AUDUSD, USDCAD currency pairs Attributes: Can be used in the EURUSD, GBPUSD, AUDUSD, USDCAD  currency pairs Can be used in M30, H1, H4 time frames Has profit limit an
Basic Fibonacci Calculation Indicator  shows Trend, Stoploss, Profit 1,2,3, will show you your daily Highs and your Daily Lows , it will also show you where it expects the price to move to.  best time frame is H1 or higher .  For  a better system that also includes my Non-repaint Indicator please check out my paid Fibo Indicator  https://www.mql5.com/en/market/product/82323
FREE
This is a new strategy for SUPPLY DEMAND areas It is based on a calculation using the tick volume to detect the big price action in market for both bear /bull actions this smart volume action candles are used to determine the supply and demand areas prices in between main supply and demand lines indicate sideway market  up arrows will be shown when prices moves above the main supply and the secondary supply lines Down arrows will be shown when prices moves below the main demand and the secondary
Les acheteurs de ce produit ont également acheté
Atomic Analyst
Issam Kassas
5 (2)
Tout d'abord, il convient de souligner que cet indicateur de trading n'est ni repainting, ni redrawing et ne présente aucun délai, ce qui le rend idéal à la fois pour le trading manuel et automatisé. Manuel de l'utilisateur : réglages, entrées et stratégie. L'Analyste Atomique est un indicateur d'action sur les prix PA qui utilise la force et le momentum du prix pour trouver un meilleur avantage sur le marché. Équipé de filtres avancés qui aident à éliminer les bruits et les faux signaux, et à
Scalper Inside PRO
Alexey Minkov
4.73 (56)
An exclusive indicator that utilizes an innovative algorithm to swiftly and accurately determine the market trend. The indicator automatically calculates opening, closing, and profit levels, providing detailed trading statistics. With these features, you can choose the most appropriate trading instrument for the current market conditions. Additionally, you can easily integrate your own arrow indicators into Scalper Inside Pro to quickly evaluate their statistics and profitability. Scalper Inside
Actuellement 20% de réduction ! La meilleure solution pour tout débutant ou trader expert ! Ce logiciel de tableau de bord fonctionne sur 28 paires de devises. Il est basé sur 2 de nos principaux indicateurs (Advanced Currency Strength 28 et Advanced Currency Impulse). Il donne un excellent aperçu de l'ensemble du marché Forex. Il montre les valeurs de l'Advanced Currency Strength, la vitesse de mouvement des devises et les signaux pour 28 paires de devises dans tous les (9) délais. Imagine
Enigmera
Ivan Stefanov
5 (3)
ENIGMERA : Le cœur du marché https://www.enigmera.com Introduction Cet indicateur et ce système de trading constituent une approche remarquable des marchés financiers. ENIGMERA utilise les cycles fractals pour calculer avec précision les niveaux de support et de résistance. Il indique la phase d'accumulation authentique et donne une direction et des objectifs.  Un système qui fonctionne que nous soyons dans une tendance ou une correction.  Comment fonctionne-t-il ? ENIGMERA comprend trois l
TPSproTREND PrO
Roman Podpora
4.79 (19)
TPSpro TREND PRO   est un indicateur de tendance qui analyse automatiquement le marché et fournit des informations sur la tendance et chacun de ses changements, ainsi que des signaux pour entrer dans des transactions sans redessiner ! L'indicateur utilise chaque bougie et les analyse séparément. faisant référence à différentes impulsions - impulsion ascendante ou descendante. Points d'entrée précis dans les transactions sur les devises, les crypto-monnaies, les métaux, les actions, les indices 
Dynamic Forex28 Navigator - L'outil de trading Forex de nouvelle génération. ACTUELLEMENT 49 % DE RÉDUCTION. Dynamic Forex28 Navigator est l'évolution de nos indicateurs populaires de longue date, combinant la puissance de trois en un : Advanced Currency Strength28 Indicator (695 avis) + Advanced Currency IMPULSE avec ALERT (520 avis) + CS28 Combo Signals (Bonus). Détails sur l'indicateur https://www.mql5.com/en/blogs/post/758844 Qu'offre l'indicateur de force de nouvelle génération ? T
FX Volume
Daniel Stein
4.58 (33)
Obtenez votre mise à jour quotidienne du marché avec des détails et des captures d'écran via notre Morning Briefing ici sur mql5 et sur Telegram ! FX Volume est le PREMIER et SEUL indicateur de volume qui fournit un VRAI aperçu du sentiment du marché du point de vue d'un courtier. Il fournit des informations impressionnantes sur la façon dont les acteurs institutionnels du marché, comme les courtiers, sont positionnés sur le marché des changes, bien plus rapidement que les rapports COT. Voir c
TPSpro RFI Levels
Roman Podpora
4.82 (22)
INSTRUCTIONS       RUS   -   ANGLAIS       Il   est recommandé de l'utiliser avec un indicateur       -       TPSpro   TENDANCE PRO -   Version MT4         Un élément clé du trading est constitué par les zones ou les niveaux à partir desquels les décisions d'achat ou de vente d'un instrument de trading sont prises. Malgré les tentatives des principaux acteurs de dissimuler leur présence sur le marché, ils laissent inévitablement des traces. Notre tâche était d'apprendre à identifier ces traces
Ultimate Gold Advisor pour MetaTrader 4 L'Ultimate Gold Advisor est un outil technologique avancé conçu pour optimiser l'expérience de trading sur MetaTrader 4. Créé pour répondre aux besoins des traders expérimentés, cet indicateur combine précision, analyse sophistiquée et fonctionnalité polyvalente, offrant un soutien pour des décisions de trading éclairées. Idéal pour le trading de l'or, mais applicable à une large gamme d'actifs, l'Ultimate Gold Advisor peut vous aider à améliorer vos stra
Gold Channel is a volatility-based indicator, developed with a specific timing algorithm for the XAUUSD pair, which consists of finding possible corrections in the market. This indicator shows two outer lines, an inner line (retracement line) and an arrow sign, where the theory of the channel is to help identify overbought and oversold conditions in the market. The market price will generally fall between the boundaries of the channel. If prices touch or move outside the channel it is a tra
GOLD Impulse with Alert
Bernhard Schweigert
4.56 (9)
Cet indicateur est une super combinaison de nos 2 produits Advanced Currency IMPULSE with ALERT  +   Currency Strength Exotics . Il fonctionne pour tous les cadres temporels et montre graphiquement l'impulsion de force ou de faiblesse pour les 8 principales devises plus un symbole ! Cet indicateur est spécialisé pour montrer l'accélération de la force des devises pour tout symbole comme l'or, les paires exotiques, les matières premières, les indices ou les contrats à terme. C'est le premi
AW Prime Oscillator
AW Trading Software Limited
5 (1)
Une combinaison de deux oscillateurs. Le premier affiche les points d'entrée, le second montre la tendance actuelle. L'indicateur peut afficher les signaux d'oscillateur par des flèches dans deux modes, tous les signaux d'oscillateur rapides ou les signaux uniquement dans la direction de la tendance actuelle. Il dispose d'un panneau multi-périodes et de trois types de notifications de signal. Avantages: Convient au day trading et au scalping Filtrage des tendances Configuration simple et sensib
Best Currency Strength Indicator
Tumelo Patrick Rakotsoane
4.59 (46)
Advanced Currency Strength Indicator The Advanced Divergence Currency Strength Indicator. Not only it breaks down all 28 forex currency pairs and calculates the strength of individual currencies across all timeframes , but, You'll be analyzing the WHOLE forex market in 1 window (In just 1 minute) . This indicator is very powerful because it reveals the true movements of the market.  It is highly recommended to  analyze charts knowing the performance of individual currencies or the countries ec
Allows multiple indicators to be combined into a single indicator, both visually and in terms of an alert. Indicators can include standard indicators, e.g. RSI, CCI, etc., and also Custom Indicators, even those purchased through Market, or where just have the ex4 file. An early alert is provided, say when 4 out 5 indicators have lined up, and a confirmed alert when all are in agreement. A‌lso features a statistics panel reporting the success of the combined indicator by examining the current cha
TrendfollowerSR
Paul Reymkhe
4.88 (90)
Take Your Trading Experience To the Next Level ! and get the exclusive TFSR-Analyzer for free !    So you have all these outstanding features  on up to 20 symbols and all timeframes in a smart and clear Design. Correct identification of the trends  in stock investments are pivotal and TrendFollowerSR ensures this perspective while displaying the correct trend on multiply timeframes to help you go long way as much as possible. The latest technology of the Indicator enables to track whether if
Shepherd Harmonic Pattern
Abdullah Alrai
4.65 (49)
Cet indicateur détectera des motifs harmoniques dessinés sur le graphique par des méthodes manuelles et automatiques. Vous pouvez consulter le manuel d'utilisateur à partir de ce lien: Ajoutez votre avis et contactez-nous pour l'obtenir. Il existe une version gratuite pour essayer ce produit sur MT4. Vous pouvez l'utiliser pour détecter les motifs Gartley et Nenstar: https://www.mql5.com/en/market/product/30181 Vous pouvez acheter la version complète de MT4 à partir de: https://www.mql5.com/en/m
MetaBands M4
Vahidreza Heidar Gholami
5 (2)
MetaBands uses powerful and unique algorithms to draw channels and detect trends so that it can provide traders with potential points for entering and exiting trades. It’s a channel indicator plus a powerful trend indicator. It includes different types of channels which can be merged to create new channels simply by using the input parameters. MetaBands uses all types of alerts to notify users about market events. Features Supports most of the channel algorithms Powerful trend detection algorith
Royal Scalping Indicator M4
Vahidreza Heidar Gholami
4.17 (6)
Royal Scalping Indicator is an advanced price adaptive indicator designed to generate high-quality trading signals. Built-in multi-timeframe and multi-currency capabilities make it even more powerful to have configurations based on different symbols and timeframes. This indicator is perfect for scalp trades as well as swing trades. Royal Scalping is not just an indicator, but a trading strategy itself. Features Price Adaptive Trend Detector Algorithm Multi-Timeframe and Multi-Currency Trend Low
Currency Strength Exotics
Bernhard Schweigert
4.87 (30)
ACTUELLEMENT 20% DE RÉDUCTION ! La meilleure solution pour tout débutant ou trader expert ! Cet indicateur est spécialisé pour montrer la force de la devise pour tous les symboles comme les paires exotiques, les matières premières, les indices ou les contrats à terme. C'est le premier de son genre, n'importe quel symbole peut être ajouté à la 9ème ligne pour montrer la force réelle de la devise de l'or, l'argent, le pétrole, DAX, US30, MXN, TRY, CNH etc. Il s'agit d'un outil de trading uniq
Harmonic Papallons
Ramon Sobrevals Arce
3.33 (3)
Automatically scans the chart to find Harmonic Patterns, and give you the chance to enter early in good operations. Also if selected, it will alert you in advance when future patterns appears, showing you a projection of a posible future pattern. The main goal  for this algorithm is to determine with high precision the moment when a trend ends and a new one begins. Giving  you the best price within a reversal.   We have added the "Golden Trade", we define it as the perfect order: For those orde
All in One Trade
Alexey Minkov
4.48 (27)
The All-in-One Trade Indicator (AOTI) determines daily targets for EURUSD, EURJPY, GBPUSD, USDCHF, EURGBP, EURCAD, EURAUD, AUDJPY, GBPAUD, GBPCAD, GBPCHF, GBPJPY, AUDUSD, and USDJPY. All other modules work with any trading instruments. The indicator includes various features, such as Double Channel trend direction, Price channel, MA Bands, Fibo levels, Climax Bar detection, and others. The AOTI indicator is based on several trading strategies, and created to simplify market analysis. All-in-One
MetaTrend M4
Vahidreza Heidar Gholami
Meta Trend Indicator is an efficient way to forecast and detect the trend in any market. It reveals the trend, support and resistance levels, volatility and the maximum potential target, all in one indicator. To adapt to the price and to decrease consecutive trend failures, the internal trend detector algorithm studies the market and dynamically chooses the right values for the internal parameters. This indicator is a perfect trend filter for any strategy or expert advisor. Features Super Adapti
TrendMaestro
Stefano Frisetti
5 (3)
note: this indicator is for METATRADER4, if you want the version for METATRADER5 this is the link:  https://www.mql5.com/it/market/product/108106 TRENDMAESTRO ver 2.4 TRENDMAESTRO recognizes a new TREND in the bud, he never makes mistakes. The certainty of identifying a new TREND is priceless. DESCRIPTION TRENDMAESTRO identifies a new TREND in the bud, this indicator examines the volatility, volumes and momentum to identify the moment in which there is an explosion of one or more of these data a
Beast Indicator V7
Mohamed Ahmed Sh Muhumed
Step into the future of automated trading with the Beast Indicator V7, The indicator allows you to trade binary options. T his indicator give high winning ratio with over 20 years of backtesting  an unparalleled tool that seamlessly transforms your trading journey into an effortless and lucrative venture. Designed to simplify and optimize the trading process, the Beast Indicator is the ultimate game-changer, offering a hassle-free experience that allows you to set your buy and sell options effo
Supply and Demand Dashboard PRO
Bernhard Schweigert
4.8 (20)
Actuellement 20% de réduction ! Ce tableau de bord est un logiciel très puissant qui fonctionne sur plusieurs symboles et jusqu'à 9 horizons temporels. Il est basé sur notre indicateur principal (Best reviews : Advanced Supply Demand ).   Le tableau de bord donne une excellente vue d'ensemble. Il montre :  Les valeurs d'offre et de demande filtrées, y compris l'évaluation de la force de la zone, Les distances en pips vers/et dans les zones, Il met en évidence les zones imbriquées, Il donne
Entry Points Pro
Yury Orlov
4.62 (175)
Indicateur supérieur pour MT4 fournissant des signaux précis pour entrer dans un trade sans repeindre ! Il peut être appliqué à tous les actifs financiers : forex, cryptocurrencies, métaux, actions, indices.  La version MT5 est ici Il fournira des signaux de trading assez précis et vous dira quand il est préférable d'ouvrir un trade et de le fermer. Regardez la vidéo (6:22) avec un exemple de traitement d'un seul signal qui a rapporté à l'indicateur ! La plupart des traders améliorent l
This indicator is based on the Gann Signal indicator and acts as a market scanner. All you need to do is fill in the selected currency pairs in the settings and that’s it. Next, the indicator itself will view all these currency pairs and time frames from M5 to D1 simultaneously. When a new signal appears, the indicator will give you an Alert and also draw the letter N where this new signal will be.
PTS Precision Index Oscillator V2
PrecisionTradingSystems
5 (1)
L'oscillateur de l'indice de précision (Pi-Osc) de Roger Medcalf de Precision Trading Systems La version 2 a été soigneusement recodée pour être ultra-rapide à charger sur votre graphique, et quelques autres améliorations techniques ont été incorporées pour améliorer l'expérience. Le Pi-Osc a été créé pour fournir des signaux de synchronisation de trading précis conçus pour trouver des points d'épuisement extrêmes, les points auxquels les marchés sont contraints d'aller simplement pour élim
Quantum Breakout Indicator PRO
Bogdan Ion Puscasu
4.96 (25)
Présentation       Quantum Breakout PRO   , l'indicateur révolutionnaire MQL5 qui transforme la façon dont vous négociez les zones d'évasion ! Développé par une équipe de traders expérimentés avec une expérience de trading de plus de 13 ans,   Quantum Breakout PRO   est conçu pour propulser votre parcours de trading vers de nouveaux sommets grâce à sa stratégie de zone de discussion innovante et dynamique. Quantum Breakout Indicator vous donnera des flèches de signalisation sur les zones d
Plus de l'auteur
TradePad
Ruslan Khasanov
5 (2)
Une solution simple pour des opérations de trading rapides et un contrôle de position sur plusieurs instruments de trading. L'interface du panneau est simple et intuitive. Pour un travail confortable de commerçant, le panneau dispose de: gestionnaire de touches "hot", avec lesquelles vous pouvez gérer toutes les opérations de trading et les périodes de graphique; un outil pour marquer les niveaux de négociation lors de la passation d'ordres en attente ou de marché afin d'évaluer les risques et l
Un outil de surveillance multidevises sous la forme d'un panneau qui affiche les graphiques de tous les instruments sélectionnés par un trader dans une fenêtre séparée. Permet au trader d'effectuer une analyse visuelle du mouvement des prix sur plusieurs instruments différents et différentes périodes de temps, pour basculer rapidement entre les instruments sélectionnés. Une version de démonstration est disponible sur la page de description du produit TradePad :   https://www.mql5.com/en/blogs/po
Quick Info
Ruslan Khasanov
Quick Info est un utilitaire d'information permettant de collecter et de fournir à un trader diverses informations utiles nécessaires au trading sur les marchés financiers chaque jour. Toutes les informations nécessaires sont collectées et regroupées dans une fenêtre séparée. Sur le premier onglet, vous trouverez des statistiques commerciales pour la période sélectionnée. Pour collecter des statistiques commerciales, il vous suffit de sélectionner une période dans la liste ou de spécifier les
Candle hunter
Ruslan Khasanov
5 (1)
Indicateur pour l'analyse graphique. Marque les principaux modèles de chandeliers japonais sur le graphique. À l'heure actuelle, l'ensemble de modèles suivant est disponible pour le commerçant :  - Bearish/Bullish Abandoned Baby;  - Bearish Advance Block;  - Bearish Deliberation;  - Bearish/Bullish Belt Hold;  - Bearish/Bullish Engulfing;  - Bearish Shooting Star;  - Bearish Evening Star;  - Bearish Evening Doji Star;  - Bearish/Bullish Doji Star;    - Bearish/Bullish Tri-Star;  - Bearish Hangi
Filtrer:
4example
245
4example 2021.03.07 13:11 
 

Wonderful indicator. Your can see at a glance what a pair is doing and have everything in one chart. More over, the indicator has alerts and you can add moving averages of your choice to it. So now I can receive alerts from all pairs since I have only one profile active. It is basically a scanner with multi time frames enabled. The developer answers really fast and is offering advice on how to twick and have it the way you desire. Not many developers doing this with their product. What took me before several minutes, now it is a breeze. I have one chart with all pairs open on daily. This way I can see at a glance what the main trend is doing. Another one with 1 hour alerts on all pairs I consider worth trading. ... WONDERFUL work. Thank you.

Iqbal Aroussi
114
Iqbal Aroussi 2020.05.10 15:43 
 

L'utilisateur n'a laissé aucun commentaire sur la note

Répondre à l'avis
Version 23.1 2023.03.27
La nouvelle version contient de nombreux changements et améliorations.
Version 22.12 2022.12.08
Bugs corrigés. Performance améliorée. Mise à jour de la collection d'indicateurs de tendance.
Version 21.3 2021.03.16
Added notifications when moving averages cross.
Added a new parameter in the indicator settings - Allowed pairs for Notifications. List of symbols for which notifications are allowed. Specify, separated by a space, pairs on which notifications are allowed, for example: EURUSD, M5 GBPUSD, H1 USDJPY, M15
If the parameter is left blank, then notifications will be allowed for all pairs specified in the indicator settings.
Version 20.5 2020.05.10
Fixed a bug for currency pairs that have suffixes/prefixes in their names