Profit on fibonacci
- Indicateurs
- Matus German
- Version: 1.1
- Mise à jour: 20 décembre 2019
- Activations: 5
mql5 version: https://www.mql5.com/en/market/product/44815
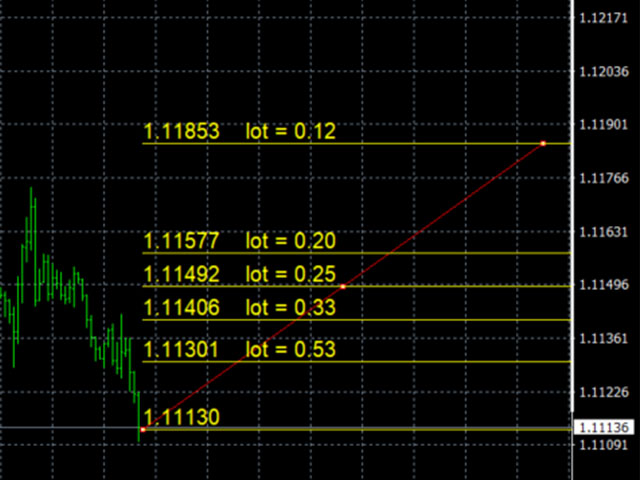
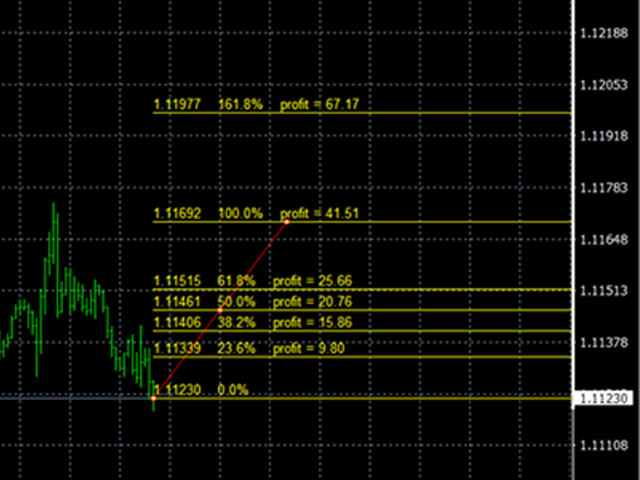
Simple indicator to calculate profit on fibonacci retracement levels with fixed lot size, or calculate lot size on fibonacci levels with fixed profit. Add to chart and move trend line to set the fibonacci retracement levels. Works similar as default fibonacci retracement line study in Metatrader.
Inputs
- Fixed - select what value will be fix, lot or profit
- Fixed value - value that will be fix on all levels
- Levels - levels for which to calculate values, separated by space, default are fibonacci levels
- Use spread - if true, spread will be included in calculations
- Show price - if true, price will be shown on levels
- Show fibonacci level - if true, value of levels will be shown
- Fibonacci lines as rays - if true, levels will be rays
- Fibonacci lines color - color of levels
- Trend line color - color of trend line which defines fibonacci retracement
- Font size
- Instance - unique number of indicator, if you want to add more ProfitOnFibonacci indicators on same chart, they have to have different instance number