Support and Resistance breakout signals
- Indicateurs
- Boris Mayorov
- Version: 1.1
- Mise à jour: 29 juin 2020
- Activations: 5
The advantage of this indicator of support and resistance lines over others is the ability to fine-tune search the parameters of
fnding this lines.
You can configure settings:
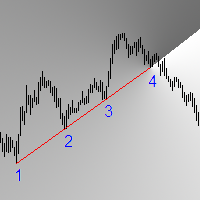
1) Points on Line. The minimum number of points of highs or lows, lined up in one line - to find resistance and support.
For
example, you want the inidcator to find lines formed by 3 points on one line, then there will be many such signals, but not all of them will
be worth attention. Or you can use a more rigorous searching for lines consisting of 4 or 5 points on one line, then it will be few such
signals, but they will be much more reliable.
2) Fractality. The fractality of extremums (highs and lows) is a parameter that determines how many candles on the left and
right should be lower the maximum, and how many candles on the left and right should be higher the minimum.
In other words, it is also the minimum distance between extremums, wich forming lines of resistance and supports.
3) Deviation from Line. This is the allowed number of price points of one of the points from the line.
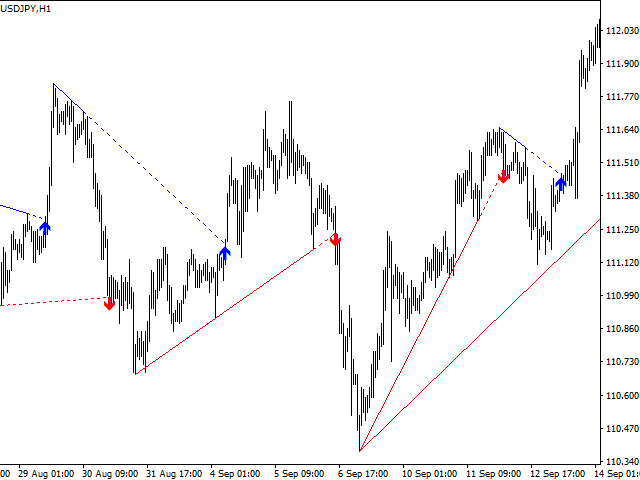
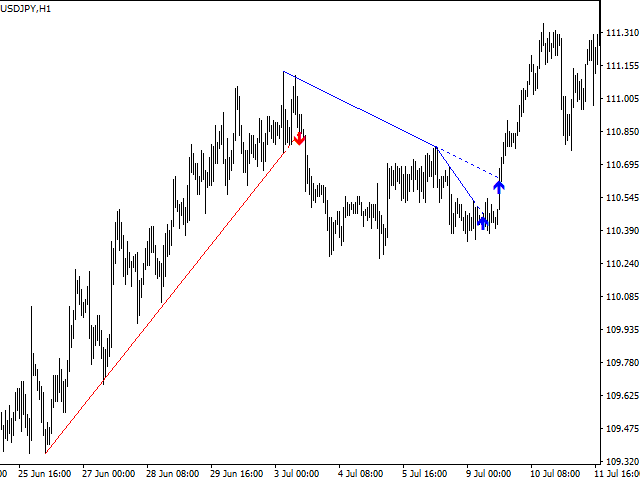
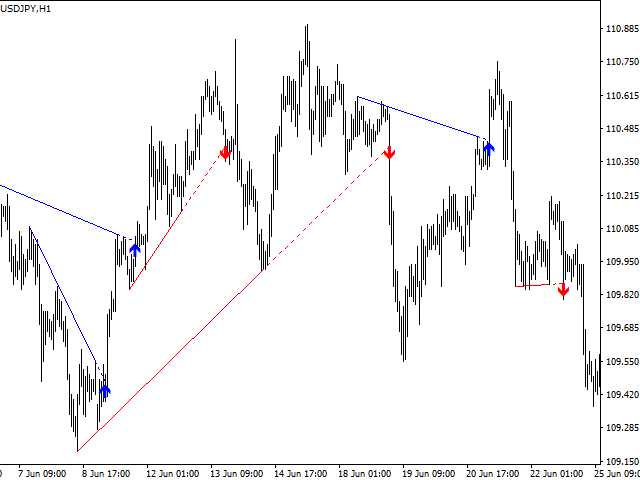
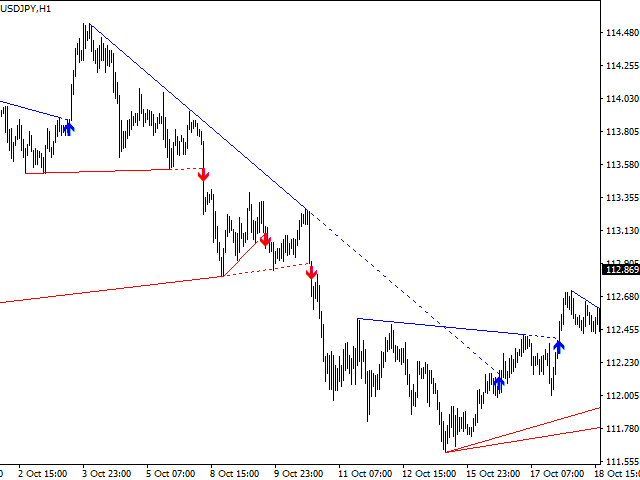
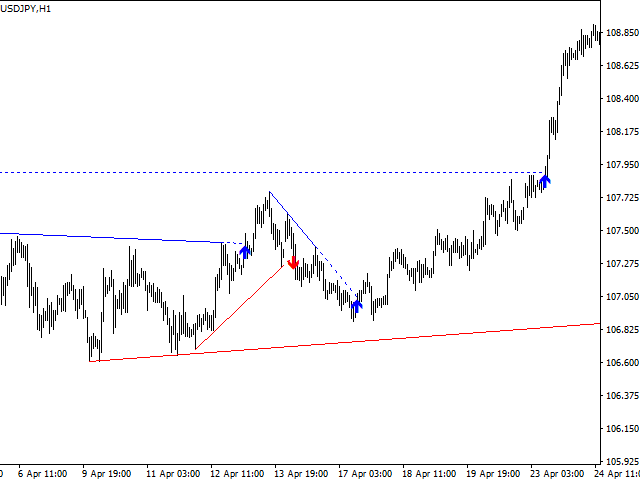
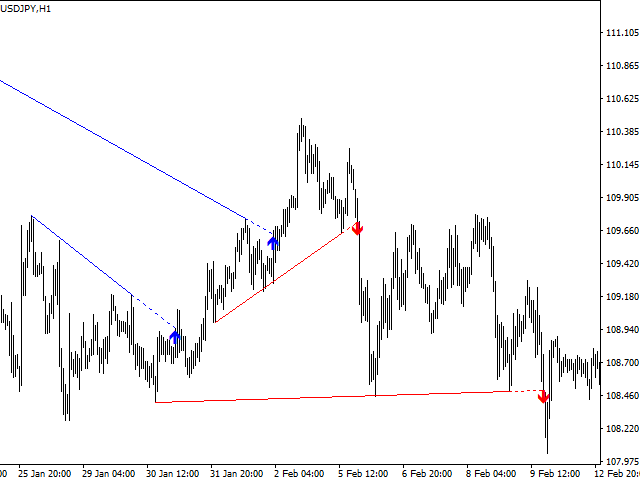
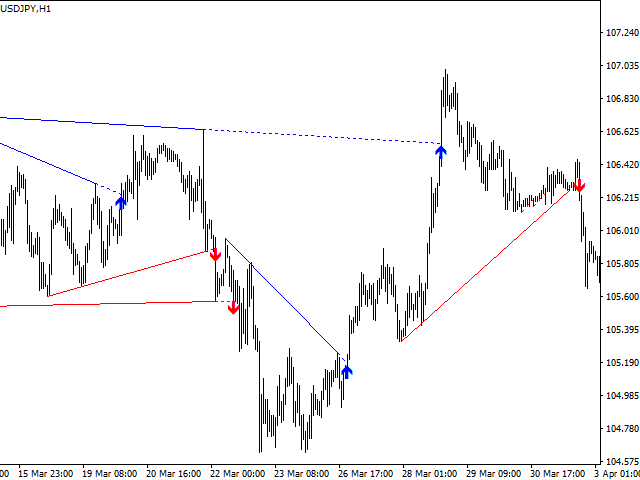
As with any indicator, all signals should be considered as a recommendation, and the decision on the transaction you should to do by yourself. With your correctly set up of the indicator and with understanding trends and their reversal, this indicator will qualitatively improve the searching for price reversal points, and most importantly, will save you every day for a many hours of time, spending for you to search for trends, drawing lines, and it will constantly monitoring and informing you in time about the breakout point of the trend line.
For testing, it is better to use the method of "all ticks", so you will see the full operation of the indicator with all the arrows, because when it testing with the "open prices" method, the arrows are not drawn in all times (because of the feature of the method of determining price crossing the lines).
I recommend using trend lines, formered by 4 candles-extremums or more (Points on Line). A Deviation from the Line is better to be proportional to the spread on the traded instrument (and remember that 5 points in the four-digit price = 50 points in the five-digit price). In the settings preferably the principle: better a few high-quality signals, than a lot of low-quality.
I wrote this indicator to save many hours of daily work on viewing and plotting charts. And I have freed up a lot of time, now I come to the notebook only when I hear a signal - look and make a decision to enter into a deal or not. Wish you all successful trading!




Indicator is working great so far. Support is excellent.