Heiken Ashi on one chart mode
- Indicateurs
- Alexander Zaitsev
- Version: 1.0
- Activations: 5
Heiken Ashi On One Chart Mode
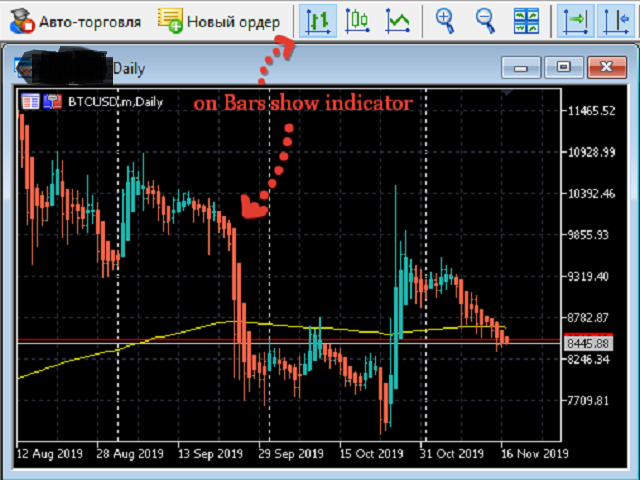
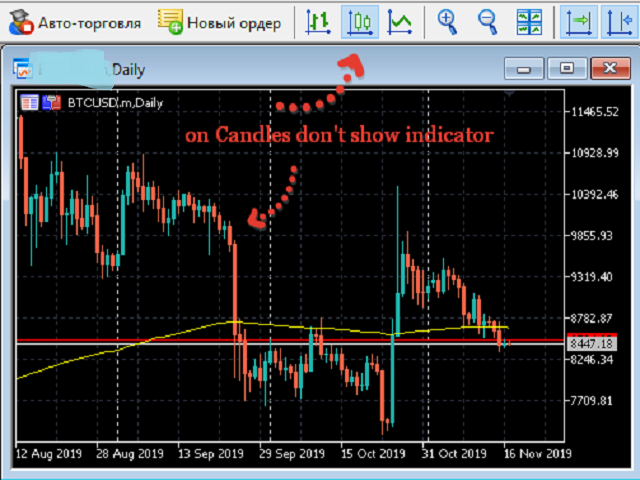
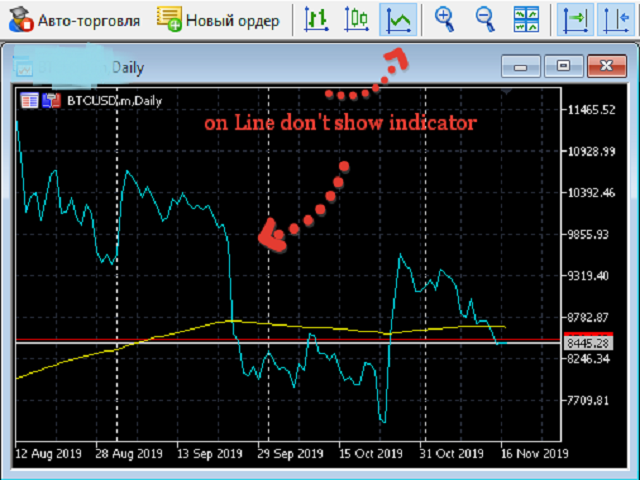
The indicator is displayed only on one of the chart modes: Bars, Candles, Line. The default is Bars. When switching the chart mode, the indicator is displayed or disappears depending on the chart mode.
Input parameters:
- iChartMode: on what chart mode should the indicator be displayed
- mBars
- mCandles
- mLine
Colors:
- LightSeaGreen: bull candle
- Tomato: bear candle