Scalper Thunder
- Indicateurs
- Andrey Kozak
- Version: 1.0
- Activations: 5
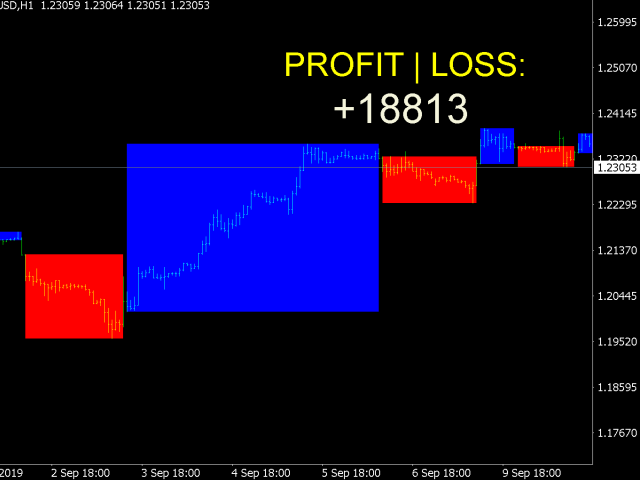
Trading system for scalping. The indicator shows the direction of the price, the amplitude (channel) of its movement and the pivot point. The system automatically analyzes the market using the tick volume averaging algorithm for a certain period of time. After that, Scalper Thunder compares the data with other analysis indicators to identify potential pivot points. As soon as such a point is found, the indicator shows the price reversal and its current direction on the chart. The essence of trading with this indicator is to trade in the direction of the price movement that the indicator shows. Also, the indicator can send traders to the phone and email signals.
What currency pairs does the indicator trade in: EURUSD, GBPUSD, USDCHF, USDJPY, USDCAD, AUDUSD, EURGBP, EURAUD, AUDNZD, AUDCAD, NZDUSD, AUDJPY, GBPJPY, GBPCHF. In this list, we have listed those currency pairs for which the indicator was tested. Despite this, the indicator can work on other currency pairs, just they have not been tested.
What timeframes do we recommend trading: M5, M15, M30, H1, H4, D1, W1
How to interpret indicator signals:
Indicator Settings:
What currency pairs does the indicator trade in: EURUSD, GBPUSD, USDCHF, USDJPY, USDCAD, AUDUSD, EURGBP, EURAUD, AUDNZD, AUDCAD, NZDUSD, AUDJPY, GBPJPY, GBPCHF. In this list, we have listed those currency pairs for which the indicator was tested. Despite this, the indicator can work on other currency pairs, just they have not been tested.
What timeframes do we recommend trading: M5, M15, M30, H1, H4, D1, W1
How to interpret indicator signals:
- If the indicator draws a blue square, it means that now the price is going up. It is advisable to open purchase transactions at this time. We can also open a buy transaction at the moment of drawing the blue square. This is the moment of impulse generation. There is a high probability that the price will dynamically go in this direction. If you look at the chart, you can see that at such moments in 93% of cases the price goes in the direction indicated by the indicator.
- If the indicator draws a red square, it means that now the price is moving down. If the red square has just appeared, it means that perhaps a large impulse of downward movement is now emerging. It is advisable at this moment to open sales transactions.
Indicator Settings:
- period - indicator period.
- bars - the number of bars on which the indicator will be displayed.
- inform - display potential profit / loss on the chart.
- Signal - enable / disable sending signals to the phone and email.


















L'utilisateur n'a laissé aucun commentaire sur la note