AIS Smoothing Stable Distribution
- Indicateurs
- Aleksej Poljakov
- Version: 1.0
- Activations: 5
Stable distributions can be used to smooth financial series. Since a fairly deep history can be used to calculate the distribution parameters,
such smoothing may in some cases be even more effective than other methods.
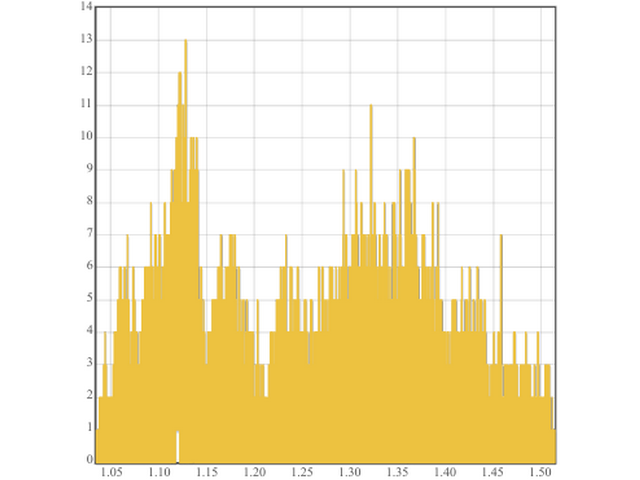
The figure shows an example of the distribution of the opening prices of the currency pair "EUR-USD" on
the time frame
H1 for ten years (figure 1). Looks fascinating, doesn't it?
The main idea behind this indicator is to determine the parameters of a stable distribution based on the spread of prices, and then use the
data to smooth out the financial series. Thanks to this approach, the smoothed values will tend to the most likely value of the price in a
given market situation.
The indicator operation is adjusted using the LB parameter. Its value determines the length of the smoothed
series, expressed in bars. A valid value is between 1-255.
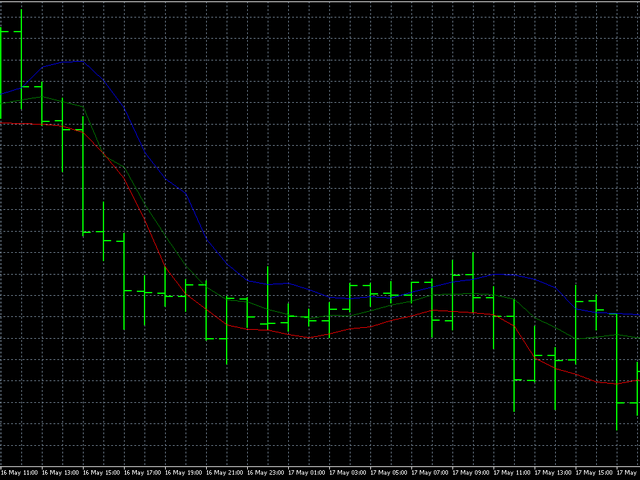
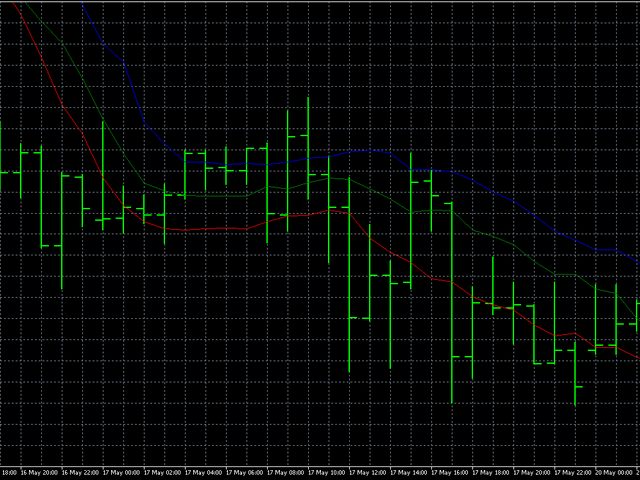
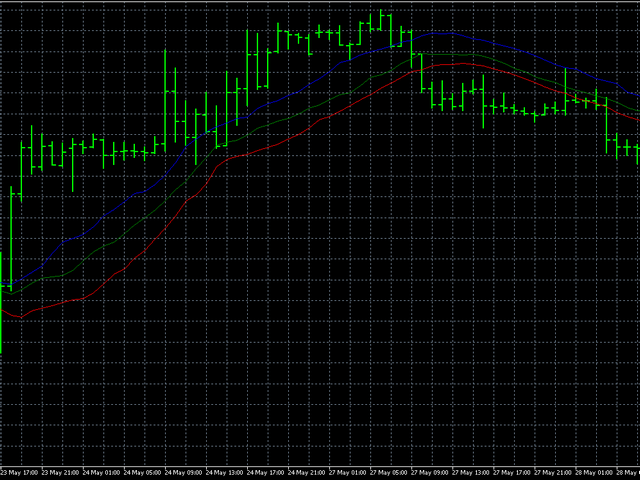
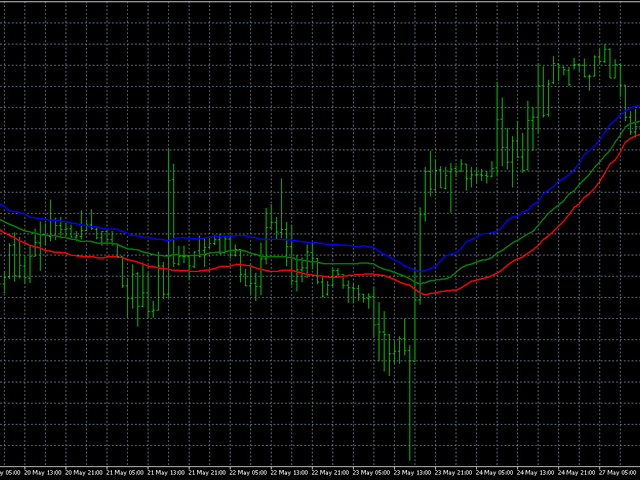
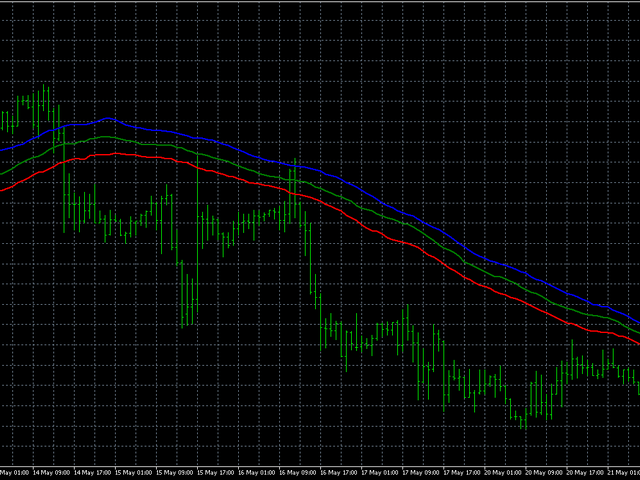
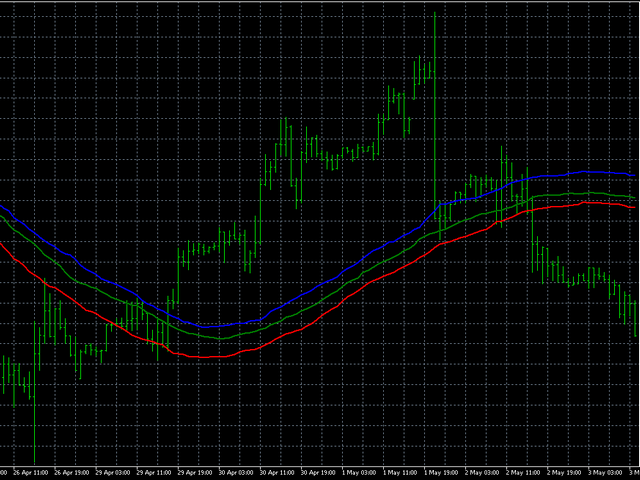
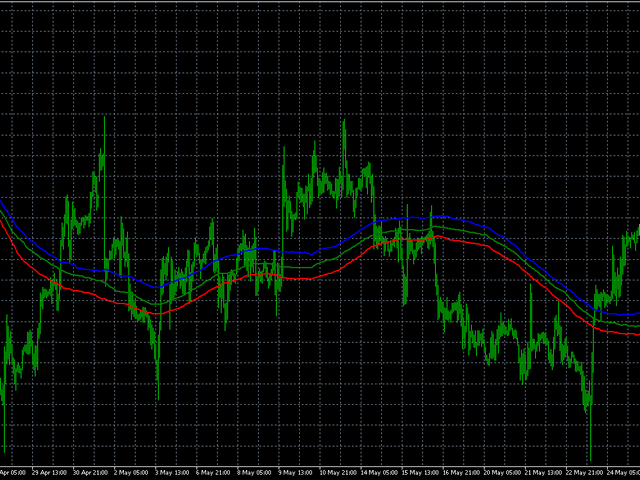
The blue line represents the smoothed value of the High, red – Low, and the green line
corresponds to the
Close.
The main drawback of this indicator is the inability to set the width of the smoothing window, so that the indicator is equally stable in all
parts of the history. Therefore, the trader must choose the parameters for his specific requirements.

