Pro Scalping System
- Indicateurs
- Vitaliy Kryukov
- Version: 1.1
- Mise à jour: 17 avril 2020
- Activations: 10
Pro Scalping is a comprehensive manual system developed for the most efficient trading at any market conditions on all instruments and time
scale.
The system is based on two main blocks:
1. The block of trend determination that calculates dynamic support and resistance.
The function of auto-optimization is available for this block.
2. The block of price deviation from its median based on the big set of regressions to get the statistically-valid result.
Entry rules
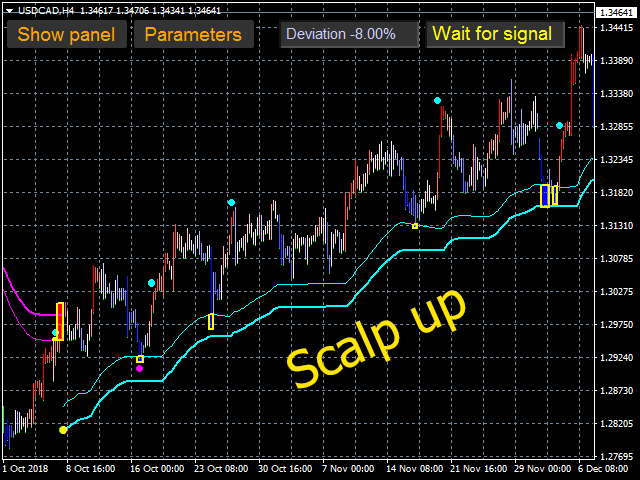
For buys:1. The trend goes up
2. The price is below the signal line
3. The price deviation is positive and is higher than the value
determined by settings
For sells:
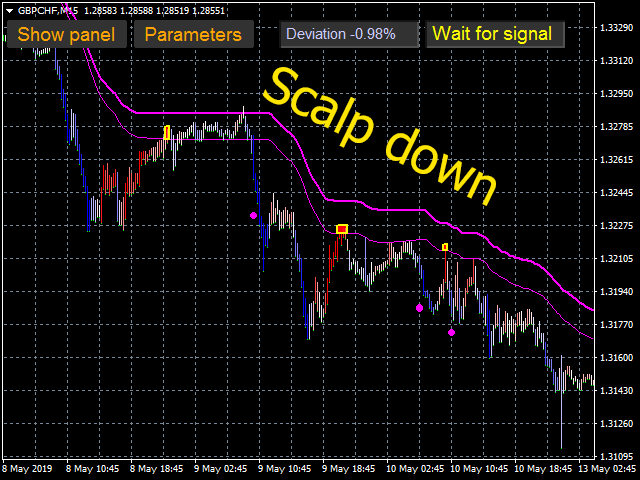
1. The trend goes down
2. The price is above the signal line
3. The price deviation is negative
and its modulo is higher than the value determined by settings
You don't need to look after all indications of the system. The information about signal displays in the special field on the chart
(possible values - BuyNow, SellNow and WaitForSignal).
Exit rules
If the trend keeps its direction the exit signal forms at opposite price deviation reaches its predetermined value ("CloseColor"). At this the profit of the trade is always positive.If the trend turns the exit signal forms together with the opposite entry signal.
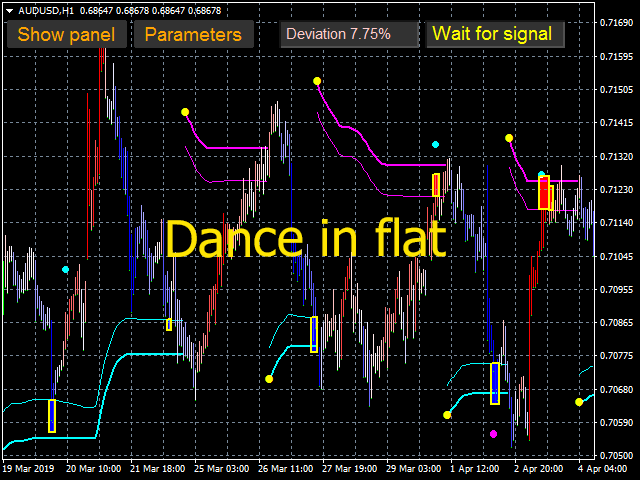
Therefore the system is equally good
suited to scalping in trend direction and to trading inside the channel at flat.
See the video below to realize how it works.
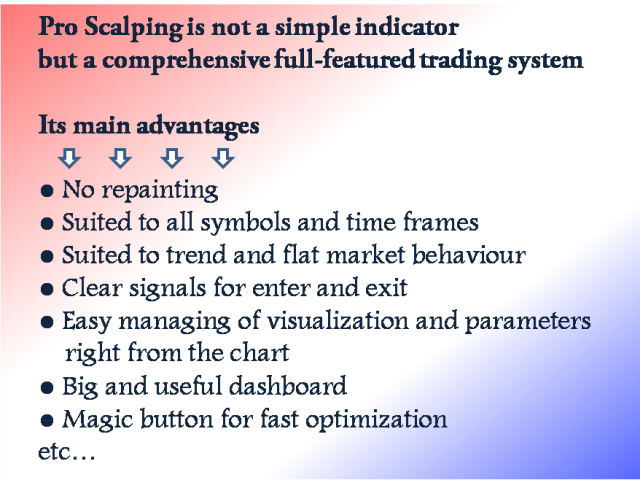
Main advantages of the system
Doesn't repaint closed candlesRough entry and exit rules
Flexible setup of visualization releases from chart overloading
The system has a
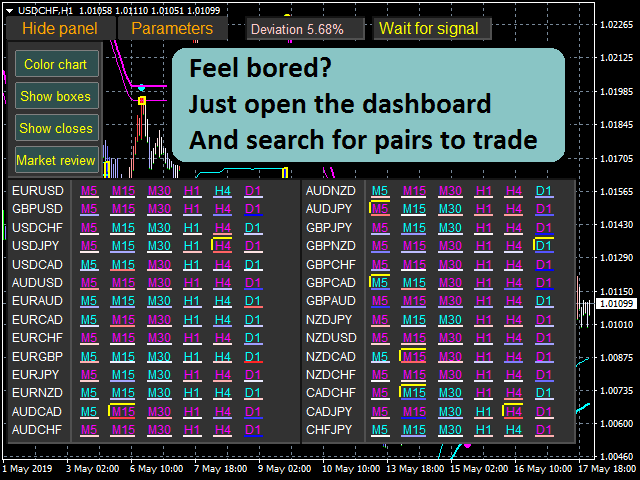
dashboard enabling one to look after 28 pairs at time frames from M5 to D1
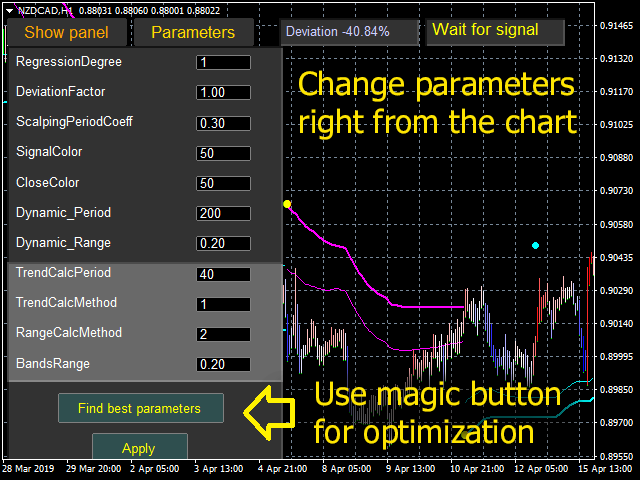
You can change main parameters of the system right from the chart
The optimization of parameters of the trend
determination by pressing "Find Best Parameters" button
The visualization of signals by rectangles gives the most true information about the system efficiency in the past. Rectangles clearly
show the price range of signal life unlike arrows which can point either at Low or High of the candle.
Requirements
- Minimal deposit: any
- Account type: any
- Currency pair: any
- Time frame: M5 - D1
Parameters
• ShowSignalBoxes - to show past signals by rectangles• ColorBars - to color bars correspondingly to price deviation from its median
• ShowCloseSignals
- to show close signals by bubbles
• BarsCount - the depth of history for calculation
• RegressionDegree
- the degree of regressions used to calculate price deviation from its median
• DeviationFactor
- the coefficient of price deviation
• ScalpingPeriodCoeff - the period's coefficient of
regressions used to calculate price deviation from its median
• SignalColor - deviation percent that is necessary to form entry signal
• CloseColor
- deviation percent that is necessary to form exit signal
• Dynamic_Period - the period of volatility for calculation of signal line
• Dynamic_Range
- the coefficient of volatility for calculation of signal line
• MinBoxSize - the minimal size of signal rectangles in points
• TrendCalcPeriod
- the period of moving averages used for trend detection
• TrendCalcMethod - the type of moving
averages used for trend detection
• RangeCalcMethod - the method of trend channel calculation to determine support and resistance
• BandsRange
- the coefficient of trend channel width to determine support and resistance
• OptimizationPeriod - the depth of
history for optimization of trend parameters
• Alert_Open - alert at entry signal
• Alert_Close - alert at exit
signal
• SendMail_Open - e-mail at entry signal
• SendMail_Close -
e-mail at exit signal
• SendPush_Open - push notification at entry signal
• SendPush_Close - push
notification at exit signal
Please read the manual
for complete description of the system's functions and trade recommendation
















Great tool. I recommend.