Abiroid GMMA Trend Scanner Dashboard
- Indicateurs
- Abir Pathak
- Version: 2.2
- Mise à jour: 8 juin 2021
- Activations: 20
Features:
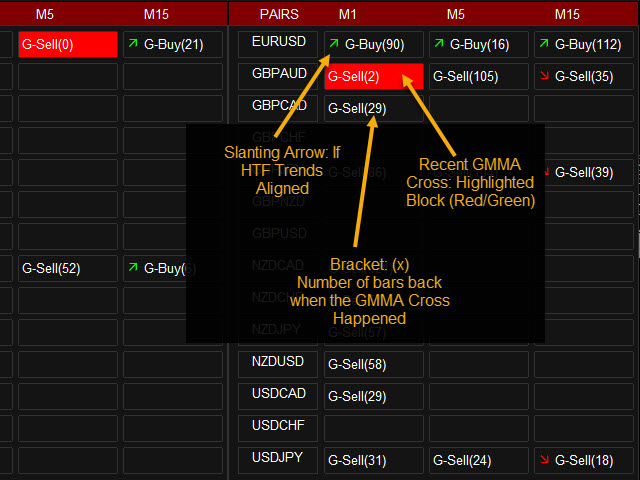
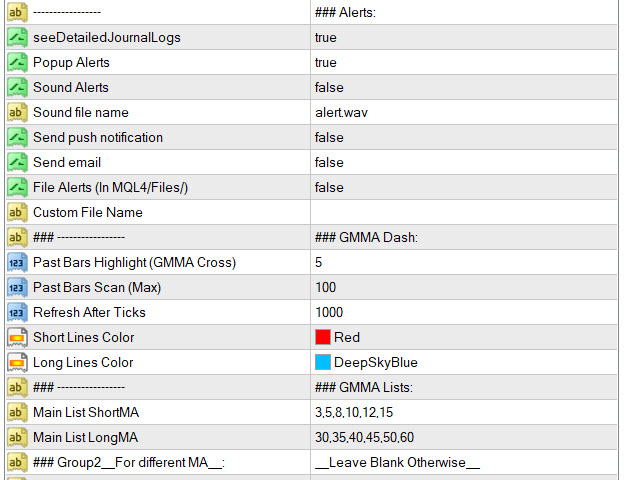
- Current TF GMMA Cross and Trend (Mandatory Check.. G-Up/G-Down)
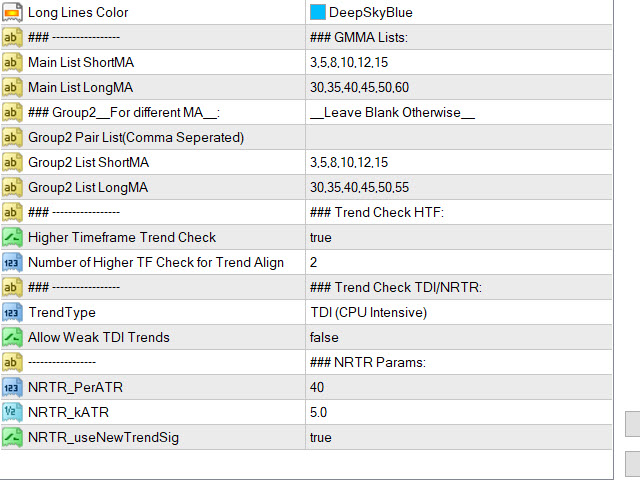
- HTF GMMA Trend Check (Optional.. slanting arrow)
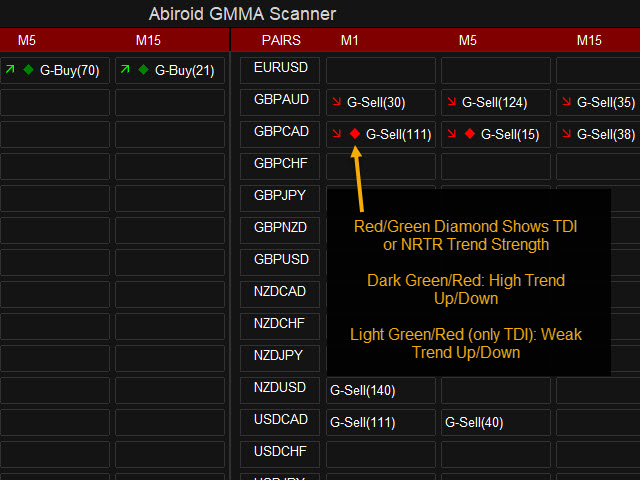
- TDI or NRTR Trend Check (Optional.. diamond)
Read post for detailed description and downloading extra indicators:
https://www.mql5.com/en/blogs/post/758264
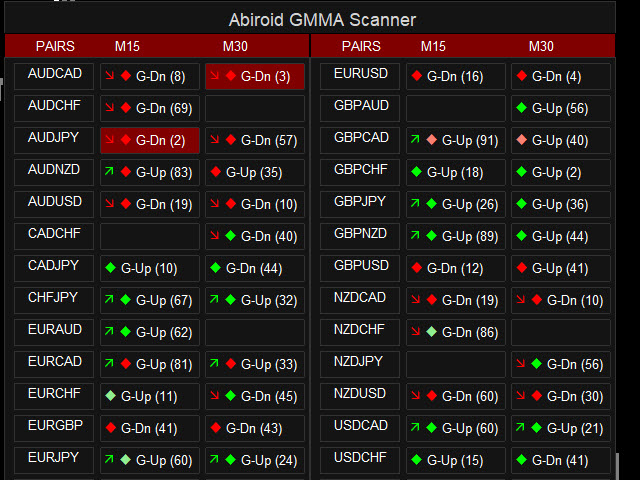
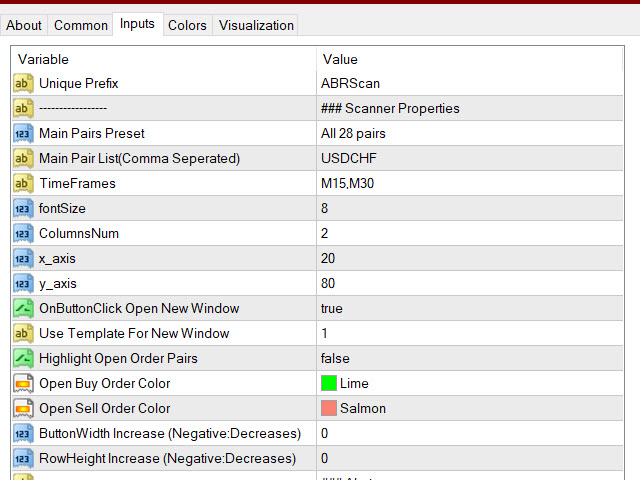
Scanner:
This is a Dashboard Scanner for finding good trades using the GMMA method as base and TDI method for trend verification.
All buttons for all Pairs and Timeframes are clickable and will change the chart for you to that Symbol/TimeFrame.
Green "G-Buy" button means good Buy Trend and Red "G-Sell" button means good Sell Trend.
Gray "G" means just a cross has happened but trend is not strong enough yet.
Free GMMA Arrows Indicator:
https://www.mql5.com/en/market/product/42908/
Read scanner common settings:
https://www.mql5.com/en/blogs/post/747456
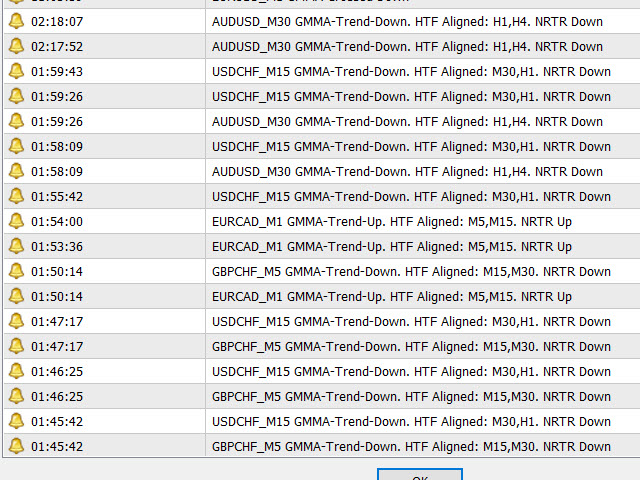
How Scanner finds the trades:
When short GMMA crosses Long GMMA upwards it will wait for some bars (customizable) for TDI to show strong BUY trend.
When short GMMA crosses Long GMMA downwards it will wait for some bars (customizable) for TDI to show strong SELL trend.
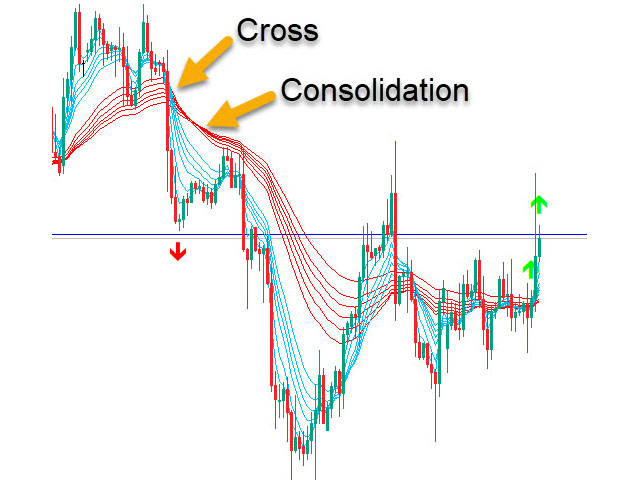
About GMMA In Brief:
GMMA attempts to identify trends by combining two groups of moving averages with differing time periods:
The long-term EMAs (30, 35, 40, 45, 50, and 60) the behaviors of investors that have taken a long-term approach to a given market. The short-term EMAs represent traders (3, 5, 8, 10, 12, and 18) who are attempting to capture short-term profits.
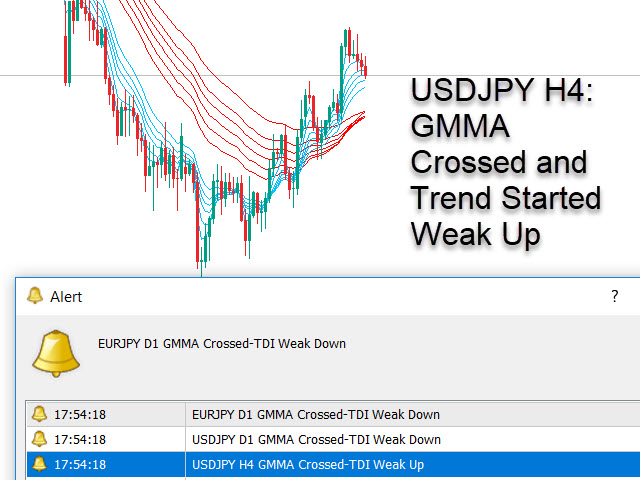
As you can see in the screenshots, blue lines are the short-term EMAs and red lines are long-term. So, buy when all of the blue lines cross above all of the red lines, and sell when the blue lines cross below the red lines. Right after a cross usually the red EMAs consolidate (get closer) and price has a slight reversal. Best time to buy is when the red EMAs start separating and price starts back again towards the trend using Count Back Line approach.
How to Trade:
Best way to use this indicator is with Support and Resistance or Pivot points to know when the good trend might end. Or any other indicators which show reversal areas. And set Take Profits accordingly.
You can set StopLoss using the Count Back Line approach.
Important Note:
Please don't use too many Timeframes and too many Pairs because Scanner will need to scan each and every one and might get slower the more pairs you select.
Scanner scans every bar only once for GMMA cross. But it scans every tick for TDI strong signal. So that it can inform you immediately when trade is good.
Only trade trending markets with Higher timeframes. Don't trade when market is sideways. Ranging markets will have too many GMMA crosses and will show unreliable signals.


Good Job! This is surprisingly convenient.