• Aperçu
  • Avis
  • Commentaires

Cycle Trade Pro Tick Momentum

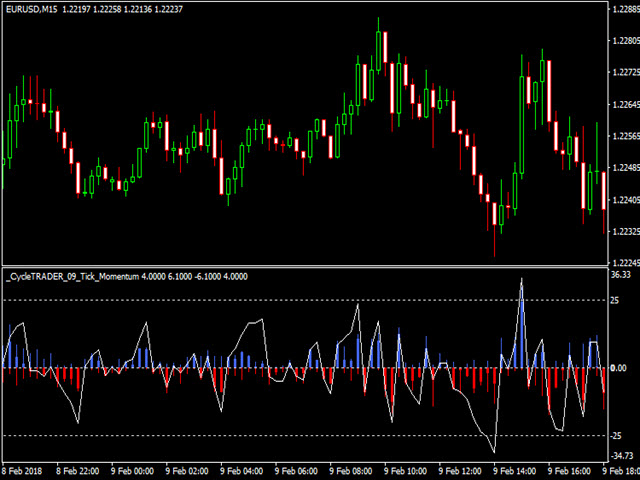
The CycleTraderPro Tick Momentum measures the number of ticks the market moves in the direction of consecutive closes.

When the market makes a close above its over, it will start to count in the direction how many ticks it moved.

If the next bar is in the moves and closes in the same direction, the Tick Momentum will continue to count up until the market closes below it's open. It will then start to count down in that direction.

You can see these moves in a detrend fashion with the zero point being plus or negative.

We plot each bar in red for down and blue for up.

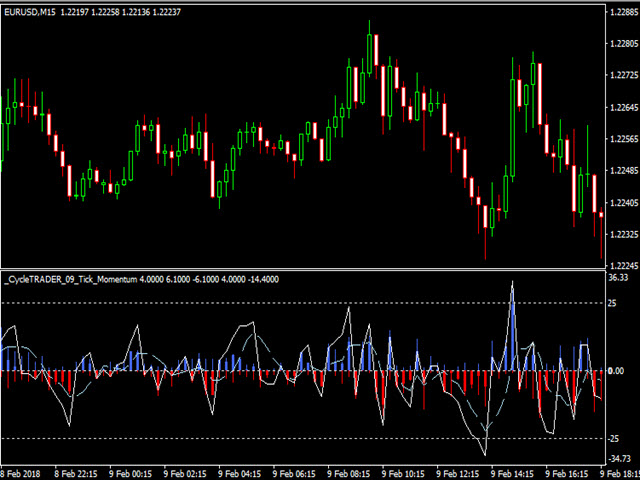
We then plot a solid white line for the total number of ticks each move made.
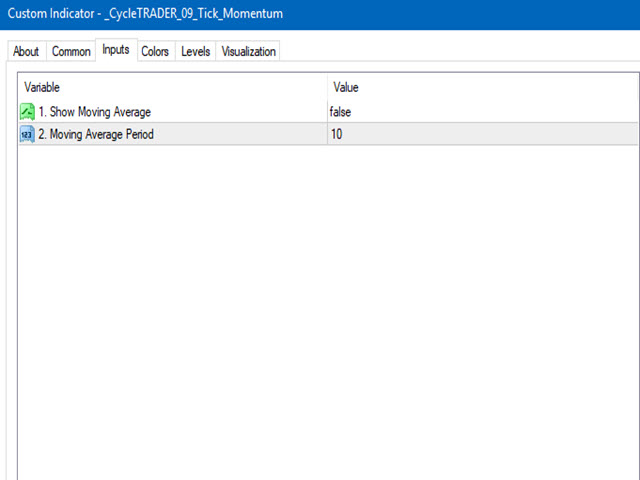
Inputs:

1 - Show the moving average on or off

2 - The length of the moving average defaulted to 10


When the market is at extremes you can thinking about taking profits or entering into positions. You will find the market typically goes x ticks and reverses


The moving average is another plotted line that smooth out the tick range.

Try a demo and see how it works.

Produits recommandés
Volume by Price MT4
Brian Collard
4.6 (10)
The Volumebyprice.com Indicator for MetaTrader 4 features Volume Profile and Market Profile TPO (Time Price Opportunity). Volume and TPO histogram bar and line charts. Volume Footprint charts. TPO letter and block marker collapsed and split structure charts. Static, dynamic and flexible range segmentation and compositing methods with relative and absolute visualizations. Session hours filtering and segment concatenation with Market Watch and custom user specifications. Graphical layering, posit
Verdure Lot Calculator
Olawale Adenagbe
5 (1)
Overview Money management is an all-important aspect of trading that many traders often overlook. It is very possible that even with a winning strategy, bad money management can often result in huge loses. Verdure Lot Calculator aims to help traders minimize risk and exposure in the Forex market. Verdure Forex Calculators implements Lot (Trade or Contract Size) Calculator as an indicator on MT4 platform. Lot Calculator (trade or contract size) A lot refers to a bundle of units in trade. In For
We present you the indicator "Candle closing counter", which will become your indispensable assistant in the world of trading. That’s why knowing when the candle will close can help: If you like to trade using candle patterns, you will know when the candle will be closed. This indicator will allow you to check if a known pattern has formed and if there is a possibility of trading. The indicator will help you to prepare for market opening and market closure. You can set a timer to create a p
TP SL Bot
Ruslan Brezovskiy
TP SL Bot - un utilitaire qui définit automatiquement les Stop Loss et Take Profit pour les nouveaux ordres ouverts de différentes manières selon vos indications. Il dispose également d'une fonction de calcul du volume nécessaire pour ouvrir un trade afin d'atteindre le montant souhaité avec la taille de Stop Loss/Take Profit spécifiée. Il existe plusieurs façons de calculer la taille et de définir les paramètres : 1. Réglages basés sur le montant spécifié par l'utilisateur en pourcentage du sol
Initial Balance Target Strategy is an indicator based on Fibonacci Levels. Its graphics flexibility allows you to adapt very well to your strategies or Trading System setting it with levels in input. The analysis of the time range allows replication of strategies as London Breakout and Kiss . The indicator is fully customizable, you can change colors, texts and percentages of Target. The simplicity and manageability of this indicator makes it an useful tool for all Intraday Trader . Input Valu
"Turbo Helper pour le scalping" est un système de trading entièrement préparé. Il indique au trader par une flèche sur le graphique quand ouvrir un ordre et dans quelle direction. Il indique également au trader par un symbole carré quand fermer le trade. Ensuite, l'indicateur affiche sur le graphique le nombre estimé de points pour le trade. Cette valeur peut légèrement varier car l'indicateur ne prend pas en compte la taille réelle du spread et du swap de votre courtier. Cependant, pour calcule
HMA Trend Professional MT4
Pavel Zamoshnikov
4.67 (6)
Improved version of the free HMA Trend indicator (for MetaTrader 4) with statistical analysis. HMA Trend is a trend indicator based on the Hull Moving Average (HMA) with two periods. HMA with a slow period identifies the trend, while HMA with a fast period determines the short-term movements and signals in the trend direction. The main differences from the free version: Ability to predict the probability of a trend reversal using analysis of history data. Plotting statistical charts for analyz
Blahtech Market Profile
Blahtech Limited
4.46 (13)
Was: $249  Now: $99   Market Profile defines a number of day types that can help the trader to determine market behaviour. A key feature is the Value Area, representing the range of price action where 70% of trading took place. Understanding the Value Area can give traders valuable insight into market direction and establish the higher odds trade. It is an excellent addition to any system you may be using. Blahtech Limited presents their Market Profile indicator for the MetaTrader community. Ins
Detailed statistics of your trading for the selected period My   #1 Utility : includes 65+ functions  |   Contact me  if you have any questions The utility includes 2 separate tools: Trade Statistics WeekDays Analyzer Statistics display modes: For the selected  currency pair/trading instrument Statistics for all trades   (" ALL ") You can select the period for which you want to get statistics: 1 day 1 week 1 month 2   months 3   months 6   months 1 year 2 years All trading history 1. Trade Stat
Noize Absorption Index MT4
Ekaterina Saltykova
5 (1)
Noize Absorption Index - is the manual trading system that measures the difference of pressure between bears forces and bulls forces. Green line - is a noize free index that showing curent situation. Zero value of index shows totally choppy/flat market.Values above zero level shows how powerfull bullish wave is and values below zero measures bearish forces.Up arrow appears on bearish market when it's ready to reverse, dn arrow appears on weak bullish market, as a result of reverse expectation. S
You can change the time period of the chart at the touch of a button. You can also change multiple charts at the touch of a button. You can also change multiple charts at the touch of a button, saving you the trouble of changing time periods. We are live-streaming the actual operation of the system. https://www.youtube.com/@ganesha_forex We do not guarantee your investment results. Investments should be made at your own risk. We sharll not be liable for any disadvantage or damage caused by
Profile Map
Dmitriy Sapegin
5 (11)
Market Profile helps the trader to identify the behavior if major market players and define zones of their interest. The key feature is the clear graphical display of the range of price action, in which 70% of the trades were performed. Understanding of the location of volume accumulation areas can help traders increase the probability of success. The tool can be used as an independent system as well as in combination with other indicators and trading systems. this indicator is designed to suit
Daily Candle Predictor est un indicateur qui prédit le cours de clôture d'une bougie. L'indicateur est principalement destiné à être utilisé sur les graphiques D1. Cet indicateur convient à la fois au trading forex traditionnel et au trading d'options binaires. L'indicateur peut être utilisé comme un système de trading autonome, ou il peut servir de complément à votre système de trading existant. Cet indicateur analyse la bougie actuelle, calcule certains facteurs de force à l'intérieur du corps
Cosmic Diviner X Planet
Olena Kondratenko
4 (2)
This unique multi-currency strategy simultaneously determines the strength of trends and market entry points, visualizing this using histograms on the chart. The indicator is optimally adapted for trading on the timeframes М5, М15, М30, Н1. For the convenience of users, the indicator renders the entry point (in the form of an arrow), recommended take profit levels (TP1, TP2 with text labels) and the recommended Stop Loss level. The take profit levels (TP1, TP2) are automatically calculated for
Trend and Fibo Mr Beast
Luis Mariano Vazquez Marcos
Indicador Trend and Fibonacci ProTrader Mr Beast  El Indicador Fibonacci ProTrader v1.0 es una potente herramienta diseñada para optimizar tus estrategias de trading en MetaTrader, aprovechando la precisión y la lógica de la secuencia de Fibonacci. Este indicador incorpora señales avanzadas de take profit, tendencia take profit y stop loss, proporcionando una guía estratégica sólida para tus operaciones. Características Principales: Secuencia de Fibonacci Dinámica: El indicador traza automátic
Real Magic Trend
Muhammed Emin Ugur
This   Real Magic Trend   indicator is designed for signal trading. This indicator generates trend signals. It uses many algorithms and indicators to generate this signal. It tries to generate signals from the points with the highest trend potential. This indicator is a complete trading product. This indicator does not need any additional indicators. The indicator is never repainted. The point at which the signal is given does not change.      Features and Recommendations Time Frame
It is so very disappointing when the price does not have enough points to achieve Take Profit and makes a reversal. This EA sets virtual levels near the TakeProfit levels. This EA sets virtual levels next to TakeProfit orders. If these levels are reached by price, breakeven or trailing stop is applied for an order. Features This EA does not set new orders. The aim of this EA is to manage stop losses of existing orders that are set by another EA or manually (magic number equals 0). For correct
Smart Watermark
Alexander Martinez
Smart Watermark affiche le symbole et la période tout en se redimensionnant et en se centrant automatiquement. Il vous permet également de définir une signature personnalisée pour partager vos graphiques avec d'autres. Paramètres: Paramètre La description Police de caractère Le type de police utilisé pour afficher le filigrane Couleur de la police La couleur de police utilisée pour afficher le filigrane Le style de police Le style de la police. Choisissez entre Aucun, Italique, Soulig
Fibonacci retracement and extension line drawing tool Fibonacci retracement and extended line drawing tool for MT4 platform is suitable for traders who use  golden section trading Advantages: There is no extra line, no too long line, and it is easy to observe and find trading opportunities Trial version: https://www.mql5.com/zh/market/product/35884 Main functions: 1. Multiple groups of Fibonacci turns can be drawn directly, and the relationship between important turning points
Strong Retracement Points Pro demo edition! SRP (Strong Retracement/Reversal Points) is a powerful and unique support and resistance indicator. It displays the closest important levels which we expect the price retracement/reversal! If all level are broken from one side, it recalculates and draws new support and resistance levels, so the levels might be valid for several days depending on the market! If you are still hesitating to start using this wonderful tool, you can check this link to see h
Binary Options Assistant (BOA) Multi Currency Dashboard for Binary Options (MT4) . You can use any of the BOA Signals Indicators with the dashboard. Just change the BOA Signals Indicator Name in the dashboard settings to the indicator you want to get signals from. For example: CHILL. BOA_BURN_Indicator_v1   Strategy :   Ana Trader Binary Options Strategy (MACD & Stochastic) BOA_COLD_Indicator_v1   Strategy :  Amalia Trader Binary Options Strategy (Keltner & Stochastic) BOA_CHILL_Indicator_
The principle of this indicator is very simple: detecting the trend with Moving Average, then monitoring the return point of graph by using the crossing of Stochastic Oscillator and finally predicting BUY and SELL signal with arrows, alerts and notifications. The parameters are fixed and automatically calculated on each time frame. Example: If you install indicator on EURUSD, timeframe M5: the indicator will detect the main trend with the Moving Average on this timeframe (for example the Moving
Notre indicateur Basic Support and Resistance est la solution dont vous avez besoin pour augmenter votre analyse technique.Cet indicateur vous permet de projeter les niveaux de support et de résistance sur le graphique / Version MT5 Caractéristiques Intégration des niveaux de Fibonacci: avec la possibilité d'afficher les niveaux de Fibonacci aux côtés des niveaux de support et de résistance, notre indicateur vous donne un aperçu encore plus profond du comportement du marché et des zones d'in
Scalping Arrow Notification Phone est un indicateur de trading de scalping unique. L'indicateur dessine des flèches sur le graphique lorsque vous devez ouvrir une commande, indique dans quelle direction vous devez ouvrir des commandes et vous envoie également une notification concernant un signal sur votre téléphone mobile. A tout moment, même lorsque vous n'êtes pas devant l'ordinateur, vous recevrez des signaux, pourrez contrôler le marché et trader. L'indicateur montre avec une flèche quand
Break Moment
Svyatoslav Kucher
5 (1)
Break Moment is a unique proprietary indicator with extensive capabilities and a variety of settings. It can be used as a signal generator or as an auxiliary tool. For the calculations, the price channel is determined. When it is broken, if all conditions of the additional filter are met, it displays a signal in the form of a histogram. Break Moment can be used to determine the main trend, as it has 2 filters for determining it in addition to everything else. If these filters are activated, the
TWO PAIRS SQUARE HEDGE METER INDICATOR Try this brilliant 2 pairs square indicator It draws a square wave of the relation between your two inputs symbols when square wave indicates -1 then it is very great opportunity to SELL pair1 and BUY Pair2 when square wave indicates +1 then it is very great opportunity to BUY pair1 and SELL Pair2 the inputs are : 2 pairs of symbols         then index value : i use 20 for M30 charts ( you can try other values : 40/50 for M15 , : 30 for M30 , : 10 for H1 ,
To download MT5 version please click  here . This is the exact conversion from TradingView: "WaveTrend [LazyBear]" By "zeusuk3". One of the coolest indicators out there to detect overbought and oversold zones. It can be used as a part of more complicated strategy and for confirming a potential trade setup. There are buffers to use in EAs also. The indicator is loaded light and non-repaint. - You can message in private chat for further changes you need. Thanks for downloading 
The new update makes this indicator a complete tool for studying, analyzing and operating probabilistic patterns. It includes: On-chart Multi-asset percentage monitor. Configurable martingales. Twenty-one pre-configured patterns , including Mhi patterns and C3. An advanced pattern editor to store up to 5 custom patterns. Backtest mode to test results with loss reports. Trend filter. Hit operational filter. Martingale Cycles option. Various types of strategies and alerts. Confluence between patte
PZ Mean Reversion MT4
PZ TRADING SLU
2.33 (3)
Indicateur unique qui met en œuvre une approche professionnelle et quantitative pour signifier le trading de réversion. Il capitalise sur le fait que le prix dévie et revient à la moyenne de manière prévisible et mesurable, ce qui permet des règles d'entrée et de sortie claires qui surpassent largement les stratégies de trading non quantitatives. [ Installation Guide | Update Guide | Troubleshooting | FAQ | All Products ] Des signaux de trading clairs Étonnamment facile à échanger Couleurs et
NEW check the FULL Version Including the private ICT tools limited so far until the release of the full 2016 Mentorship Core Content to the public. Indicator type: Money Management Calculator; Forex Position Size Calculator; Fixed or ATR value for Stop Loss and Take Profit levels; Average Position Size Indicator (True Average Price); Acc ount Information; Stop-out Level, Margin and Risk Exposure Warning, Forex Sessions; Institutional Levels Grid; Major Highs and Lows, Detailed Account Report an
Les acheteurs de ce produit ont également acheté
Gann Made Easy
Oleg Rodin
4.84 (57)
Gann Made Easy est un système de trading Forex professionnel et facile à utiliser qui est basé sur les meilleurs principes de trading en utilisant la théorie de mr. WD Gann. L'indicateur fournit des signaux d'ACHAT et de VENTE précis, y compris les niveaux Stop Loss et Take Profit. Vous pouvez échanger même en déplacement en utilisant les notifications PUSH. S'il vous plaît contactez-moi après l'achat! Je partagerai avec vous mes astuces de trading et d'excellents indicateurs bonus gratuitement!
Trend Punch
Mohamed Hassan
5 (12)
This indicator is unstoppable when combined with our other indicator called  Support & Resistance . After purchase, send us a message and you will get it   for  FREE as a BONUS! Introducing Trend Punch , the revolutionary forex trend indicator that will transform the way you trade! Trend Punch is uniquely designed to provide precise buy and sell arrows during strong market trends, making your trading decisions clearer and more confident. Whether you're trading major currency pairs or exotic sym
Gold Stuff
Vasiliy Strukov
4.89 (201)
Gold Stuff est un indicateur de tendance conçu spécifiquement pour l'or et peut également être utilisé sur n'importe quel instrument financier. L'indicateur ne se redessine pas et ne traîne pas. Délai recommandé H1. Au niveau de l'indicateur de travail, l'Expert Advisor EA Gold Stuff est entièrement automatique. Vous pouvez le trouver sur mon profil. Vous pouvez obtenir une copie gratuite de notre indicateur Strong Support et Trend Scanner, veuillez envoyer un message privé. moi! Contactez
Trend Pulse
Mohamed Hassan
5 (3)
Please contact me after purchase to immediately get your PDF strategy + documentation for Trend Pulse !  Official release price of $89  (1 /50 copies left). Next price is $199 . Introducing Trend Pulse , a unique and robust indicator capable of detecting bullish, bearish, and even ranging trends! Trend Pulse uses a special algorithm to filter out market noise with real precision. If the current symbol is moving sideways, Trend Pulse will send you a ranging signal, letting you know that it'
VEUILLEZ LIRE LES INFORMATIONS CI-DESSOUS AVANT D'ACHETER LE PRODUIT! Apollo Pips PLUS SP est un produit unique! C'EST POUR CEUX QUI VEULENT OBTENIR MON NOUVEL INDICATEUR "APOLLO PIPS" PLUS BONUS "SUPER PACK" AVEC ACCÈS À TOUS MES INDICATEURS DE TRADING! En achetant le produit Apollo Pips PLUS SP, vous achetez en fait une toute nouvelle version de mon indicateur Apollo Pips. Cette version de l'indicateur dispose d'un algorithme amélioré et d'un paramètre facile à utiliser qui vous donne la possi
FX Power MT4 NG
Daniel Stein
5 (12)
Obtenez votre mise à jour quotidienne du marché avec des détails et des captures d'écran via notre Morning Briefing ici sur mql5 et sur Telegram ! FX Power MT4 NG est la nouvelle génération de notre très populaire indicateur de force des devises, FX Power. Et qu'est-ce que ce compteur de force de nouvelle génération offre ? Tout ce que vous avez aimé de l'original FX Power PLUS Analyse de la force de l'OR/XAU Des résultats de calcul encore plus précis Périodes d'analyse configurables individuel
Scalper Inside PRO
Alexey Minkov
4.69 (49)
An exclusive indicator that utilizes an innovative algorithm to swiftly and accurately determine the market trend. The indicator automatically calculates opening, closing, and profit levels, providing detailed trading statistics. With these features, you can choose the most appropriate trading instrument for the current market conditions. Additionally, you can easily integrate your own arrow indicators into Scalper Inside Pro to quickly evaluate their statistics and profitability. Scalper Inside
TPSproTREND PrO
Roman Podpora
4.78 (18)
TPSpro TREND PRO   est un indicateur de tendance qui analyse automatiquement le marché et fournit des informations sur la tendance et chacun de ses changements, ainsi que des signaux pour entrer dans des transactions sans redessiner ! L'indicateur utilise chaque bougie et les analyse séparément. faisant référence à différentes impulsions - impulsion ascendante ou descendante. Points d'entrée précis dans les transactions sur les devises, les crypto-monnaies, les métaux, les actions, les indices 
Currency Strength Wizard est un indicateur très puissant qui vous offre une solution tout-en-un pour un trading réussi. L'indicateur calcule la puissance de telle ou telle paire de devises en utilisant les données de toutes les devises sur plusieurs périodes. Ces données sont représentées sous la forme d'un indice de devise facile à utiliser et de lignes électriques de devise que vous pouvez utiliser pour voir la puissance de telle ou telle devise. Tout ce dont vous avez besoin est d'attacher l'
- Real price is 80$ - 40% Discount ( It is 49$ now ) Contact me for instruction, any questions! Introduction The breakout and retest strategy is traded support and resistance levels. it involves price breaking through a previous level.  The break and retest strategy is designed to help traders do two main things, the first is to avoid false breakouts. Many false breakouts start with a candlestick that breaks out of a level but ends with an immediate candlestick that brings the price back into t
RelicusRoad Pro
Relicus LLC
4.54 (80)
Maintenant 147 $ (augmentant à 499 $ après quelques mises à jour) - Comptes illimités (PCS ou Mac) Manuel d'utilisation RelicusRoad + Vidéos de formation + Accès au groupe Discord privé + Statut VIP UNE NOUVELLE FAÇON DE REGARDER LE MARCHÉ RelicusRoad est l'indicateur de trading le plus puissant au monde pour le forex, les contrats à terme, les crypto-monnaies, les actions et les indices, offrant aux traders toutes les informations et tous les outils dont ils ont besoin pour rester renta
Tout d'abord, il convient de souligner que cet outil de trading est un indicateur non repeint, non redessiné et non retardé, ce qui le rend idéal pour le trading professionnel. Cours en ligne, manuel utilisateur et démonstration. L'indicateur Smart Price Action Concepts est un outil très puissant à la fois pour les nouveaux et les traders expérimentés. Il regroupe plus de 20 indicateurs utiles en un seul, combinant des idées de trading avancées telles que l'analyse du trader Inner Circle et les
Clear Breakout
Martin Alejandro Bamonte
L'indicateur "Breakout Buy-Sell" est conçu pour identifier et mettre en évidence des opportunités d'achat et de vente potentielles basées sur les ruptures de prix pendant différentes sessions de marché (Tokyo, Londres et New York). Cet indicateur aide les traders à visualiser clairement les zones d'achat et de vente, ainsi que les niveaux de take-profit (TP) et de stop-loss (SL). Stratégie d'utilisation L'indicateur peut être utilisé comme suit : Configuration initiale : Sélectionnez la session
ACTUELLEMENT 31% DE RÉDUCTION ! ! La meilleure solution pour tout débutant ou Expert Trader ! Cet indicateur est un outil de trading unique, de haute qualité et abordable car nous avons incorporé un certain nombre de caractéristiques exclusives et une formule secrète. Avec seulement UN graphique, il donne des alertes pour les 28 paires de devises. Imaginez comment votre trading s'améliorera parce que vous serez capable de repérer le point de déclenchement exact d'une nouvelle tendance ou d'
Trend Screener
STE S.S.COMPANY
4.79 (81)
Indicateur de tendance, solution unique révolutionnaire pour le trading et le filtrage des tendances avec toutes les fonctionnalités de tendance importantes intégrées dans un seul outil ! Il s'agit d'un indicateur multi-période et multi-devises 100 % non repeint qui peut être utilisé sur tous les symboles/instruments : forex, matières premières, crypto-monnaies, indices et actions. Trend Screener est un indicateur de suivi de tendance efficace qui fournit des signaux de tendance fléchés avec des
Actuellement 20% de réduction ! La meilleure solution pour tout débutant ou trader expert ! Ce logiciel de tableau de bord fonctionne sur 28 paires de devises. Il est basé sur 2 de nos principaux indicateurs (Advanced Currency Strength 28 et Advanced Currency Impulse). Il donne un excellent aperçu de l'ensemble du marché Forex. Il montre les valeurs de l'Advanced Currency Strength, la vitesse de mouvement des devises et les signaux pour 28 paires de devises dans tous les (9) délais. Imagine
Atomic Analyst
Issam Kassas
5 (2)
Tout d'abord, il convient de souligner que cet indicateur de trading n'est ni repainting, ni redrawing et ne présente aucun délai, ce qui le rend idéal à la fois pour le trading manuel et automatisé. Manuel de l'utilisateur : réglages, entrées et stratégie. L'Analyste Atomique est un indicateur d'action sur les prix PA qui utilise la force et le momentum du prix pour trouver un meilleur avantage sur le marché. Équipé de filtres avancés qui aident à éliminer les bruits et les faux signaux, et à
ACTUELLEMENT 26% DE RÉDUCTION La meilleure solution pour tout débutant ou trader expert ! Cet indicateur est un outil de trading unique, de haute qualité et abordable car nous avons incorporé un certain nombre de caractéristiques exclusives et une nouvelle formule. Avec seulement UN graphique, vous pouvez lire la force de la devise pour 28 paires Forex ! Imaginez comment votre trading va s'améliorer parce que vous êtes capable de repérer le point de déclenchement exact d'une nouvelle tendan
Le système PRO Renko est un système de trading très précis spécialement conçu pour le trading de graphiques RENKO. Il s'agit d'un système universel qui peut être appliqué à divers instruments de négociation. Le système neutralise efficacement ce qu'on appelle le bruit du marché en vous donnant accès à des signaux d'inversion précis. L'indicateur est très facile à utiliser et n'a qu'un seul paramètre responsable de la génération du signal. Vous pouvez facilement adapter l'outil à n'importe q
Gold Channel is a volatility-based indicator, developed with a specific timing algorithm for the XAUUSD pair, which consists of finding possible corrections in the market. This indicator shows two outer lines, an inner line (retracement line) and an arrow sign, where the theory of the channel is to help identify overbought and oversold conditions in the market. The market price will generally fall between the boundaries of the channel. If prices touch or move outside the channel it is a tra
Backtest and Read Overview before purchase. Chart patterns have been a topic of debate among traders; some believe they are reliable signalers, while others do not. Our Chart Patterns All-in-One indicator displays various chart patterns to help you test these theories for yourself. The profitability of these patterns is not a reflection of the indicator's effectiveness but rather an evaluation of the patterns themselves. The Chart Patterns All-in-One indicator is an excellent tool for visualizin
PZ Trend Trading
PZ TRADING SLU
4.8 (5)
Capture every opportunity: your go-to indicator for profitable trend trading Special Offer: Purchase now to receive free bonuses worth $159! (Read more for details) Trend Trading is an indicator designed to profit as much as possible from trends taking place in the market, by timing pullbacks and breakouts. It finds trading opportunities by analyzing what the price is doing during established trends. [ Installation Guide | Update Guide | Troubleshooting | FAQ | All Products ] Trade financial
TPSpro RFI Levels
Roman Podpora
4.8 (20)
Reversal First Impulse levels (RFI)    INSTRUCTIONS        RUS       -       ENG              R ecommended to use with an indicator   -   TPSpro  TREND PRO -  Version MT5 A key element in trading is zones or levels from which decisions to buy or sell a trading instrument are made. Despite attempts by major players to conceal their presence in the market, they inevitably leave traces. Our task was to learn how to identify these traces and interpret them correctly. Main functions: Displaying activ
NAM Order Blocks
NAM TECH GROUP, CORP.
5 (1)
MT4 Multi-timeframe Order Blocks detection indicator. Features - Fully customizable on chart control panel, provides complete interaction. - Hide and show control panel wherever you want. - Detect OBs on multiple timeframes. - Select OBs quantity to display. - Different OBs user interface. - Different filters on OBs. - OB proximity alert. - ADR High and Low lines. - Notification service (Screen alerts | Push notifications). Summary Order block is a market behavior that indicates order collection
Order Block Hunter
Noha Mohamed Fathy Younes Badr
5 (1)
Order block hunter indicator is the best indicator for  hunt the order blocks that area where there has been a large concentration of limit orders waiting to be executed Order blocks are identified on a chart by observing previous price action and looking for areas where the price experienced significant movement or sudden changes in direction .This indicator does that for you by using very complicated codes and helps you to take the best areas To buy and sell because it make marks at the best a
Scalper Vault
Oleg Rodin
5 (22)
Scalper Vault est un système de scalpage professionnel qui vous fournit tout ce dont vous avez besoin pour un scalpage réussi. Cet indicateur est un système de trading complet qui peut être utilisé par les traders de forex et d'options binaires. Le délai recommandé est M5. Le système vous fournit des signaux fléchés précis dans le sens de la tendance. Il vous fournit également des signaux supérieurs et inférieurs et des niveaux de marché Gann. Les indicateurs fournissent tous les types d'alertes
Le profit de la structure du marché change à mesure que le prix s'inverse et recule. L'indicateur d'alerte d'inversion de la structure du marché identifie le moment où une tendance ou un mouvement de prix approche de l'épuisement et est prêt à s'inverser. Il vous avertit des changements dans la structure du marché qui se produisent généralement lorsqu'un renversement ou un recul majeur est sur le point de se produire. L'indicateur identifie initialement les cassures et la dynamique des prix,
M1 Arrow
Oleg Rodin
4.67 (12)
Une stratégie intraday basée sur deux principes fondamentaux du marché. L'algorithme est basé sur l'analyse des volumes et des vagues de prix à l'aide de filtres supplémentaires. L'algorithme intelligent de l'indicateur ne donne un signal que lorsque deux facteurs de marché se combinent en un seul. L'indicateur calcule les vagues d'une certaine plage sur le graphique M1 en utilisant les données de la période la plus élevée. Et pour confirmer la vague, l'indicateur utilise une analyse en volume.
Advanced Supply Demand
Bernhard Schweigert
4.9 (271)
CURRENTLY 26% OFF !! Best Solution for any Newbie or Expert Trader! This indicator is a unique, high quality and affordable trading tool because we have incorporated a number of proprietary features and a new formula. With this update, you will be able to show double timeframe zones. You will not only be able to show a higher TF but to show both, the chart TF, PLUS the higher TF: SHOWING NESTED ZONES. All Supply Demand traders will love it. :) Important Information Revealed Maximize the potenti
IX Power MT4
Daniel Stein
5 (5)
IX Power apporte enfin la précision imbattable de FX Power aux symboles non-Forex. Il détermine avec précision l'intensité des tendances à court, moyen et long terme de vos indices, actions, matières premières, ETF et même crypto-monnaies préférés. Vous pouvez analyser tout ce que votre terminal a à offrir. Essayez-le et découvrez comment votre timing s'améliore considérablement lors de vos transactions. Caractéristiques principales d'IX Power Résultats de calcul précis à 100 %, sans ré
Plus de l'auteur
The C ycleTraderPro Close Strength Value Indicator measures the distance from the OPEN of a new bar to the CLOSE of that bar. Input - length = 10 default We add these values together going back the the length setting. If the 1st bar was plus 10 ticks and then the next bar was minus 7 ticks, then this would register +3 There are 2 ways to trade Close Strength Value: 1. Trading in the direction of lower highs and lower lows and vice versa for buys, higher highs, and higher lows.  2. Trade when th
FREE
CycleTraderPro CycleWave Indicator is 9 indicators in 1. It uses the CycleTraderPro Indicators and Patterns to identify Cycles and more in real time.  The 9 parts of CycleWave: Plots Cycle Bands and confirm Cycle High / Lows in real time after each successful cycle high or low. Plots Cycle Wave Price Windows above and below each bar using a modified % range of the previous bar. Automatically plots the Fibonacci Retracement from cycle low and highs after each cycle. Automatically plots Gann Fan
The CycleTraderPro Open/High/Low/Medium OHL takes the low and the high of the day and plots these values: 1. High of the day (Red Line) 2. Low of the day (Blue Line) 3. 25% from the low (Gray Line) 4. 50% of the range (Orange Line) 5. 75% from the low (Gray Line) We look to be long above the 50% range and short below You can easily see these levels as the market moves. If the market makes a new low or high, all the values will move automatically with the market's day. You can adjust these le
The CycleTraderPro Power Play Indicator (PPI) - is one of our favorite indicators. We take all the CT Indicators and combine them into one indicator.  The entire selection of indicators come with On/Off functions which means you can pick your own mix of indicators and only plot this mix.  We take an average of the mix chosen. When selecting 5 indicators, PPI will divide the mix values by 5. We then plot a cycle count for the direction of each move to help time you entry and exit plans. Red is do
The CycleTraderPro Orange Line - Bressert DDS - DoubleStoch - My father, Walter Bressert made these DDS famous for years. They work with code from stochastic and then smooths them out one more time using just 1 line. Depending on the length of the indicators, longer being for more trends and shorter for scalping the markets, the Orange Line is a 100 length.  There are 2 ways to trade the Orange Line: 1. Trade above and below the 50 level in the same direction. Above is a buy, below is a sell and
Filtrer:
Aucun avis
Répondre à l'avis