VWAPBands
- Indicateurs
- Paulo Henrique Faquineli Garcia
- Version: 1.6
- Mise à jour: 24 juin 2020
- Activations: 5
- Choose the symbol and the desired graphic time;
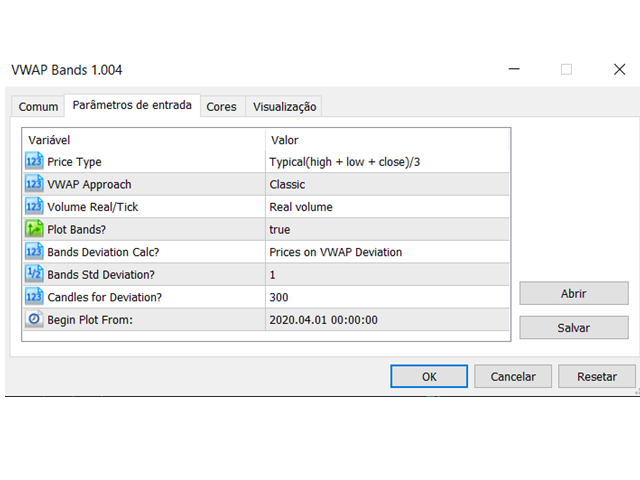
- Choose the type of price that is most suitable to calculate the Desired VWAP;
- Choose whether or not you want the Bands to be plotted;
- Choose the type of Volume you want to use (Ticks or Real);
- Choose the type of Calculation of the Bands (Deviation of Prices, Deviation of Prices in relation to VWAP, Deviation of Daily VWAP, Deviation of Price in relation to VWAP of Dollar in an Annualized Tick basis);
- Choose how many Deviations you want to use to plot the Bands;
- Choose how many candles you want to calculate deviations;
- Determine in the "Begin Plot" parameter the date and time of the BASE candle;
- Determines the VWAP Approach parameter to "MIDAS";
- Determine the type of prices such as HIGH for Upper Midas, LOW for Lower Midas;
- Okay, you got the Support / Resistance by the MIDAS method. Use the Bands to have better regions.
Finally, you can also obtain VWAP from the most recent HIGH VOLUME bar, from the period selected in the "Begin Plot" field:
- Determine in the "Begin Plot" parameter the start date of the highest volume candle;
- Determine the VWAP Approach parameter for "Highest Volume Bar";
- Other parameters according to the user's taste;
- The Plot will be from the most recent highest volume candle, any past before that will be ignored.
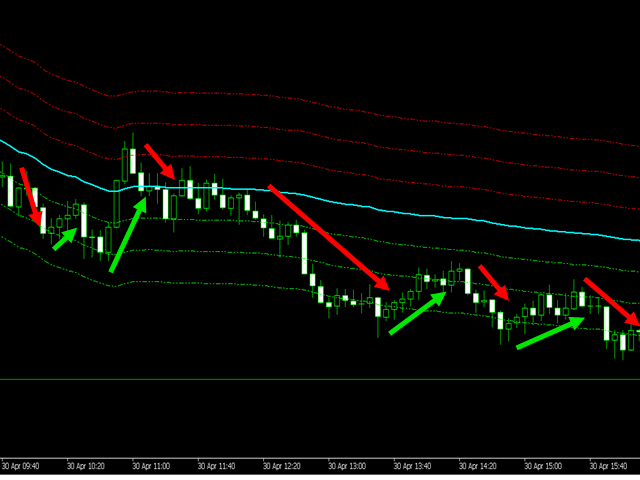
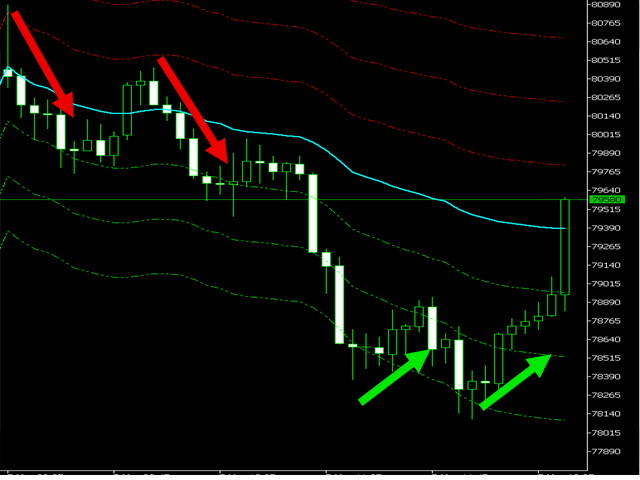
VWAP is an abbreviation for Volume Weighted Average Price. So, it is an average of the prices negotiated in a given period, weighted by the volume traded in these prices, serving for many as a level of "fight" because the players who made this average price have no interest in "losing" their average price . The bands are the points that we can consider for entering and leaving operations, according to their operation, also serving as price supports / resistances.
This indicator INCLUDES the current candlestick data, which means that you will always get the most recent values!


