• Aperçu
  • Avis (3)
  • Commentaires (12)
  • Nouveautés

Trend dashboard MT5

5

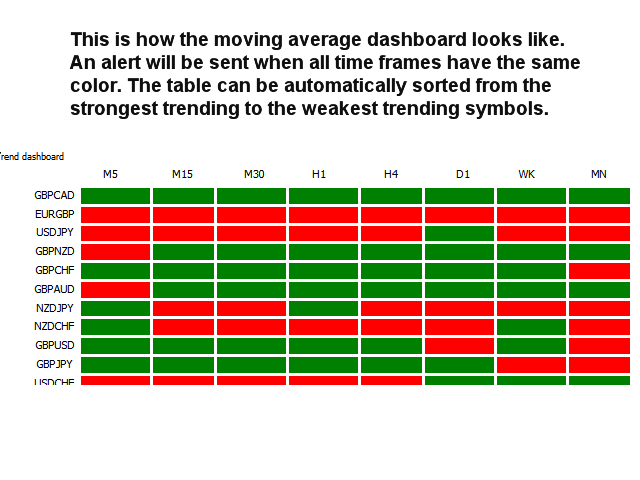
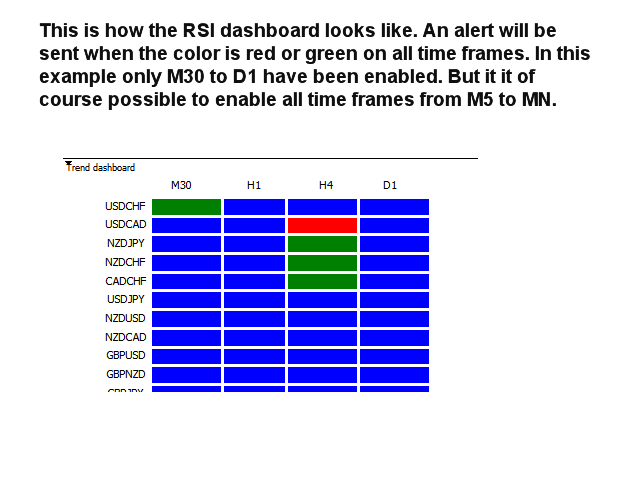
Cet indicateur de tendance à plusieurs périodes et à plusieurs symboles envoie une alerte lorsqu'une forte tendance ou un renversement de tendance a été identifié. Il peut le faire en choisissant de construire le tableau de bord à l'aide de la moyenne mobile (simple ou double (crossover MA)), RSI, bandes de Bollinger, ADX, indice composite (Constance M. Brown), Awesome (Bill Williams), MACD (ligne de signal ), Heiken Ashi lissé, moyenne mobile de Hull, croisements stochastiques, Gann HiLo Activator et Traders Dynamic Index. Il peut être utilisé avec toutes les plages horaires de M1 à MN. Max. 9 plages horaires peuvent être affichées dans le tableau de bord en même temps. Les couleurs du tableau de bord sont le vert pour haussier, rouge pour baissier et bleu pour neutre (valeurs de l'indicateur hors plage).

Combiné à vos propres règles et techniques, cet indicateur vous permettra de créer (ou d'améliorer) votre propre système puissant.

Caractéristiques

  • L'indicateur peut écrire les signaux dans des variables globales qui peuvent être utilisées par un Expert Advisor pour le trading automatique.
  • Il est possible de sélectionner jusqu'à 9 plages horaires à utiliser.
  • Effectue en permanence un tri par rang de force de tendance dans le tableau de bord. Il est cependant possible de désactiver ce tri pour faciliter la recherche d'un symbole spécifique. Les symboles seront alors visibles dans le même ordre qu'ils ont été saisis dans le paramètre Symboles ou dans l'ordre dans lequel ils sont visibles dans la fenêtre Market Watch.
  • En cliquant à l'intérieur d'un rectangle, un nouveau graphique sera ouvert avec le symbole et la période en question.

Il suffit de placer l'indicateur sur un graphique et vous recevrez une alerte de n'importe quel symbole de votre choix. Tous les types d'alertes sont pris en charge.

Paramètres d'entrée

S'il vous plaît trouver la description et l' explication des paramètres d'entrée ici .

Veuillez noter que cet indicateur n'est pas pris en charge dans le testeur de stratégie. Il ne tracera pas non plus de lignes et de flèches, ni ne vendra et n'achètera de conseils sur aucun graphique.

L'indicateur doit être placé sur une carte M5. Un graphique propre (vide) sans aucun autre indicateur ou Expert Advisor qui pourrait interférer avec le tableau de bord. Le tableau de bord sera chargé dans une fenêtre d'indicateur que vous pourrez ensuite étendre pour couvrir l'ensemble du graphique.


Avis 3
rbowen125
72
rbowen125 2023.11.16 03:47 
 

very satisfied with this software exactly what i needed to improve my trading

Devonish
2981
Devonish 2019.03.05 13:55 
 

I really like this tool, yes there are similar products out there, I even have some; but what I like about this particular indicator is the option to have it 'stack' the trends in order of strength and also the ability to flip to RSI reversal mode. Nice job :)

Produits recommandés
Cet indicateur multi-périodes et multi-symboles identifie le moment où la ligne de signal stochastique croise la ligne principale stochastique. Comme alternative, il peut également alerter lorsque la stochastique quitte (sans ligne de signal traversant la ligne principale) une zone de surachat/survente. En prime, il peut également rechercher les bandes de Bollinger et les croisements de surachat/survente RSI. Combiné avec vos propres règles et techniques, cet indicateur vous permettra de créer (
Cet indicateur de tableau de bord de divergence multi périodes et multi symboles envoie une alerte lorsqu'une ou deux divergences différentes ont été identifiées sur plusieurs périodes et non sur des divergences uniques. Il peut être utilisé avec toutes les plages horaires de M1 à MN. Un maximum de 9 périodes peuvent être affichées dans le tableau de bord en même temps. Il est possible d'activer le filtre de tendance de la moyenne mobile, du RSI ou des bandes de Bollinger pour filtrer uniquement
Cet indicateur à plusieurs périodes et à plusieurs symboles recherche les barres à épingles, les étoiles du matin/soir, les engloutissements, les pinces à épiler, les frappes à trois lignes, les barres intérieures, les fanions et les triangles.   L'indicateur peut également être utilisé en mode graphique unique. Veuillez en savoir plus sur cette option dans le produit   blogue .   Combiné à vos propres règles et techniques, cet indicateur vous permettra de créer (ou d'améliorer) votre propre sys
Signal Eskiya, in addition to channel lines, reflects entry signals in the form of arrows. Trading strategies using the channel indicator belong to the classic methods of technical analysis, are easy to execute, and therefore available even to beginners. Price ranges work equally well on any trading assets and timeframes, they can be used both independently and with additional confirmation from oscillators and market volumes. American traders say: “Trend is your friend”, which means “Trend is
In the Forex trading system, the Pivot Points trading method is a classic trading strategy. Pivot Points is a very simple resistance support system. Based on yesterday’s highest, lowest and closing prices, seven price points are calculated, including one pivot point, three resistance levels and three support levels. The resistance line and the support line are one of the tools that are often used in technical analysis, and the role of the support line and the pressure line can be mutually tran
The indicator ‘Probability Range Bands’ gives a prediction of the amount, how much the asset is moving from its current price. The range bands give probabilities, that the candle close will not exceed this certain price level. It is also called the expected move for the current candle close.   This Indicator is based on statistical methods, probabilities and volatility. Asset price is assumed to follow a log-normal distribution. Therefore, log returns are used in this indicator to determine the
Murrey Math Lines The concept of this technical analysis system was developed by T. Henning Murrey in 1995 and described in The Murrey Math Trading System; For All Markets. The main concept here is that all markets behave in the same manner based upon the observations made by W.D. Gann. To date, the Murrey Math Line X it is one the most popular methods of Forex analysis and trading. Formula The Murrey Math Line X is calculated with the help of price movement segment, which, in accordance to Gan
Santa Trend
Marco Aurelio Cestari
4.22 (9)
Santa Trend Indicator  is an efficient way to forecast and detect the trend in any market. Advantages Generates instant buy and sell signals. Provides an alternate exit strategy to your existing trading system. Never repaints, never backpaints, never recalculates. Works in all symbols and all timeframes. Perfect trend filter for any strategy or expert advisor. Fully compatible with Expert Advisor (EA) development. Does not lag.
FREE
Zigzag X Fibo
Ian David Emmanuel Bello
The ZigZag indicator's main objective is to highlight significant price movements by filtering out minor price fluctuations. It enables the visualization of trends by eliminating market "noise," which can assist traders in making more informed decisions. Adding the Fibonacci indicator, which is a powerful tool for identifying potential support and resistance levels in financial markets.
Kill Zones MT5
Diego Arribas Lopez
MT4 Version Kill Zones Kill Zones allows you to insert up to 3 time zones in the chart. The visual representation of the Kill Zones in the chart together with an alert and notification system helps you to ignore fake trading setups occurring outside the Kill Zones or specific trading sessions. Using Kill Zones in your trading will help you filter higher probability trading setups. You should select time ranges where   the market   usually reacts with high volatility. Based on   EST time zone, f
Considering the main theories of Forex (Dow Theory, support lines, chart patterns, and Fibonacci retracements), It tells you the price range where whales (large investors) are likely to appear. You can trade at the price points that professionals also aim for. You no longer have to warry about where to aim next. We are live-streaming the actual operation of the system. Please check for yourself if it is usable. Please check it out for yourself. https://www.youtube.com/@ganesha_forex We do n
Cet indicateur de tableau de bord d'offre et de demande à plusieurs périodes et à plusieurs symboles envoie des alertes lorsque le prix a atteint une zone d'offre/demande. Il est également possible de l'utiliser pour être alerté des doubles hauts/bas réguliers au lieu des zones. Il peut être utilisé avec toutes les plages horaires de M1 à MN.       Un maximum de 9 périodes peuvent être affichées dans le tableau de bord en même temps.   Il est possible d'utiliser des filtres RSI, divergence (MACD
I  recommend you to read the   product's blog  (manual) from start to end so that it is clear from the beginning what the indicator offers. This multi time frame and multi symbol indicator scans for engulfing and tweezer formations.  The indicator can also be used in single chart mode. Combined with your own rules and techniques, this indicator will allow you to create (or enhance) your own powerful system. Features Can monitor all symbols visible in your Market Watch window at the same time. A
Didi Index
Flavio Javier Jarabeck
4.79 (24)
The famous brazilian trader and analyst Didi Aguiar created years ago a study with the crossing of 3 Simple Moving Averages called "Agulhada do Didi", then later was also named Didi Index, as a separate indicator. The period of those SMAs are 3, 8 and 20. As simple as that, this approach and vision bring an easy analysis of market momentum and trend reversal to those traders looking for objective (and visual) information on their charts. Of course, as always, no indicator alone could be used wit
FREE
Simple indicator to calculate fibonacci retracement levels on time. Add to chart and move trend line to set the fibonacci retracement levels. Inputs Levels  - levels for which to calculate values, separated by space, default are fibonacci levels Show time  - if true, time will be shown on levels Show date  - if true, date will be shown on levels Show fibonacci level  - if true, value of levels will be shown Fibonacci lines color  - color of levels Trend line color  - color of trend line which de
FREE
Analyze potential   Covered Call   structures in the Brazilian market. Define where you want the break-even of your structure and see what structure to use. It works for any asset that has authorized series of options on B3 (Brazilian Stock Exchange). Associate the indicator to the asset you want to set up the Covered Call. *** ATENTION *** For the robot to work, the service that consults the authorized series of B3 options must be running on your terminal. Download the utility for free from
FREE
Bar Sequential
Maximiliano Frisione Figueroa
This indicator can help you clearly identify trend changes in both bullish and bearish markets. The indicator compares the closing price of the last candle with the closing price of the candle "X" periods ago (input parameter). In an uptrend, an initial number '1' is plotted if a candle closes higher than the closing of a candle "X" periods ago. In a downtrend, an initial number '1' is plotted if a candle closes below the closing of a candle "X" periods ago. Subsequent numbers are plotted when e
FREE
mql4 version:  https://www.mql5.com/en/market/product/44606   Simple indicator to calculate profit on fibonacci retracement levels with fixed lot size, or calculate lot size on fibonacci levels with fixed profit. Add to chart and move trend line to set the fibonacci retracement levels. Works similar as default fibonacci retracement line study in Metatrader. Inputs Fixed  - select what value will be fix, lot or profit Fixed value  - value that will be fix on all levels Levels  - levels for which
This indicator helps to identify market sessions, It's High/Low, Open Range (OR), range of the sessions in pips and percentage of previous day (change%) under OHLC.   It is also editable for any brokerage market watch time. For traders who use session trading strategies such as Mark B. Fisher ACD it can be super effective, where they can edit OR from the settings to either line or box.  We tried to make the settings easier to edit, for traders' use on different markets, charts and brokerage t
The indicator scans for TD Sequential signals in multiple timeframes for the all markets filtered and shows the results on Dashboard. Key Features Dashboard can be used for all markets It can scan for signals on MN1, W1, D1, H4, H1, M30, M15 ,M5, M1 timeframes Parameters UseMarketWatch: Set true to copy all symbols available in market watch MarketWatchCount : Set the number of symbols that you want to copy from the market watch list. CustomSymbols: Enter the custom symbols that you want to be a
I recommend you to read the   product's blog  (manual) from start to end so that it is clear from the beginning what the indicactor offers. This multi time frame and multi symbol indicator can identify the following 5 crosses: when a fast moving average crosses a slow moving average line. when price has reached a single moving average (closed above/below or just bounced). when a triple moving average formation has appeared (all 3 MA:s in consecutive alignment) when the MACD main line crosses th
ReSu mt5
Daniel Opoku
The Wamek Support and Resistant (WSR) Indicator is a remarkable tool that stands out in the world of technical analysis. It sets itself apart by cleverly combining price action and leading indicators to delineate support and resistance levels with a high degree of accuracy. Its unique feature is its adaptability; users can fine-tune the indicator by adjusting input parameters, enabling them to create customized support and resistance levels that suit their trading strategies. Notably, one of WSR
Product Description: Adaptive Y-Axis Scaling is a powerful MT5 indicator designed to enhance your trading experience by providing precise control over the Y-axis (price) scaling of your charts. This innovative tool allows you to customize the price scaling by specifying the number of pips from the visible chart's highs and lows. The calculated price range from this input is then used to set the maximum and minimum prices for the open chart, ensuring an optimized and comprehensive view of market
FREE
Moving Average Trend Scanner is a multi symbol multi timeframe triple MA crossover dashboard that helps traders to monitor, and identify potential market trends from one chart. This panel scans 3 moving averages in up to 28 configurable instruments and 9 timeframes for triple moving average alignment and moving average crossover with a deep scan feature to scan all market watch symbols (up to 1000 instruments!).   Download Demo   here   (Scans only M1 and M6) Settings description   here MT4 v
The key to success is always a good optimisation. The system has a number of variables and in this case its simplicity is the key to its success. The system looks for the different "Gaps" as market entry failures and then filters them through a series of Moving Averages to decide whether it should enter or not. It is a simple but powerful system. The variables are the following: Lot: Defines the lot size. TakeProfit : Defines the take profit in pips. Stop Loss: Defines the stop loss
FREE
FIlter Profesional
Ignacio Agustin Mene Franco
Filter Professional , Safari pack indicator 3, It has an indicator that is a type of moving average with color that will mark the entrance perfect at different times, when it marks the green line, an upward trend is coming and it is entry for purchase, when it marks the gold line it is a downtrend gives bearish entry zone. It is used for the Forex markets and synthetic indices all pairs! All temporalities! Good profit!
SMARTMASS INDICATOR This indicator is different from all known volume indicators. It has a significant distinction; it is an algorithm that relates price movement to volume, attempting to find proportionality and efficient movement while filtering out noise and other movements that are more random and do not follow a trend or reversal. Ultimately, it reveals the true strength of the movement, indicating whether it has genuine support from bulls or bears or if it's merely a high-volume movemen
Insight Pro is a comprehensive tool for market analysis. It offers various features such as trend analysis, resistance and support levels, and distribution analysis, suitable for both novice and experienced traders. Features Trend Analysis Detects and visualizes market trends. Suggests potential entry and exit points based on trends. Customizable trend lines for clear market direction. Displays extreme levels based on standard deviation. Positive slope indicates buy orders; negative slope indic
MetaForecast M5
Vahidreza Heidar Gholami
5 (2)
MetaForecast prédit et visualise l'avenir de n'importe quel marché en se basant sur les harmoniques des données de prix. Bien que le marché ne soit pas toujours prévisible, s'il y a un motif dans les prix, MetaForecast peut prédire l'avenir aussi précisément que possible. Comparé à d'autres produits similaires, MetaForecast peut générer des résultats plus précis en analysant les tendances du marché. Paramètres d'entrée Past size (Taille passée) Spécifie le nombre de barres que MetaForecast uti
High And Low MT5
Dmitriy Parfenovich
On the current chart, this indicator displays candlestick highs and lows of another time frame. Input Parameters: TimeFrame - chart time frame whose data will be displayed on the current price chart (by default, H12). Time Zone - shift of the indicator by time zone relative to the broker's time (by default, Broker-1). If the broker's time zone is UTC+1 and the Time Zone parameter is set to Broker-1, the bends of the indicator will be plotted in multiples of Greenwich Time. Indicator buffer value
Les acheteurs de ce produit ont également acheté
Atomic Analyst MT5
Issam Kassas
5 (15)
Tout d'abord, il convient de souligner que cet indicateur de trading n'est ni repainting, ni redrawing et ne présente aucun délai, ce qui le rend idéal à la fois pour le trading manuel et automatisé. Manuel de l'utilisateur : réglages, entrées et stratégie. L'Analyste Atomique est un indicateur d'action sur les prix PA qui utilise la force et le momentum du prix pour trouver un meilleur avantage sur le marché. Équipé de filtres avancés qui aident à éliminer les bruits et les faux signaux, et à
Quantum Trend Sniper
Bogdan Ion Puscasu
5 (46)
Présentation       Quantum Trend Sniper Indicator   , l'indicateur révolutionnaire MQL5 qui transforme la façon dont vous identifiez et négociez les inversions de tendance ! Développé par une équipe de traders expérimentés avec une expérience commerciale de plus de 13 ans,       Indicateur Quantum Trend Sniper       est conçu pour propulser votre parcours de trading vers de nouveaux sommets grâce à sa manière innovante d'identifier les inversions de tendance avec une précision extrêmement élevée
Tout d'abord, il convient de souligner que ce système de trading est un indicateur non repeint, non redessiné et non retardé, ce qui le rend idéal pour le trading manuel et automatisé. Cours en ligne, manuel et téléchargement de préréglages. Le "Système de Trading Smart Trend MT5" est une solution de trading complète conçue pour les traders débutants et expérimentés. Il combine plus de 10 indicateurs premium et propose plus de 7 stratégies de trading robustes, ce qui en fait un choix polyvalent
Top indicator for MT5   providing accurate signals to enter a trade without repainting! It can be applied to any financial assets:   forex, cryptocurrencies, metals, stocks, indices .  Watch  the video  (6:22) with an example of processing only one signal that paid off the indicator! MT4 version is here It will provide pretty accurate trading signals and tell you when it's best to open a trade and close it. Most traders improve their trading results during the first trading week with the help of
Gold Stuff mt5
Vasiliy Strukov
4.9 (181)
Gold Stuff mt5 est un indicateur de tendance conçu spécifiquement pour l'or et peut également être utilisé sur n'importe quel instrument financier. L'indicateur ne se redessine pas et ne traîne pas. Délai recommandé H1. Contactez-moi immédiatement après l'achat pour obtenir les réglages et un bonus personnel !   Vous pouvez obtenir une copie gratuite de notre indicateur Strong Support et Trend Scanner, veuillez envoyer un message privé. moi!   RÉGLAGES Dessiner la flèche - on off. dessine
AT Forex Indicator MT5
Marzena Maria Szmit
5 (4)
The AT Forex Indicator MT5 is a sophisticated trading tool designed to provide traders with a comprehensive analysis of multiple currency pairs. This powerful indicator simplifies the complex nature of the forex market, making it accessible for both novice and experienced traders. AT Forex Indicator uses advanced algorithms to detect trends, patterns and is an essential tool for traders aiming to enhance their forex trading performance. With its robust features, ease of use, and reliable signal
FX Power MT5 NG
Daniel Stein
5 (5)
Obtenez votre mise à jour quotidienne du marché avec des détails et des captures d'écran via notre Morning Briefing ici sur mql5 et sur Telegram ! FX Power MT5 NG est la nouvelle génération de notre très populaire indicateur de force des devises, FX Power. Et qu'est-ce que ce compteur de force de nouvelle génération offre ? Tout ce que vous avez aimé de l'original FX Power PLUS Analyse de la force de l'OR/XAU Des résultats de calcul encore plus précis Périodes d'analyse configurables individuel
Trend Screener Pro MT5
STE S.S.COMPANY
4.88 (66)
Indicateur de tendance, solution unique révolutionnaire pour le trading et le filtrage des tendances avec toutes les fonctionnalités de tendance importantes intégrées dans un seul outil ! Il s'agit d'un indicateur multi-période et multi-devises 100 % non repeint qui peut être utilisé sur tous les symboles/instruments : forex, matières premières, crypto-monnaies, indices et actions. Trend Screener est un indicateur de suivi de tendance efficace qui fournit des signaux de tendance fléchés avec des
TPA True Price Action indicator reveals the true price action of the market makers through 100% non-repainting signals strictly at the close of a candle! TPA shows entries and re-entries, every time the bulls are definitely stronger than the bears and vice versa. Not to confuse with red/green candles. The shift of power gets confirmed at the earliest stage and is ONE exit strategy of several. There are available now two free parts of the TPA User Guide for our customers. The first "The Basics"
Tout d'abord, il convient de souligner que cet outil de trading est un indicateur non repeint, non redessiné et non retardé, ce qui le rend idéal pour le trading professionnel. Cours en ligne, manuel utilisateur et démonstration. L'indicateur Smart Price Action Concepts est un outil très puissant à la fois pour les nouveaux et les traders expérimentés. Il regroupe plus de 20 indicateurs utiles en un seul, combinant des idées de trading avancées telles que l'analyse du trader Inner Circle et
FX Volume MT5
Daniel Stein
4.94 (17)
Obtenez votre mise à jour quotidienne du marché avec des détails et des captures d'écran via notre Morning Briefing ici sur mql5 et sur Telegram ! FX Volume est le PREMIER et SEUL indicateur de volume qui fournit un VRAI aperçu du sentiment du marché du point de vue d'un courtier. Il fournit des informations impressionnantes sur la façon dont les acteurs institutionnels du marché, comme les courtiers, sont positionnés sur le marché des changes, bien plus rapidement que les rapports COT. Voir c
Reversal First Impulse levels (RFI)      INSTRUCTIONS        RUS       -       ENG              R ecommended to use with an indicator   -   TPSpro  TREND PRO -  Version MT4                 A key element in trading is zones or levels from which decisions to buy or sell a trading instrument are made. Despite attempts by major players to conceal their presence in the market, they inevitably leave traces. Our task was to learn how to identify these traces and interpret them correctly. Main functi
TPSproTREND PrO MT5
Roman Podpora
4.88 (8)
TPSpro TRENDPRO  - is a trend indicator that automatically analyzes the market and provides information about the trend and each of its changes, as well as giving signals for entering trades without redrawing! The indicator uses each candle, analyzing them separately. referring to different impulses - up or down impulse. Exact entry points into transactions for currencies, crypto, metals, stocks, indices!  -  Version MT4               DETAILED DESCRIPTION               R ecommended to use with
Was: $249  Now: $99   Market Profile defines a number of day types that can help the trader to determine market behaviour. A key feature is the Value Area, representing the range of price action where 70% of trading took place. Understanding the Value Area can give traders valuable insight into market direction and establish the higher odds trade. It is an excellent addition to any system you may be using. Inspired by Jim Dalton’s book “Mind Over Markets”, this indicator is designed to suit the
ICT, SMC, SMART MONEY CONCEPTS, SMART MONEY, Smart Money Concept, Support and Resistance, Trend Analysis, Price Action, Market Structure, Order Blocks, BOS/CHoCH,   Breaker Blocks ,  Momentum Shift,   Supply&Demand Zone/Order Blocks , Strong Imbalance,   HH/LL/HL/LH,    Fair Value Gap, FVG,  Premium  &   Discount   Zones, Fibonacci Retracement, OTE, Buy Side Liquidity, Sell Side Liquidity, BSL/SSL Taken, Equal Highs & Lows, MTF Dashboard, Multiple Time Frame, BigBar, HTF OB, HTF Market Structure
XQ Indicator MetaTrader 5
Marzena Maria Szmit
5 (1)
Step into the realm of Forex trading with confidence and precision using XQ, a cutting-edge Forex indicator designed to elevate your trading game to unprecedented heights. Whether you're a seasoned trader or just stepping into the world of currency exchange, XQ Forex Indicator empowers you with the insights and signals needed to make informed trading decisions. The signal conditions are a combination of three indicators, and XQ Forex Indicator only display  medium and long-term trends . The ind
Blahtech Supply Demand MT5
Blahtech Limited
4.54 (13)
Was: $299  Now: $99   Supply Demand uses previous price action to identify potential imbalances between buyers and sellers. The key is to identify the better odds zones, not just the untouched ones. Blahtech Supply Demand indicator delivers functionality previously unavailable on any trading platform. This 4-in-1 indicator not only highlights the higher probability zones using a multi-criteria strength engine, but also combines it with multi-timeframe trend analysis, previously confirmed swings
Matrix Arrow Indicator MT5
Juvenille Emperor Limited
5 (14)
Matrix Arrow Indicator MT5   est une tendance unique 10 en 1 suivant un indicateur multi-période   100% non repeint   qui peut être utilisé sur tous les symboles/instruments:   forex ,   matières premières ,   crypto-monnaies ,   indices ,  actions .  Matrix Arrow Indicator MT5  déterminera la tendance actuelle à ses débuts, en rassemblant des informations et des données à partir d'un maximum de 10 indicateurs standard, qui sont: Indice de mouvement directionnel moyen (ADX) Indice de canal de m
Advanced Supply Demand MT5
Bernhard Schweigert
4.53 (15)
La meilleure solution pour tout commerçant débutant ou expert ! Cet indicateur est un outil de trading unique, de haute qualité et abordable car nous avons intégré un certain nombre de fonctionnalités propriétaires et une nouvelle formule. Avec cette mise à jour, vous pourrez afficher des zones à double horaire. Vous pourrez non seulement afficher un TF plus élevé, mais afficher les deux, le graphique TF, PLUS le TF supérieur : AFFICHAGE DES ZONES NICHÉES. Tous les traders Supply Demand vont ado
Bill Williams Advanced
Siarhei Vashchylka
5 (7)
Bill Williams Advanced is designed for automatic chart analysis using Bill Williams' "Profitunity" system. The indicator analyzes four timeframes at once. Manual (Be sure to read before purchasing) Advantages 1. Automatically analyzes the chart using the "Profitunity" system of Bill Williams. The found signals are placed in a table in the corner of the screen. 2. Equipped with a trend filter based on the Alligator indicator. Most of the system signals are recommended to be used only accordi
Legacy of Gann for MT5
Pavel Zamoshnikov
5 (6)
The indicator very accurately determines the levels of the possible end of the trend and profit fixing. The method of determining levels is based on the ideas of W.D.Gann, using an algorithm developed by his follower Kirill Borovsky. Extremely high reliability of reaching levels (according to K. Borovsky  - 80-90%) Indispensable for any trading strategy – every trader needs to determine the exit point from the market! Precisely determines targets on any timeframes and any instruments (forex, met
Ce tableau de bord affiche les derniers   modèles harmoniques   disponibles pour les symboles sélectionnés, ce qui vous permettra de gagner du temps et d'être plus efficace /   version MT4 . Indicateur gratuit:   Basic Harmonic Pattern Colonnes de l'indicateur Symbol :   les symboles sélectionnés apparaissent Trend   :   haussière ou baissière Pattern :   type de motif (gartley, papillon, chauve-souris, crabe, requin, cypher ou ABCD) Entry:   prix d'entrée SL:   prix du stop loss TP1:   1
Présentation       Quantum Breakout PRO   , l'indicateur révolutionnaire MQL5 qui transforme la façon dont vous négociez les zones d'évasion ! Développé par une équipe de traders expérimentés avec une expérience commerciale de plus de 13 ans,       Évasion quantique PRO       est conçu pour propulser votre parcours commercial vers de nouveaux sommets grâce à sa stratégie de zone de discussion innovante et dynamique. Quantum Breakout Indicator vous donnera des flèches de signalisation sur le
Gartley Hunter Multi
Siarhei Vashchylka
5 (7)
Gartley Hunter Multi - An indicator for searching for harmonic patterns simultaneously on dozens of trading instruments and on all possible timeframes. Manual (Be sure to read before purchasing) | Version for MT4 Advantages 1. Patterns: Gartley, Butterfly, Shark, Crab. Bat, Alternate Bat, Deep Crab, Cypher 2. Simultaneous search for patterns on dozens of trading instruments and on all possible timeframes 3. Search for patterns of all possible sizes. From the smallest to the largest 4. A
Auto Order Block with break of structure based on ICT and Smart Money Concepts (SMC) Futures Break of Structure ( BoS )             Order block ( OB )            Higher time frame Order block / Point of Interest ( POI )    shown on current chart           Fair value Gap ( FVG ) / Imbalance   -  MTF      ( Multi Time Frame )    HH/LL/HL/LH  -  MTF      ( Multi Time Frame )  Choch  MTF      ( Multi Time Frame )  Volume Imbalance     ,  MTF          vIMB Gap’s Power of 3 Equal High
SMCpro
Arief
5 (1)
Currently Price  20% OFF  ( for unlimited use ) Indicator   USER MANUAL , trade setups, solving issues, etc :  Direct Download Here     (  for users only  ) Hello World! Introducing.. SMCpro tool and Indicator for  MetaTrader 5 , a cutting-edge feature designed to revolutionize your trading experience. With innovative ICT Smart Money Concept, you gain unparalleled insight into market dynamics, empowering you to make informed trading decisions like never before. SMC Indicator built on th
Volume by Price MT5
Brian Collard
4.2 (5)
The Volumebyprice.com Indicator for MetaTrader 5 features Volume Profile and Market Profile TPO (Time Price Opportunity). Volume and TPO histogram bar and line charts. Volume Footprint charts. TPO letter and block marker collapsed and split structure charts. Session filtering and grouping. Static, dynamic and flexible range segmentation and compositing methods with relative and absolute visualizations. Graphical layering, positioning and styling options to suit the user's analytic and aesthetic
AW Trend Predictor MT5
AW Trading Software Limited
4.78 (58)
La combinaison des niveaux de tendance et de panne dans un seul système. Un algorithme d'indicateur avancé filtre le bruit du marché, détermine la tendance, les points d'entrée, ainsi que les niveaux de sortie possibles. Les signaux indicateurs sont enregistrés dans un module statistique, qui vous permet de sélectionner les outils les plus appropriés, montrant l'efficacité de l'historique des signaux. L'indicateur calcule les marques Take Profit et Stop Loss. Manuel et instruction ->   ICI   / v
Owl Smart Levels MT5
Sergey Ermolov
4.39 (38)
Version MT4   |  FAQ L' indicateur Owl Smart Levels est un système de trading complet au sein d'un seul indicateur qui comprend des outils d'analyse de marché populaires tels que les fractales avancées de Bill Williams , Valable ZigZag qui construit la structure d'onde correcte du marché et les niveaux de Fibonacci qui marquent les niveaux exacts d'entrée. sur le marché et les endroits où prendre des bénéfices. Description détaillée de la stratégie Mode d'emploi de l'indicateur Conseiller-Assis
This is arguably the most complete harmonic price formation auto-recognition indicator you can find for the MetaTrader Platform. It detects 19 different patterns, takes fibonacci projections as seriously as you do, displays the Potential Reversal Zone (PRZ) and finds suitable stop-loss and take-profit levels. [ Installation Guide | Update Guide | Troubleshooting | FAQ | All Products ] It detects 19 different harmonic price formations It plots primary, derived and complementary Fibonacci p
Plus de l'auteur
Cet indicateur à plusieurs périodes et à plusieurs symboles identifie les formations haut/bas doubles ou triples ou une cassure de décolleté suivante (haut/bas confirmé). Il offre des filtres RSI, pin bar, engloutissant, pince à épiler, étoile du matin/soir ainsi que des options de filtre de divergence qui permettent de filtrer uniquement les configurations les plus fortes.       L'indicateur peut également être utilisé en mode graphique unique. Veuillez en savoir plus sur cette option dans le p
The indicator identifies when a divergence occurs between price and an indicator or oscillator. It identifies both regular and hidden divergences. Combined with your own rules and techniques, this indicator will allow you to create (or enhance) your own powerful system. Features Can detect divergences for the following oscillators/indicators:   MACD, OsMA, Stochastics, RSI, CCI, RVI, Awesome, ADX, ATR, OBV, Composite index, MFI and Momentum. Only one oscillator/indicator can be selected. Draws
FREE
Cet indicateur multi-périodes et multi-symboles identifie le moment où la ligne de signal stochastique croise la ligne principale stochastique. Comme alternative, il peut également alerter lorsque la stochastique quitte (sans ligne de signal traversant la ligne principale) une zone de surachat/survente. En prime, il peut également rechercher les bandes de Bollinger et les croisements de surachat/survente RSI. Combiné avec vos propres règles et techniques, cet indicateur vous permettra de créer (
I recommend you to read the  product's blog  (manual) from start to end so that it is clear from the beginning what the EA offers. This Expert Advisor (EA) is designed to trade on a rapid price movement following a news event. The EA trades multiple symbols from one single chart which must be a EURUSD H1 chart. It it advisable to remove all symbols you don't trade from the Market Watch to reduce the overall data demand. The 'Auto settings' input parameter value True must only be used you have s
Je vous recommande de lire le   blog (manuel) du produit   du début à la fin afin que ce soit clair dès le début ce que propose EA. Cet Expert Advisor identifie lorsqu'une divergence se produit entre le prix et un oscillateur/indicateur. Il identifie à la fois les divergences régulières/classiques (inversion de tendance) et cachées (poursuite de la tendance). Il propose des options de zone offre/demande, RSI, Bollinger, stochastique, moyenne mobile (MA régulière et Hull MA), ADX et filtre de vo
Cet indicateur multi-temps et multi-symboles identifie les motifs double haut/bas, tête et épaule, fanion/triangle et drapeau. Il est également possible de configurer des alertes uniquement lorsqu'une cassure de décolleté/triangle/mât de drapeau s'est produite (rupture de décolleté = signal confirmé pour le haut/les bas et la tête et les épaules).       L'indicateur peut également être utilisé en mode graphique unique. Veuillez en savoir plus sur cette option dans le produit   blogue . Combiné à
Please if possible consider the  paid version  which I will continue to develop (there will be no future updates for this free version). This Expert Advisor identifies when a divergence occurs between price and an oscillator/indicator. It identifies both regular/classical (trend reversal) and hidden (trend continuation) divergences. It has RSI, bollinger, stochastics, moving average and ADX filter options which makes it possible to filter out only the strongest setups. The default settings ar
FREE
I recommend you to read the   product's blog  (manual) from start to end so that   it is clear from the beginning what the indicator offers. This multi oscillator, multi time frame and multi symbol indicator identifies when a divergence occurs between price and an oscillator/indicator. It identifies both regular/classical (trend reversal) and hidden (trend continuation) divergences. It has moving average, RSI/Bollinger, ADX, pin bar and engulfing filter options which makes it possible to filter
The indicator identifies when a divergence occurs between price and an indicator or oscillator. It identifies bullish and bearish hidden or regular (classical) divergences. Combined with your own rules and techniques, this indicator will allow you to create (or enhance) your own powerful system. Features Can detect divergences for the following indicators/oscillators: MACD, OsMA (Moving average of Oscillator), Stochastics, RSI, CCI, RVI, Awesome (AO), ADX, ATR, OBV, MFI, Momentum and   Composi
FREE
Cet indicateur reconnaît un type spécial de formation de barre intérieure qui est formée d'une grande bougie principale suivie de 4 bougies plus petites (veuillez consulter l'explication de la stratégie ci-dessous). Caractéristiques Trace les lignes d'arrêt d'achat/vente sur le graphique ainsi que les niveaux de profit et d'arrêt de perte. Les niveaux TP/SL sont basés sur l'indicateur Average True Range (ATR). Les couleurs des objets sont modifiables. Vous envoie une alerte en temps réel lorsqu'
This multi symbol indicator has been designed to automatically identify when price reaches major psychological levels. Also known as round numbers, whole numbers or key levels. As a bonus it can also scan for pivot point level on one selected time frame. Combined with your own rules and techniques, this indicator will allow you to create (or enhance) your own powerful system. Features Can write the signals to a file which can be used by an Expert Advisor for auto trading. Can monitor all symbol
I recommend you to read the   product's blog  (manual) from start to end so that it is clear from the beginning what the indicactor offers. This multi time frame and multi symbol divergence dashboard indicator sends an alert when one or two different divergences have been identified. It can be used with all time frames from M1 to MN. It is possible to enable moving average or RSI trend filter to filter out only the strongest setups. Combined with your own rules and techniques, this indicator wi
This indicator can send alerts when a Heiken Ashi Smoothed color change occurs. Combined with your own rules and techniques, this indicator will allow you to create (or enhance) your own powerful system. Features Can send all types of alerts. Option to delay the alert one or more bars in order to confirm the color (trend) change. Input parameters Candle shift for alert: Default is 1. Setting it to 0 will alert you on color change on the current candle. This should be regarded as a pending (uncon
FREE
I recommend you to read the   product's blog  (manual) from start to end so that it is clear from the beginning what the indicactor offers. This multi time frame and multi symbol indicator can identify the following 5 crosses: when a fast moving average crosses a slow moving average line. when price has reached a single moving average (closed above/below or just bounced). when a triple moving average formation has appeared (all 3 MA:s in consecutive alignment) when the MACD main line crosses th
This indicator can send alerts when a Heiken Ashi Smoothed color change occurs. Combined with your own rules and techniques, this indicator will allow you to create (or enhance) your own powerful system. Features Can send all types of alerts. Option to delay the alert one bar in order to confirm the color (trend) change. Input parameters Wait for candle close: 'true' or 'false'. Setting it to 'true' will delay the alert to the opening of the bar following the bar where the color change occurred.
FREE
Cet indicateur de tableau de bord de divergence multi périodes et multi symboles envoie une alerte lorsqu'une ou deux divergences différentes ont été identifiées sur plusieurs périodes et non sur des divergences uniques. Il peut être utilisé avec toutes les plages horaires de M1 à MN. Un maximum de 9 périodes peuvent être affichées dans le tableau de bord en même temps. Il est possible d'activer le filtre de tendance de la moyenne mobile, du RSI ou des bandes de Bollinger pour filtrer uniquement
Features This is an indicator that recognizes a special type of Inside Bar formation which is formed by a Master candle followed by 4 smaller candles (please see the strategy explanation below). Plots buy/sell stop lines on the chart as well as well as take profit and stop loss levels. The TP/SL levels are based on the Average True Range (ATR) indicator. Object colors are changeable. Sends you a real-time alert when a Master candle formation is identified - sound / pop-up / email / push notifica
Je vous recommande de lire le       blog du produit   (manuel) du début à la fin afin que       il est clair dès le début ce que propose l'EA. La stratégie principale de cet Expert advisor (EA) est de placer des trades lorsque 3 moyennes mobiles (MA) sont alignées consécutivement et à une certaine distance l'une de l'autre (elle peut être utilisée par exemple pour une stratégie peu connue utilisée par certains traders institutionnels , ce qui implique les MA 10, 20 et 30 sur la plage horaire D1
Cet indicateur à plusieurs périodes et à plusieurs symboles identifie les formations haut/bas doubles ou triples ou une cassure de décolleté suivante (haut/bas confirmé). Il offre des filtres RSI, pin bar, engloutissant, pince à épiler, étoile du matin/soir ainsi que des options de filtre de divergence MACD, Awesome (AO) ou RSI qui permettent de filtrer uniquement les configurations les plus fortes.       L'indicateur peut également être utilisé en mode graphique unique. Veuillez en savoir plus
Cet indicateur de tableau de bord d'offre et de demande à plusieurs périodes et à plusieurs symboles envoie des alertes lorsque le prix a atteint une zone d'offre/demande. Il est également possible de l'utiliser pour être alerté des doubles hauts/bas réguliers au lieu des zones. Il peut être utilisé avec toutes les plages horaires de M1 à MN.       Un maximum de 9 périodes peuvent être affichées dans le tableau de bord en même temps.   Il est possible d'utiliser des filtres RSI, divergence (MACD
Veuillez si possible envisager d'acheter le       Version MT5   que je continuerai à développer (il n'y aura pas de futures mises à jour pour cette version MT4). Je vous recommande également de lire       blog du produit   (manuel) du début à la fin afin qu'il soit clair dès le début ce que propose l'EA. La stratégie principale de cet Expert advisor (EA) est de placer des trades lorsque 3 moyennes mobiles (MA) sont alignées consécutivement et à une certaine distance l'une de l'autre (elle peut
This multi indicator/oscillator (hereafter indicator), multi time frame and multi symbol indicator identifies when a divergence occurs between price and one, two or three indicators. It identifies both regular/classical (trend reversal) and hidden (trend continuation) divergences. It has RSI and MA trend filter options which makes it possible to filter out only the strongest setups. Combined with your own rules and techniques, this indicator will allow you to create (or enhance) your own powerfu
Cet indicateur à plusieurs périodes et à plusieurs symboles recherche les barres à épingles, les étoiles du matin/soir, les engloutissements, les pinces à épiler, les frappes à trois lignes, les barres intérieures, les fanions et les triangles.   L'indicateur peut également être utilisé en mode graphique unique. Veuillez en savoir plus sur cette option dans le produit   blogue .   Combiné à vos propres règles et techniques, cet indicateur vous permettra de créer (ou d'améliorer) votre propre sys
Cet indicateur de zone d'offre et de demande dessine les zones sur le graphique et envoie des alertes lorsque le prix a atteint ou cassé une zone. Il est également possible de l'utiliser pour être alerté des doubles hauts/bas réguliers au lieu des zones. Il est possible d'utiliser des filtres RSI, de volume et de divergence pour filtrer uniquement les configurations les plus fortes. Combiné avec vos propres règles et techniques, cet indicateur vous permettra de créer (ou d'améliorer) votre propr
I recommend you to read the   product's blog  (manual) from start to end so that it is clear from the beginning what the indicactor offers. This multi time frame and multi symbol supply and demand zone dashboard indicator sends alerts when the price has reached a supply/demand zone. It is also possible to use it to be alerted about regular double tops/bottoms instead of zones. It can be used with all time frames from M1 to MN. It is possible to use RSI, divergence (MACD, OsMA, RSI or Awesome) a
I  recommend you to read the   product's blog  (manual) from start to end so that it is clear from the beginning what the indicator offers. This multi time frame and multi symbol indicator identifies double top/bottom, head & shoulders, pennant/triangle and flag patterns. It is also possible to setup alerts only when a neckline/triangle/flagpole breakout has occured (neckline breakout = confirmed signal for top/bottoms and head & shoulders).  The indicator can also be used in single chart mode.
I  recommend you to read the   product's blog  (manual) from start to end so that it is clear from the beginning what the indicator offers. In addition to finding bullish and bearish Three line strike formations this multi symbol and mutli time frame indicator can also scan for the following candlestick patterns (please see screenshots for explanation of the patterns): Three white soldiers (reversal>continuation pattern) Three black crows (reversal>continuation pattern) The formations do not ap
Averaging down EA
Jan Flodin
5 (1)
This cost averaging Expert advisor (EA) places additional trades in the same direction as the original (manually opened) order when the price goes against you. It can be used as a grid system or as pure martingale system (exponential increasing of lot size) or smoothed martingale (for instance linear increasing of the lot size). Due to the risk involved, this EA is more suitable for intermediate to advanced traders who are well aware of how to handle risk management and trading an already profit
This multi time frame and multi symbol indicator alerts about Heiken Ashi Smoothed color changes. As a bonus it can also scan for Hull Moving Average trend (color) changes. Combined with your own rules and techniques, this indicator will allow you to create (or enhance) your own powerful trading system. Features Can monitor all symbols visible in your Market Watch window at the same time. Apply the indicator to just one chart and instantly monitor the entire market. Can monitor every time frame
This multi time frame and multi symbol indicator identifies high-probability breakout patterns. It does this by identifying strong, symmetrical pennants and triangles. This pattern DOES NOT appear very often on higher time frames. But when it does, it is a very high-probability setup. The indicator also includes an Inside bars scanner. It can for example be used to detect a special type of Inside bars formation which is formed by a Master candle (MC) followed by 4 inside candles (please see the
Filtrer:
rbowen125
72
rbowen125 2023.11.16 03:47 
 

very satisfied with this software exactly what i needed to improve my trading

ZERO9898
1846
ZERO9898 2023.04.05 17:05 
 

L'utilisateur n'a laissé aucun commentaire sur la note

Devonish
2981
Devonish 2019.03.05 13:55 
 

I really like this tool, yes there are similar products out there, I even have some; but what I like about this particular indicator is the option to have it 'stack' the trends in order of strength and also the ability to flip to RSI reversal mode. Nice job :)

Répondre à l'avis
Version 2.6 2023.11.16
*** IMPORTANT - Please always make a backup of the existing indicator (the .ex5 file) before you make the update ***

Change log:
- improved the accuracy when clicking in a box (rectangle) to open a chart
- clicking on the symbol name in the first column will open up a D1 chart
Version 2.5 2023.11.15
*** IMPORTANT - Please always make a backup of the existing indicator (the .ex5 file) before you make the update ***

Change log:
- added a new input parameter for additional symbols
- added the option to set the border color
Version 2.4 2023.04.03
*** IMPORTANT - please always make a backup of the existing indicator (the .ex5 file) before you make an update ***

Change log:
- performance and object visibility improvements
Version 2.3 2022.03.01
*** Please always make a backup of the existing indicator (the .ex5 file) before you make an update ***

- bug fix in the HULL calculation
Version 2.2 2021.09.07
*** Please always make a backup of the existing indicator (the .ex5 file) before you make an update ***

- added an option to scan for Traders dynamic index (TDI)
- corrected a bug where the clicking inside the rectangle in some cases did not open a new chart
Version 2.1 2021.09.05
*** Please always make a backup of the existing indicator (the .ex5 file) before you make an update ***

- added options to scan for Stochastics crossovers, Gann Hi-Lo and Hull moving average
- added a possibilty to set the scan interval in seconds. This to allow to set a higher value for slower computers
Version 2.0 2020.09.05
*** Please always make a backup of the existing indicator (the .ex5 file) before you make an update ***

Not a mandatory update if everything is already working as it should and you are not using Heiken Ashi smoothed or ADX

- minor bug fix
- corrected an error in the point ranking for Heiken Ashi smoothed
- changed the algorithm for the ADR point ranking. The +DI and -DI lines are now used as well in the calculation. Bullish if the main line is above the level value and at the same time the +DI line is above the -DI line. Bearish if the main line is above the level value and at the same time the -DI line is above the +DI line
- added a possibility to enable writing of of global variables when point ranking has been enabled. The global variables can be used by an Expert Advisor for automatical trading.
Version 1.9 2020.08.17
*** Please always make a backup of the existing indicator (the .ex5 file) before you make an update ***

- added the possibility to select from all supported time frames in MT5. Max. 9 time frames can be used in the dashboard.
- added Heiken Ashi smoothed
Version 1.8 2020.07.22
*** Please always make a backup of the existing indicator (the .ex4 file) before you make an update ***

- added an option to change the blue color in the rectangles when there is no signal
- added MACD (signal line). Bullish if above the zero line and vice versa
Version 1.7 2020.01.22
- added support for the H12 time frame
- corrected a bug which prevented the dashboard to load if you had less than 9 symbols in the list
- added the possibility to set the rectangle bull and bear colors
Version 1.6 2019.07.10
- added Awesome (AO)
Version 1.5 2019.04.12
- added Parabolic SAR (PSAR)
Version 1.4 2019.04.11
- added Composite index
Version 1.3 2019.04.06
- added Bollinger bands and ADX
Version 1.2 2019.03.27
- added the possibility to add a custom text to the end of the regular alert text
- added the possbility to be alerted based on a point system instead of the color count system
- added the possibility to be alerted based on xx time frames with same color
- added the possibility to use double MA logic (2 MA:s in consecutive alignment and price above/below them)