• Aperçu
  • Avis (2)
  • Commentaires
  • Nouveautés

OneKey DeleteOrder

I see that many tools in the market deal with Position and Order in the form of operation panels. Which is loaded into a Chart in the form of an EA.

However, once the operator panel EA is loaded, no other EAs can be loaded. So, I wrote the one-click operation of Position and Order as a script, so you can load other EAs and easily complete one-click operation of Trade.

1. What is this:

This is a one-click script to delete the pending order.

Now you can delete pending tickets at high speed, for example 1000 pending tickets can be deleted instantaneously.

2. Function:

There are many ways to filter:
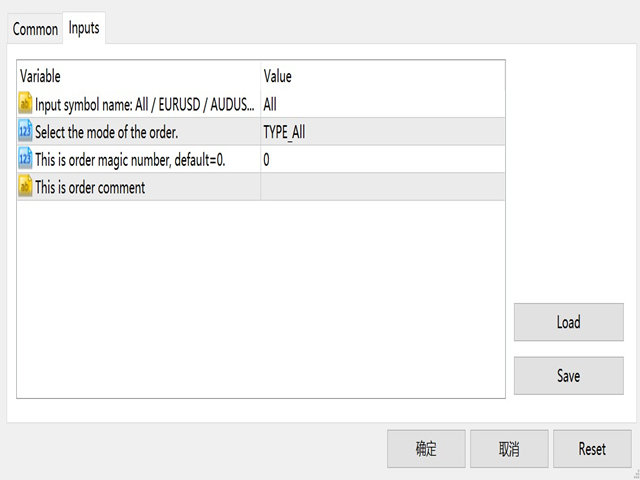
  • You can choose the symbol of the pending order.  Default is All.
  • You can choose the type of pending order, Default is All.
  • You can enter magci number, the default is 0.
  • You can enter comment, the default is "".
3. Parameters:
  • Input string ForexName="All";                            //Input symbol name: All / EURUSD / AUDUSD / ...
  • Input Enum_OrderType Type_Order=TYPE_All;    //Select the mode of the order.
  • Input int MAGICNUM=0;                                     //This is order magic number, default=0.
  • Input string COMMENT="";                                  //This is order comment
  • Input bool HighSpeed=true; //True represents high speed execution
Thanks for using!


Produits recommandés
Manual Assistant MT5
Igor Kotlyarov
4.67 (3)
Bonus when buying an indicator or an advisor from my list. Write to me in private messages to receive a bonus. Manual Assistant MT5 is a professional manual trading tool that will make your trading fast and comfortable. It is equipped with all the necessary functions that will allow you to open, maintain and close orders and positions with one click. It has a simple and intuitive interface and is suitable for both professionals and beginners. The panel allows you to place buy and sell orders
FREE
Bienvenue sur HiperCube Renko Candles Cet indicateur vous fournit une véritable information sur la transformation du marché en Renko Candle Style. Définition Les graphiques Renko sont un type de graphique financier qui mesure et trace les variations de prix, en utilisant des briques (ou des barres) pour représenter les mouvements de prix. Contrairement aux graphiques en chandeliers traditionnels, les graphiques Renko n'affichent pas d'informations temporelles, se concentrant uniquement sur
FREE
Are you tired of drawing trendlines every time you're analyzing charts? Or perhaps you would like more consistency in your technical analysis. Then this is for you. This indicator will draw trend lines automatically when dropped on a chart. How it works Works similar to standard deviation channel found on mt4 and mt5. It has 2 parameters: 1. Starting Bar 2. Number of bars for calculation The   starting bar   is the bar which drawing of the trend lines will begin, while the   number of bars for c
FREE
Renko Builder GLX1
Eranga Thilina Dhanushka Gallage
GLX1 Renko Builder   Expert Advisor (EA) can create the Renko bar charts on any symbol. The Renko charts are generated as real-time custom symbol charts which can be further used for technical analysis with any MT5 compatible indicator.  Find the free   GLX1 Renko Euro   Expert Advisor from here.  https://www.mql5.com/en/market/product/115074 Included Features: Truly responsive Renko Charting on a custom symbol chart Accurate automatic live chart update Ability to attach any MT5 indicator
Renko Chart
Marcin Konieczny
3.63 (8)
This indicator allows to display Renko charts in the indicator window. Renko charts show only price movements that are bigger than the specified box size. It helps to eliminate noise and allows to focus on main trends. Time is not a factor here. Only price movements are taken into account. That's why Renko chart is not synchronized with the main chart it is attached to. Indicator works in two modes: CLOSE - only close prices are taken into account while building the chart HIGH_LOW - only high/
FREE
Renko Plus
Eadvisors Software Inc.
With Renko Plus you can use the features in the Indicator functionality, just add it to the Metatrader5 chart.             The Renko chart is a type of chart, developed by the Japanese, that is constructed using price movement rather than standardized prices and time intervals like most charts. It is believed to be named after the Japanese word for bricks, "renga", as the graphic looks like a series of bricks.             A new brick is created when the price moves a specified p
Prop Firm Navigator EA
Marin Stoyanov
4 (1)
FREE Prop Firm Navigator EA - Advanced Trend-Following & Protection Developed by the EA Trading Academy team using Expert Advisor Studio , this free trading robot combines powerful trend-following indicators with a robust set of account protection features to secure your trading capital. You can find a detailed documentation about the properties and inputs on our  knowledge base . Key Strategy Features: Uses ADX and Bulls Power indicators for precise entry signals Sophisticated exit strateg
FREE
Le Capteur de Tendance : La Stratégie du Capteur de Tendance avec Indicateur d'Alerte est un outil d'analyse technique polyvalent qui aide les traders à identifier les tendances du marché et les points d'entrée et de sortie potentiels. Elle présente une stratégie dynamique de Capteur de Tendance, s'adaptant aux conditions du marché pour une représentation visuelle claire de la direction de la tendance. Les traders peuvent personnaliser les paramètres selon leurs préférences et leur tolérance
FREE
Introducing   Order Blocks Breaker , a brand-new way to identify and leverage order blocks in your trading strategy. After developing multiple order block tools with unique concepts, I’m proud to present this tool that takes things to the next level. Unlike previous tools,   Order Blocks Breaker   not only identifies order blocks but also highlights   Breaker Order Blocks —key areas where the price is likely to retest after a breakout. MT4 -  https://www.mql5.com/en/market/product/124101/ This t
Order Book, known also as Market Book, market depth, Level 2, - is a dynamically updated table with current volumes of orders to buy and to sell specific financial instument at price levels near Bid and Ask. MetaTrader 5 provides the means for receiving market book from your broker, but in real time only, without access to its history. The indicator OrderBook Cumulative Indicator accumulates market book data online and visualizes them on the chart. In addition, the indicator can show the market
Account Info EA It is a tool that presents on the graph all the positions of the account, and specific information concerning the positions, but also the account. It enables the user to have an image of his account at a glance. Use like any expert advisor. You can't attach it in the same chart with other expert advisor. It does not have the ability to open or manage positions. You can attach it on any chart and any timeframe.
FREE
VR Color Levels est un outil pratique pour ceux qui appliquent l'analyse technique à l'aide d'éléments tels que la ligne de tendance, le rectangle et le texte. Il est possible d'ajouter du texte directement au graphique et de prendre des captures d'écran. Les paramètres, les fichiers de configuration, les versions de démonstration, les instructions, la résolution de problèmes peuvent être obtenus auprès de [Blog] Vous pouvez lire ou écrire des critiques sur [lien] Version pour [MetaTrader 4]
FREE
Basic Theme Builder MT5
Mehran Sepah Mansoor
5 (1)
Basic Theme Builder : Simplifiez la personnalisation de vos graphiques Transformez votre expérience de trading avec l'indicateur Basic Theme Builder , un outil polyvalent conçu pour simplifier la personnalisation de l'apparence de vos graphiques sur MetaTrader 5. Cet indicateur intuitif offre un panneau facile à utiliser qui vous permet de passer d'un thème à l'autre et de changer les schémas de couleurs en toute simplicité, améliorant ainsi l'apparence visuelle et la fonctionnalité de votre en
FREE
Gino Renko
Stephane, Andr Valette
1 (1)
Encore un indicateur basé sur le renko. Il retourne différentes valeurs utilisables pour un EA, et est directement affiché sur le graphique principale. Son réglage est très simple: La taille du renko Le nombre de barres prises en compte La couleur à la baisse La couleur à la hausse Les valeurs retournées: Buffer 0 : Valeur du millieu Buffer 1 : Valeur haute Buffer 2 : Value basse Buffer 3 : Direction du renko (0.0 pour la hausse; 1.0 for la baisse) Buffer 4 : Ratio du renko, par exemple,
Important Lines
Terence Gronowski
4.86 (21)
This indicator displays Pivot-Lines, preday high and low, preday close and the minimum and maximum of the previous hour. You just have to put this single indicator to the chart to have all these important lines, no need to setup many single indicators. Why certain lines are important Preday high and low : These are watched by traders who trade in a daily chart. Very often, if price climbs over or falls under a preday low/high there is an acceleration in buying/selling. It is a breakout out of
FREE
This indicator will mirror the assets in use in another metatrader, being able to choose the timeframe and a template. This is the Metatrader 5 Client, it needs the Metatrader 4 or 5 Server versions: Metatrader 4 Mirror Chart Server:   https://www.mql5.com/en/market/product/88644 Metatrader 5 Mirror Chart Server: https://www.mql5.com/en/market/product/88652 Details of how it works in the video.
FREE
Highly configurable Adx indicator. Features: Highly customizable alert functions (at levels, crosses, direction changes via email, push, sound, popup) Multi timeframe ability Color customization (at levels, crosses, direction changes) Linear interpolation and histogram mode options Works on strategy tester in multi timeframe mode (at weekend without ticks also) Adjustable Levels Parameters: ADX   Timeframe:  You can set the lower/higher timeframes for Adx. ADX   Bar Shift:   you can set the
FREE
I see that many tools in the market deal with Position and Order in the form of operation panels. Which is loaded into a Chart in the form of an EA. However, once the operator panel EA is loaded, no other EAs can be loaded. So, I wrote the one-click operation of Position and Order as a script, so you can load other EAs and easily complete one-click operation of Trade. 1. What is this: This is a one-click script to close position order. Now you can close position tickets at high speed, for examp
Market Profile 3 ForexArby com
Hussien Abdeltwab Hussien Ryad
3.83 (12)
Market Profile 3 MetaTrader 5 indicator  version 4.70— is a classic Market Profile implementation that can show the price density over time, outlining the most important price levels, value area, and control value of a given trading session. This indicator can be attached to timeframes between M1 and D1 and will show the Market Profile for daily, weekly, monthly, or even intraday sessions. Lower timeframes offer higher precision. Higher timeframes are recommended for better visibility. It is als
FREE
Gm Volumes
Antonio Augusto Barreto De Melo
4 (3)
A simple volume indicator according to the color of the candle! - Custom background! - Supports Volume by Ticks or Real Volume. The original Metatrader Volume indicator does not show the colors of the bar according to the color of the Candle, it only changes color when the volume of a candle is greater than the previous one, this sometimes creates confusion for beginners and does not know the real reason for the color change. Free indicator, support may take a while to respond!
FREE
ChartPan
Leandro Rodrigo Giron
Hey Trader! Boring with the Meta chart? Do you want to move it as you do in Profit? Your problems are over! Now available   Chart Panoramic   or   ChartPan   for closer friends, a utility that allows you to move the chart to better visualize the most relevant points for your trade. Recommend you to add a keyboard shortcut for quick access (Ctrl + Q - for example), because you will need to run   ChartPan   after symbol changing to "release" the chart again. To add a hotkey: after downloa
FREE
Data Extractor (DE) is designed to extract symbol price movement data and save it to file. It's a simple tool, designed to be used in combination with other software. SETTINGS (INPUTS) Period_in_days - How many days of data for Data Extractor to process (including non-work days).  File extension - Defines the type of file in which data will be saved. CSV is readable for a human, HST and BIN are binary data intended for machine reading. File name (without extension) - User defined part of file
FREE
The   Close script   is a simple tool that allows traders to close their trades by three methods. Just run the script and choose the close method. Closing methods Symbol  - Allows closing all open trades for a specific symbol. All_Trades  - Allows closing all open trades. Magic_Number  - Allows closing all open trades according to their magic number. Recommendation AutoTrading functions must be activated.  If the AutoTrading function is disabled, the script will not work. EA should be stopped
FREE
Size Bars
Viktor Loginov
Size Bars – индикатор отображает на графике максимальный, минимальный, текущий и средний размер баров (свечей) за выбранный период. Отображаемые параметры индикатора Size Bars: 1)       Текущий размер бара в писах (по максимум/минимум, тело бара). 2)       Максимальный, минимальный и средний размер свечей BUY . 3)       Максимальный, минимальный, средний размер свечей SELL . 4)       Количество свечей BUY и количество свечей SELL . 5)       Среднее количество свечей подряд BUY и SELL . 6)    
BoletaMiniPanel
PATRICK ANTONIO MORELO A.
5 (4)
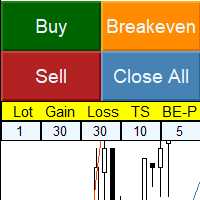
Simple panel with  Stop loss (Loss), Stop gain (Gain) , Trailing stop (TS) and Breakeven (BE-P). Lot is the number of contracts to be traded. Gain is the number, in points, that the stop gain will be positioned. If you don't want to put stop gain, just put 0 (zero) in place and when you open the order it won't have this stop. Loss is the number, in points, that the stop loss will be placed. If you don't want to put stop loss, just put 0 (zero) in place and when you open the order it won't
FREE
FX Info Spread MT5
Pedro Fernandez
3 (1)
Minimalist and fully customizable info panel. It works on any chart and timeframe, with 2 - 4 digits brokers and with 3 - 5 digits ones. It can show: Current Spread in pips (1 decimal digit if you are on a 3 - 5 digits broker) ATR (Average True Range) in pips Current Server Time Current GMT Time Important Account Info: Current Leverage and Stop-out Level (%) Time left for the current bar. Very useful on 4 h charts All info labels have a tooltip with the same data Available customizations : En
FREE
The Rayol Code Hour Interval Lines indicator was  designed to assist your trading experience.  It  draws the range of hours chosen by the user directly on the chart, so that it enables traders to visualize price movements during their preferred trading hours, providing  traders a more comprehensive view of price movements and market dynamics. This indicator allows the user to choose not only the Broker's time, but also the Local time. This way, the user no longer needs to calculate local time in
FREE
RenkoChart EA
Paulo Henrique Da Silva
4.33 (3)
The RenkoChart tool presents an innovative and highly flexible approach to visualizing market data in MetaTrader 5. This expert creates a custom symbol with Renko bricks directly on the chart, displaying accurate prices at the respective opening date/time for each brick. This feature makes it possible to apply any indicator to the Renko chart. Furthermore, this tool also allows access to historical brick data through native methods in the MQL5 programming language, such as iOpen, iHigh, iLow and
FREE
Follow The Line MT5
Oliver Gideon Amofa Appiah
4.52 (29)
This indicator obeys the popular maxim that: "THE TREND IS YOUR FRIEND" It paints a GREEN line for BUY and also paints a RED line for SELL. (you can change the colors). It gives alarms and alerts of all kinds. IT DOES NOT REPAINT and can be used for all currency pairs and timeframes. Yes, as easy and simple as that. Even a newbie can use it to make great and reliable trades. NB: For best results, get my other premium indicators for more powerful and reliable signals. Get them here: https://www.m
FREE
LT Rainbow Trend
Thiago Duarte
5 (1)
Do you, like me, like to trade with the trend? Then this indicator will help you! Rainbow Trend is a trend indicator, which uses several Moving Averages on the chart. It measures different trend strenght zones for different periods: very long term, long term, mid term, short term and very short term. Each zone has its color, and it is possible to have sound alert when the prices leaves a zone and enters another. Its configuration is very simple. If you find any bug or have any suggestions, co
Les acheteurs de ce produit ont également acheté
Trade Assistant MT5
Evgeniy Kravchenko
4.37 (166)
It helps to calculate the risk per trade, the easy installation of a new order, order management with partial closing functions, trailing stop of 7 types and other useful functions. Attention, the application does not work in the strategy tester. Manual, Description, Download demo Line function -   shows on the chart the Opening line, Stop Loss, Take Profit. With this function it is easy to set a new order and see its additional characteristics before opening.   Risk management  - The risk
Bienvenue sur Trade Manager EA, l’outil ultime de gestion des risques conçu pour rendre le trading plus intuitif, précis et efficace. Ce n’est pas seulement un outil d’exécution d’ordres ; c’est une solution complète pour la planification des trades, la gestion des positions et le contrôle des risques. Que vous soyez débutant, trader expérimenté ou scalpeur ayant besoin d’une exécution rapide, Trade Manager EA s’adapte à vos besoins, offrant une flexibilité sur tous les marchés, des devises et i
Local Trade Copier EA MT5
Juvenille Emperor Limited
4.99 (71)
Découvrez une expérience exceptionnellement rapide de copie de trades avec le   Local Trade Copier EA MT5 . Avec sa configuration facile en 1 minute, ce copieur de trades vous permet de copier des trades entre plusieurs terminaux MetaTrader sur le même ordinateur Windows ou Windows VPS avec des vitesses de copie ultra-rapides de moins de 0.5 seconde. Que vous soyez un trader débutant ou professionnel, le   Local Trade Copier EA MT5   offre une large gamme d'options pour le personnaliser en fonc
TradePanel MT5
Alfiya Fazylova
4.84 (117)
Trade Panel est un assistant commercial multifonctionnel. L'application contient plus de 50 fonctions de trading manuel et vous permet d'automatiser la plupart des actions de trading. Avant d'acheter, vous pouvez tester la version Démo sur un compte démo. Démo ici . Instructions complètes ici . Commerce . Vous permet d'effectuer des opérations de trading de base en un clic : Ouvrir les ordres et positions en attente. Ouverture d'une grille d'ordres. Clôturez les ordres et les positions en attent
The product will copy all telegram signal to MT5 ( which you are member) , also it can work as remote copier.  Easy to set up, copy order instant, can work with almost signal formats, image signal,  s upport to translate other language to English Work with all type of channel or group, even channel have "Restrict Saving Content", work with  multi channel, multi MT5 Work as remote copier: with signal have ticket number, it will copy exactly via ticket number. Support to backtest signal. How to s
Telegram To MT5 Receiver
Levi Dane Benjamin
4.86 (7)
Copiez les signaux de n'importe quel canal dont vous êtes membre (y compris les canaux privés et restreints) directement sur votre MT5.  Cet outil a été conçu en pensant à l'utilisateur et offre de nombreuses fonctionnalités nécessaires pour gérer et surveiller les trades. Ce produit est présenté dans une interface graphique conviviale et attrayante. Personnalisez vos paramètres et commencez à utiliser le produit en quelques minutes ! Guide de l'utilisateur + Démo  | Version MT4 | Version Dis
Trade Dashboard MT5
Fatemeh Ameri
4.96 (52)
Tired of complex order placement and manual calculations? Trade Dashboard is your solution. With its user-friendly interface, placing orders becomes effortless, by a single click, you can open trades, set stop loss and take profit levels, manage trade lot size, and calculate risk to reward ratios, allowing you to only focus on your strategy. Say goodbye to manual calculations and streamline your trading experience with Trade Dashboard. Download  Demo Version  right now. You can find  Details of
Exp COPYLOT CLIENT for MT5
Vladislav Andruschenko
4.08 (24)
Le copieur commercial pour MT5 est un copieur commercial pour la plate-forme МetaТrader 5   . Il copie les transactions de change   entre       tous les comptes   MT5   -   MT5, MT4   -   MT5 pour la version COPYLOT MT5 (ou MT4   -   MT4 MT5   -   MT4 pour la version COPYLOT MT4) Copieur fiable ! Version MT4 Description complète   +DEMO +PDF Comment acheter Comment installer     Comment obtenir des fichiers journaux     Comment tester et optimiser     Tous les produits de Expforex Vous po
Trade Manager DaneTrades
Levi Dane Benjamin
4.73 (22)
Trade Manager pour vous aider à entrer et sortir rapidement des transactions tout en calculant automatiquement votre risque. Y compris des fonctionnalités pour vous aider à éviter le sur-trading, le trading de vengeance et le trading émotionnel. Les transactions peuvent être gérées automatiquement et les mesures de performances du compte peuvent être visualisées dans un graphique. Ces fonctionnalités rendent ce panneau idéal pour tous les traders manuels et contribuent à améliorer la plateforme
Custom Alerts MT5
Daniel Stein
5 (2)
Custom Alerts est un outil polyvalent de surveillance multi-marchés qui identifie les configurations prometteuses sur les huit principales devises (USD, CAD, GBP, EUR, CHF, JPY, AUD et NZD), ainsi que sur le GOLD (XAU), les 28 paires Forex et GOLD basées sur ces devises, et jusqu'à sept indices tels que US30, UK100, WTI, Bitcoin, etc. Il est entièrement personnalisable. L'outil rassemble les données de nos indicateurs FX Power, FX Volume et IX Power et vous informe des événements importants.  
$450 (-20%) instead of $565 until 11/29 B e sure to watch this video before using A community for users, product discussion, update news, and first line of support  Use Webmoney For payments in cryptocurrencies. How I use this algo tool   Lazy Trader is NOT SUITABLE FOR SCALPING EVERY MINUTE MOVEMENT, ESPECIALLY IN CRYPTO. WITHOUT UNDERSTANDING WHAT IS HAPPENING ON THE CHART, THERE IS NO POINT IN BLINDLY HOPING FOR PROFITS! Lazy Trader does NOT USE openAI chat-gpt-4 technologies, which are ad
MT5 to Telegram Signal Provider est un utilitaire facile à utiliser et entièrement personnalisable qui permet l'envoi de signaux spécifiés vers un chat, un canal ou un groupe Telegram, transformant ainsi votre compte en fournisseur de signaux. Contrairement à la plupart des produits concurrents, il n'utilise pas d'importations DLL. [ Démonstration ] [ Manuel ] [ Version MT4 ] [ Version Discord ] [ Canal Telegram ] Configuration Un guide utilisateur étape par étape est disponible. Aucune connai
YuClusters
Yury Kulikov
4.93 (42)
Attention: You can view the program operation in the free version  YuClusters DEMO .  YuClusters is a professional market analysis system. The trader has unique opportunities to analyze the flow of orders, trade volumes, price movements using various charts, profiles, indicators, and graphical objects. YuClusters operates on data based on Time&Sales or ticks information, depending on what is available in the quotes of a financial instrument. YuClusters allows you to build graphs by combining da
News Filter Tool
Apex Software Ltd
5 (1)
Améliorez votre trading avec des informations sur les événements d'actualité Dans le monde rapide du trading, les événements d'actualité peuvent avoir un impact significatif sur les prix du marché. Comprendre comment ces événements influencent les mouvements des prix est crucial pour gérer vos transactions pendant les périodes volatiles. L'outil News Tool EA est conçu pour fournir des informations sur les événements d'actualité historiques et à venir, vous aidant ainsi à prendre des décisions
Mentfx Mmanage mt5
Anton Jere Calmes
4.25 (8)
The added video will showcase all functionality, effectiveness, and uses of the trade manager. Drag and Drop Trade Manager. Draw your entry and have the tool calculate the rest. Advanced targeting and close portions of a trade directly available in tool (manage trades while you sleep). Market order or limit order on either side with factored spread. Just draw the entry, the tool does the rest. Hotkey setup to make it simple. Draw where you want to enter, and the stop loss, the tool calculates al
Trade Assistant 38 in 1
Makarii Gubaydullin
4.89 (18)
Outil multifonctionnel : plus de 65 fonctions, dont : calcul de lot, price action, facteur R/R, gestionnaire des trades, zones d'offre et de demande Version de démonstration   |   Manuel de l'Utilisateur   |    MT4 L'utilitaire ne fonctionne pas dans le testeur de stratégie : vous pouvez télécharger la version de démonstration ICI pour tester le produit. Contactez-moi   pour toutes questions / idées d'amélioration / en cas de bug trouvé Simplifiez, accélérez et automatisez votre processus de tr
The  Easy Strategy Builder (ESB)  is a " Do It Yourself " solution that allows you to create a wide range of the automated trading strategies without any line of codes. This is the world’s easiest method to automate your strategies that can be used in STP, ECN and FIFO brokers. No drag and drop is needed. Just by set conditions of your trading strategy and change settings on desired values and let it work in your account. ESB has hundreds of modules to define unlimited possibilities of strategi
Auto Trade Copier is designed to copy trades to multiple MT4, MT5 and cTrader accounts/terminals with 100% accuracy. The provider and receiver accounts must be on the same PC/VPS. With this tool, you can copy trades to receiver accounts on the same PC/VPS. All trading actions will be copied from provider to receiver perfectly. This version can be used on MT5 accounts only. For MT4 accounts, you must use Auto Trade Copier (for MT4). Reference: - For MT4 receiver, please download Trade Receiver Fr
Bots Builder Pro MT5
Andrey Barinov
4 (5)
This is exactly what the name says. Visual strategy builder . One of a kind. Turn your trading strategies and ideas into Expert Advisors without writing single line of code. Generate mql source code files with a few clicks and get your fully functional Expert Advisors, which are ready for live execution, strategy tester and cloud optimization. There are very few options for those who have no programming skills and can not create their trading solutions in the MQL language. Now, with Bots Build
Risk Manager for MT5
Sergey Batudayev
4.5 (14)
Expert Advisor Risk Manager pour MT5 est un programme très important et, à mon avis, nécessaire pour chaque commerçant. Avec cet Expert Advisor, vous pourrez contrôler le risque de votre compte de trading. Le contrôle des risques et des bénéfices peut être effectué à la fois en termes monétaires et en termes de pourcentage. Pour que l'Expert Advisor fonctionne, attachez-le simplement au tableau des paires de devises et définissez les valeurs de risque acceptables dans la devise du dépôt ou
Trade copier MT5
Alfiya Fazylova
4.48 (27)
Trade Copier est un utilitaire professionnel conçu pour copier et synchroniser les commandesentre les comptes de trading. Les commandes sont copiées du compte/terminal du fournisseur vers le compte/terminal du destinataire, qui sont installés sur le même ordinateur ou vps. Avant d'acheter, vous pouvez tester la version démo sur un compte démo. Version démo ici . Instructions complètes ici . Principales fonctionnalités et avantages: Prend en charge la copie des commandes MT5> MT5, MT4> MT5, MT5>
-25% discount ($149 -> $111) Everything for chart Technical Analysis indicator mt5 in one tool Draw your supply demand zone with rectangle and support resistance with trendline and get alerts to mobile phone or email alert -  Risk reward indicator mt5 Video tutorials, manuals, DEMO download   here .   Find contacts on my   profile . 1.   Extended rectangles and trendlines Object will be extended to the right edge of the chart when price will draw new candles on chart. This is rectangle extend
Cerberus Equity Watcher
Samuel Bandi Roccatello
5 (2)
Cerberus the Equity Watcher est un outil de gestion des risques qui surveille en permanence la valeur de votre compte et empêche les pertes importantes, qu'elles soient causées par des EA défectueux ou des émotions si vous êtes un trader discrétionnaire. Il est extrêmement utile pour les traders systématiques qui s'appuient sur des EA susceptibles de contenir des bogues ou de ne pas fonctionner correctement dans des conditions de marché inattendues. Cerberus vous permet de définir une valeur min
HYT utility
Sergey Batudayev
5 (1)
HYT (Help Your Trading) is a tool designed to help you average down your losing positions using two main techniques: Standard averaging . Hedging with subsequent opening of positions in the direction of the trend . Buy 1 and 1 get FREE This tool allows you to manage multiple positions opened in different directions, both for buying and selling. HYT automatically calculates the size of the next position , order price, direction for averaging, and closing the position with a specified take-profit
Ultimate Trailing Stop EA MT5
BLAKE STEVEN RODGER
4.5 (6)
This EA Utility allows you to manage (with advanced filtering) unlimited open orders (manual or EA) with 16 trailing stop methods: fixed, percent, ATR Exit, Chandelier Exit, Moving Average, Candle High Low Exit, Bollinger Bands, Parabolic, Envelope, Fractal, Ichimoku Kijun-Sen, Alligator, Exit After X Minutes or Bars, RSI and Stochastic. The trailing stop can be either real or virtual, and you can exit fully or with a partial close percent on touch or bar close.  Moreover, you can add (overri
Le MT5 to Discord Signal Provider est un outil convivial et entièrement personnalisable conçu pour envoyer directement des signaux de trading à Discord. Cet outil transforme votre compte de trading en un fournisseur de signaux efficace. Personnalisez les formats de messages pour qu'ils correspondent à votre style ! Pour plus de facilité, choisissez parmi des modèles pré-conçus et décidez quels éléments du message inclure ou exclure. [ Démo ] [ Manuel ] [ Version MT4 ] [ Version Telegram ] Conf
-25% discount ($199 -> $149) Advanced trading tool: One click smart orders that execute under your conditions Developed by trader for trading community:  position size calculator (lot size), open position after price action, strategy builder, set and forget trading, mobile notifications... Risk Management -  Risk percentage position size calculator, gain percentage, target risk reward ratio, spread and commissions are included in calculations 7 Advanced order types  - Set and forget trading w
Panneau de trading pour trader en 1 clic.   Travailler avec des positions et des commandes!   Trading à partir du graphique ou du clavier. Avec notre panneau de trading, vous pouvez exécuter des transactions en un seul clic directement depuis le graphique et effectuer des opérations de trading 30 fois plus rapidement qu'avec le contrôle MetaTrader standard. Les calculs automatiques des paramètres et des fonctions rendent le trading plus rapide et plus pratique pour les traders. Des conseils grap
DrawDown Limiter
Haidar, Lionel Haj Ali
5 (18)
Expert Advisor "Drawdown Limiter"  Vous êtes au bon endroit si vous recherchez un contrôle de drawdown, un limiteur de drawdown, une protection du solde, une protection de l'équité ou une limite quotidienne de drawdown en rapport avec les entreprises de gestion de capitaux (Prop Firm), FTMO, My Forex Fund, ou si vous souhaitez protéger votre compte de trading. Avez-vous déjà eu du mal à contrôler votre drawdown en tradant sur des comptes financés ? Cet EA est fait pour vous. Les entreprises d
Grid Manual MT5
Alfiya Fazylova
4.88 (16)
Grid Manual est un panneau de trading permettant de travailler avec une grille d'ordres. L'utilitaire est universel, possède des paramètres flexibles et une interface intuitive. Il fonctionne avec une grille d'ordres non seulement dans le sens des pertes, mais aussi dans le sens de l'augmentation des profits. Le commerçant n'a pas besoin de créer et de maintenir une grille d'ordres, l'utilitaire le fera. Il suffit d'ouvrir une commande et "Grid Manual" créera automatiquement une grille de comman
Plus de l'auteur
This product can be used to synchronize multiple Charts, and each Chart can be set to a different sync mode. With this product you can better view and manipulate charts: different time frames for a single Symbol, the same time frame for multiple Symbols... and more. PS: The link below is the FreeDemo product, you can use it on EURUSD/XUAUSD/USDCNH symbol: https://www.mql5.com/en/market/product/38557 Feature: Chart settings  can be synchronized, including : background, indentation, size, etc.
Do you think it's a bit cumbersome when you need to switch symbols or timeframes with mouse click? 1. What is this? This is a program that can switch symbols and timeframes with direction keys. Fast switching, very convenient, no mouse click required. For traders, one symbol with multi-timeframe charts are usually added,  you can change symbol on those charts easily. For multi-currency traders, different symbol charts are usually added, you can also change those timeframes easily. I wrote this p
1. What is this         Rising volatility and falling volatility are not the same, whether it is academic research or actual testing has shown this point.         The original ATR indicator is calculated by putting up and down fluctuations together. This indicator is to calculate separately the upward volatility and the downward volatility, which can better help you study the market. 2. Indicator description          There are two modes for the calculation of this indicator, as shown in the f
Have you ever take a long time to watch a Symbol when the network link is not good ? Have you ever wait for a long time when you switch chart between different Symbols or different TimeFrames ? If you do long-term backtesting , Have you ever to be downloaded datas for a long time ? Yes, If there is no data in the system, those will happen.  1. What is this: Download all the Symbol data in Market Watch to the system. PS: This is not outputting data to Files. This Link go to Demo version: https:
This product can be used to synchronize multiple Charts, and each Chart can be set to a different sync mode. With this product you can better view and manipulate charts: different time frames for a single Symbol, the same time frame for multiple Symbols, system indicators for single/multiple Symbols... and more. Feature: Chart settings can be synchronized, including : background, indentation, size, etc. Multiple Chart window start times  or end times can be synchronized. Multiple Chart time f
I see that many tools in the market deal with Position and Order in the form of operation panels. Which is loaded into a Chart in the form of an EA. However, once the operator panel EA is loaded, no other EAs can be loaded. So, I wrote the one-click operation of Position and Order as a script, so you can load other EAs and easily complete one-click operation of Trade. 1. What is this: This is a one-click script to close position order. Now you can close position tickets at high speed, for examp
Do you think it's a bit cumbersome when you need to switch symbols or timeframes with mouse click? 1. What is this? This is a program that can switch symbols and timeframes with direction keys. Fast switching, very convenient, no mouse click required. For traders, one symbol with multi-timeframe charts are usually added,  you can change symbol on those charts  easily . For multi-currency traders, different symbol charts are usually added, you can also change those timeframes easily. I wrote thi
According to trading experience: Some symbols are easy to reverse on certain days, such as Monday, or afternoon, and so on. So comparing the current price with the corresponding historical moment price is valuable. If the price coordinate system uses a logarithmic price, you will get a lot of valuable information. 1. What is this? This program can convert the symbol price and add it to your Chart. You can compare it with your major chart. The DEMO version Link: https://www.mql5.com/en/market/p
What is this: Violent trading: means sending a large number of orders to your brokerage server,  it can conduct a stress test of the trading. In this program you can run a variety of trading tests.  Now you can trade at high speed, For example 1000 orders in an instant. The Demo version's link:  https://www.mql5.com/en/market/product/38431/ Why to use: Whether manual trading or EA trading,  the status of the broker server is very important. So it is beneficial to conduct a trading stress test on
1. Why did I develop this series of indicators I found that most traders need to use multiple time frame indicators. They usually switch time frame to see indicators. However, once the timeframe is switched, you cannot see the  corresponding relationship  between  the price in the smaller timeframe  and  the indicator in the larger timeframe . For example: if your price chart is in H1 timeframe, you can see H4, D1 and W1 indicators in H1 timeframe Chart. This is more helpful for you to find t
Filtrer:
[Supprimé] 2019.02.14 14:59 
 

L'utilisateur n'a laissé aucun commentaire sur la note

[Supprimé] 2019.02.14 14:08 
 

L'utilisateur n'a laissé aucun commentaire sur la note

Répondre à l'avis
Version 1.11 2021.10.23
magic number: default 0 means all.
comment: default "" means all.
Version 1.10 2020.12.01
Now you can delete pending tickets at high speed, for example 1000 pending tickets can be deleted instantaneously.

Version 1.7 2020.06.06
recompiled for MT5 update.
Version 1.6 2019.05.07
Add to print the total time of deleting all pending orders.
Version 1.2 2019.02.14
1.01 Fix some bug.

1.02 Add alert when you have the wrong operation.