GJPivot support and resistance
- Indicateurs
- David Jumbo
- Version: 1.0
PLEASE HELP REVIEW/ SUPPORT/ SHARE THIS OTHER INDICATOR HERE https://www.mql5.com/en/market/product/51637 AS YOU DOWNLOAD THIS ONE FOR FREE. THANKS.
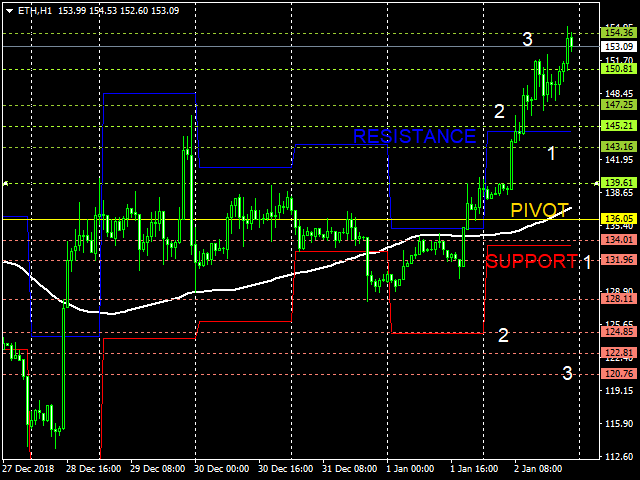
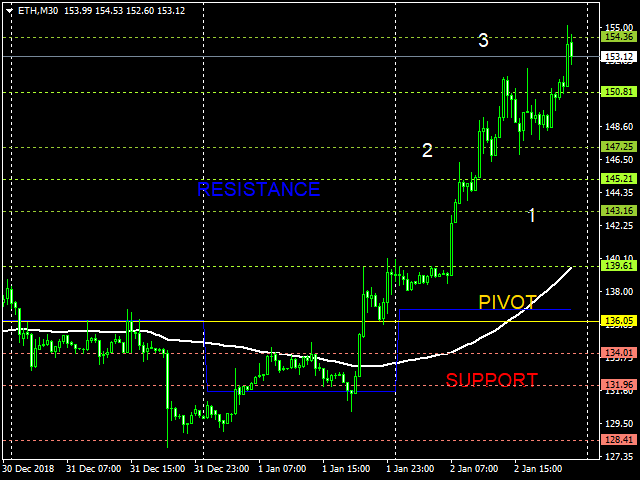
A. This pivot indicator shows the days Pivot Price. Yellow line is pivot point. Blue line is resistance and red line is support.
B. It also shows Resistance R0.5, R1, R1.5, R2, R2.5, and R3
C.It also shows support S0.5, S1, S1.5, S2, S2.5, and S3
INPUT:
Under input you will see 3 Variables
1.ExtFomula. Here you can set your preferred exit at a resistance or support on the chart window at not more than 1 or 2 or 3 value. 1 represents exit at resistance or support 1. 2 represents exit at resistance or support 2. 3 represents exit at resistance or support 3.
2. ExtHowmanyDays. The default is for 30 days. If either 1 or 2 or 3 is entered in ExtFomula, the exit support and resistance price for thirty past days will show on the chart window
3.ExtDraw. Select true to allow support and resistance to be drawn on the chart window, or vice visa.
ADVANTAGES
1. The indicator allows you to see up to support 3 or resistance 3
2. The indicator allows you to set an exit point on the chart at any of the selected resistance or support.
3. The set exit of either the support or resistance can serve as take profit and/or stop loss depending on the prevailing trend.
4. By setting the Exitfomula to 1 or 2 or 3, the indicator will give a clear idea of the extent of up or down move that price could make daily.










Excellent and easy to use. I replaced the other pivot indicator that I use with GJPIVOT. Thanks.