Easy ATR Trailing Stoploss Helper
- Indicateurs
- Kim Thanh Nguyen
- Version: 1.31
- Mise à jour: 9 mars 2024
Update: For those who want to manually backtest this indicator, check this tool https://www.mql5.com/en/market/product/59248
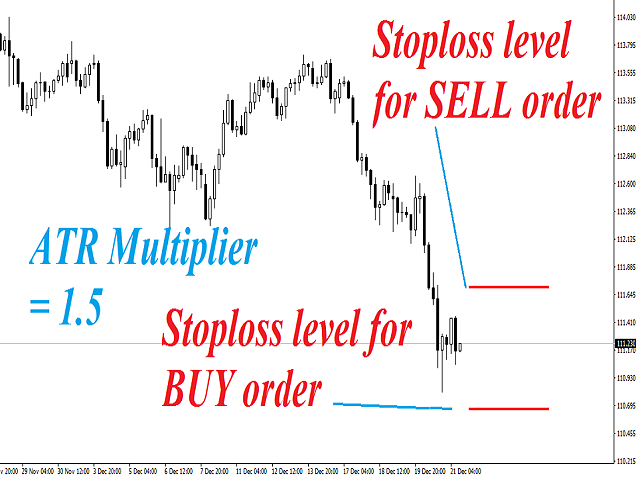
The indicator will help make your calculation of stop loss easier as it will be visually aiding you in choosing where to put your stoploss level on the chart by calculating the current value of ATR indicator.
For those who are unfamiliar with ATR, it is a useful indicator to calculate stoploss for trend following strategy. If volatility is high, ATR stoploss level will be wider to ensure that your stoploss is reasonably wide enough to stay with the trend; and when volatility is low, ATR stoploss level will be contracted narrower to ensure that you won't be caught in a sudden trend reversal or big pullback.
Note: This indicator will not modify your trade order, it only helps you visually by drawing a line! So please remember to manually modify your order.
Parameter:
- DRAW_ATR_TRAILING_STOP_LEVEL_TIMEFRAME = PERIOD_H4; //timeframe to calculate the value of ATR
- DRAW_ATR_TRAILING_STOP_LEVEL_PERIOD = 10; //period of the ATR
- DRAW_ATR_TRAILING_STOP_LEVEL_MULTIPLIER = 1.5; //a higer value means a bigger stop loss for those who want to ride bigger trend
- DRAW_ATR_TRAILING_STOP_LEVEL_COLOR = clrRed; //color of the ATR level when drawn on chart
- DRAW_ATR_TRAILING_STOP_LEVEL_THICKNESS = 10; //if the ATR level line is too small, you may adjust (value is different for different broker and symbols)


Very accurate