Market Dashboard
- Indicateurs
- Christian Opperskalski
- Version: 3.4
- Mise à jour: 27 janvier 2023
- Activations: 5
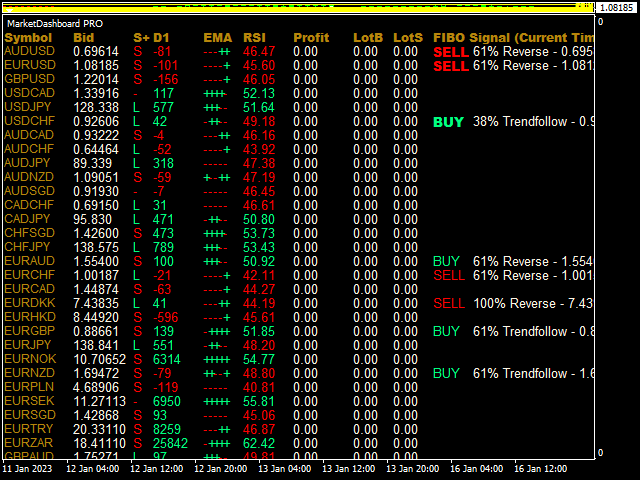
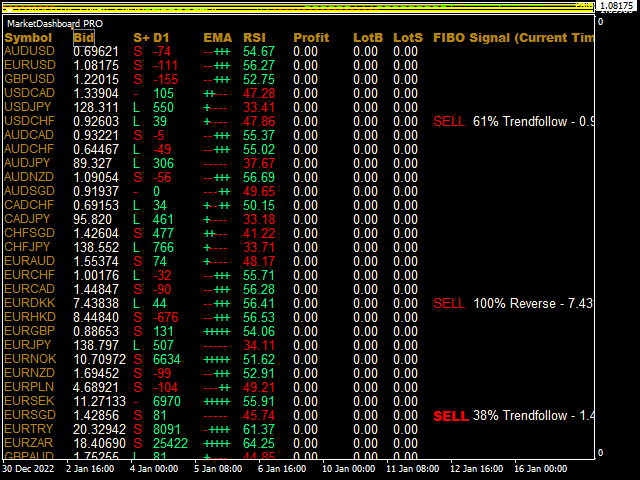
Market Dashboard Indicator gives you advanced information’s about your selected Symbols in MarketWatch
- Daily Price Movements (M1 – D1)
- RSI Values with Highlight Function for your current Timeframe & H1 & H4
- Profit per Symbol and traded lots (buy & sell)
- EMA 5 – 100 based on selected period
- Swap Information (which direction is positive)
- FIBO Info & Tracking (highlighted FIBO Levels close to current price – based on selected period)
- One Click ChartOpen
Important:
Setup & Support:
For further questions join our support group: https://www.mql5.com/en/messages/01F85845B013D901
Get informed about new Products, join our MQL Channel: https://www.mql5.com/en/channels/etradro
Input Parameters
- RSI Period
- RSI highlimit – RSI high value for highlighting
- RSI lowlimit – RSI low value for highlighting
- FIBO look back Period – number of Bars for FIBO calculation
- FIBO tracking Distance Points – number of FIBO Distance Points for FIBO Information
- Text Color
- Max Symbols shown
- Style: vertical shift
- Style: font size

