• Aperçu
  • Avis
  • Commentaires (8)
  • Nouveautés

Kisselyovs Stochastic

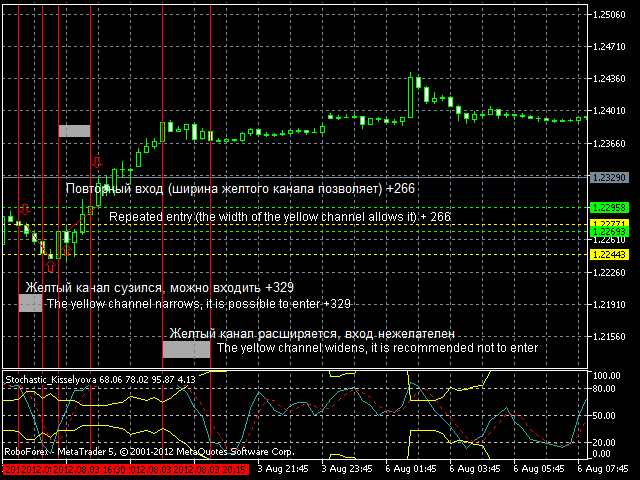
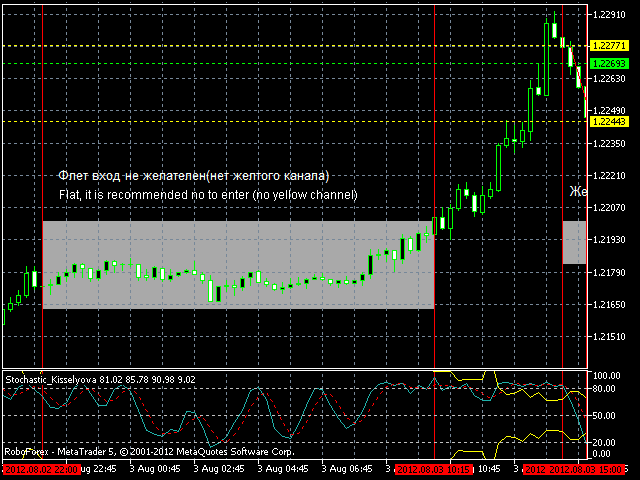
This version of Stochastic evaluates the probability of taking the specified profit in points. The appropriate value is set in the parameters, and the product automatically shows possible options for the market it is currently applied to. There are much more options and the information is more extensive compared to conventional Stochastic (see the screenshots).

Signals:

  1. The yellow channel is absent (flat movement, market entry is not recommended).
  2. The yellow channel is narrowing (trend is forming).
  3. The yellow channel is widening (the market is slowing down, volatility is dropping).

You can enter the market at several conditions, for example:

  1. The yellow channel is narrowing, the main line is crossing the channel to the outside (the market volatility is growing).
  2. The yellow channel remains unchanged, the main line is crossing it inwardly.
  3. The yellow channel is narrower than 20-80 lines, the main line is crossing the level 80 (20) inwardly.

The market entry based either on the main line or on the crossing of the main line and the yellow channel is performed at trader's discretion.

Indicator settings in order of their appearance:

  • K period - period in bars to calculate the indicator values for each bar.
  • D period - period of signal line smoothing, in bars.
  • Slowing - period of main line smoothing, in bars.
  • Profit - target profit in points.
Produits recommandés
!! FLASH SALE !!   Over 80% off !!     For ONE week only. Now only $47 - normally $297! >>>      Ends on 30 June 2023 - Don't miss it! Buy And Sell Signal Arrows On The Chart When The Price Is About To Reverse. Also Sends Alerts –On MT5 To Your Phone To Your Email. Does not repaint. Works on any pair, any timeframe.   (Just ajust the settings for your pair and timeframe.) 10 Activations allowed so you are free from limitations MT4 version here .   Spreads from 0.1pip RAW/ECN Acco
!! FLASH SALE !!   Over 80% off !!     For ONE week only. Now only $47 - normally $297! >>>      Ends on 30 June 2023 - Don't miss it! Buy and Sell Arrows On The Chart According To Price Action Sends Alerts On MT5 To Your Phone To You Email Does NOT repaint. Works on any pair, any timeframe.     10 Activations allowed so you are free from limitations. MT4 Version here . For spreads from a tiny 0.1 pips RAW/ECN Accounts,  click here . Check out my Waka Esque EA signal here: >>   High Ri
Индикатор для отображения свеч размером меньше одной минуты, вплоть до размера в одну секунду, для детализированного просмотра графика . Имеется ряд необходимых настроек для удобной визуализации. Настройка размера хранения истории ценовых данных транслируемых инструментов. Размер видимых свеч. Настройка отображения неподвижности на курсах графика. Возможность отображения на различных торговых инструментах.  Удачной всем торговли.
Why the RSI Alert Indicator is Essential for Your Trading Toolkit In the fast-paced world of trading, timely and accurate information is crucial. The RSI Alert Indicator is a powerful tool designed to help you stay ahead of the market by providing real-time alerts when the Relative Strength Index (RSI) reaches critical levels. Whether you're a novice trader or a seasoned professional, this indicator can significantly enhance your trading strategy by pinpointing potential market reversals with
The professional browser of News and Trading Sessions is now available in MetaTrader 5. Now all the most important market information is collected on one dial! News located on the Time scale. Planning your working time has never been so easy and convenient ... The news scale can be switched a day, two, a week, a month forward or backward (see the details in the short video). All news updates in real time. Thanks to the built-in filters, you can configure the display of news by importance,
Aussenstab Markttechnik
Alexander Josef Zeidler
This indicator shows external bars ("Aussenstäbe") in the chart in candle form. The colors of the candles can be set individually. Also different colors for bearish and bullish bars are possible. In addition, the color of the wicks or outlines is also adjustable. Outside bars are mentioned e.g. by Michael Voigt in the book "Das große Buch der Markttechnik". All other candles are inner bars.
An indicator of patterns #45 and #46 (Three Falling Peaks and Three Rising Valleys) from Encyclopedia of Chart Patterns by Thomas N. Bulkowski. Parameters: Alerts - show alert when an arrow appears   Push - send a push notification when an arrow appears (requires configuration in the terminal) PeriodBars - indicator period K - an additional parameter that influences the accuracy of pattern shape recognition. The smaller the value is, the smoother the row of peaks/valleys should be, so fewer patt
Hello This EA for send Orders Signals when you open or close order and send statics to your channel in Telegram with sum of profit or Loss Pips you can share your orders with your clients in your telegram please watch our video  to see how it is fast. https://www.youtube.com/watch?v=u_7twtYZhyI you must have Telegram channel then make bot and give it Permission and get token (watch this video to know how do it) https://www.youtube.com/watch?v=x1bKWFOjSBE and you must download this files h
This easy to setup indicator shows you the market volumes in a different way, with support and resistance as showed. You can setup: - Backdays volume to show - Heiken Ashi candle view It works for every kind of graph and every kind of period. The program shows the volumes based on the number of candles displayed in the chart: the more candles the more volumes. Enjoy this very useful indicator. Please feel free to message me to report any kind of improvements! :D
The Trap Play MT5
Carl Gustav Johan Ekstrom
5 (1)
Trap Play  refers to a market situation where price initially makes a new high or low, luring traders into believing a strong trend is forming. However, the price quickly reverses and invalidates the breakout, trapping those traders who entered positions based on the initial move. This sudden reversal often results in a rapid exit of positions, leading to significant price movement in the opposite direction.  Trap plays  can occur in various financial markets and timeframes and are characterized
Cet utilitaire vous enverra une notification détaillée sur votre mobile et une alerte sur le terminal MT5 dès qu'une figure en chandelier que vous souhaitez voir apparaître sur le graphique. La notification contient le symbole, la figure en chandelier et la période sur laquelle la figure s'est formée. Vous devez relier Metatrader 5 Mobile à votre terminal Windows. Voici comment. https://www.metatrader5.com/fr/mobile-trading/iphone/help/settings/settings_messages#notification_setup Liste des m
The News Filter MT5
Leolouiski Gan
4 (4)
Ce produit filtre tous les conseillers experts et les graphiques manuels pendant les heures de publication des actualités, de sorte que vous n'avez pas à vous soucier des pics de prix soudains qui pourraient détruire vos configurations de trading manuelles ou les transactions entrées par d'autres conseillers experts. Ce produit est également livré avec un système de gestion des ordres complet qui peut gérer vos positions ouvertes et vos ordres en attente avant la publication de toute actualité.
** All Symbols x All Timeframes scan just by pressing scanner button ** *** Contact me after the purchase to send you instructions and add you in "ABCD scanner group" for sharing or seeing experiences with other users. Introduction This indicator scans AB=CD retracement patterns in all charts. The ABCD is the basic foundation for all harmonic patterns and highly repetitive with a high success rate . The ABCD Scanner indicator is a scanner reversal ABCD pattern that helps you identify when the pr
Volume plays a crucial role in trading, serving as a key indicator of market activity and investor sentiment. Here are some important roles of volume in trading: Confirming trends: Dow Theory emphasizes the importance of volume in determining market trends. Larger volume usually indicates greater disagreement between bulls and bears, while smaller volume may indicate higher market agreement with the current price. Capturing institutional moves: By analyzing volume over a period of time, one c
Rejection Block
Usiola Oluwadamilol Olagundoye
The "Rejection Block" MetaTrader 5 Indicator offers traders a comprehensive tool for identifying and visualizing rejection candlestick patterns, commonly known as rejection blocks. These patterns are pivotal in discerning potential market reversals or continuations, making them invaluable for traders seeking to enhance their analysis. Key Features: Rejection Block Detection: The indicator diligently scans price data, pinpointing instances of rejection candlestick patterns. These patterns typical
FREE
!! FLASH SALE !!   Over 80% off !!     For ONE week only. Now only $47 - normally $297! >>>      Ends on 30 June 2023 - Don't miss it! Marks Market I mbalance / Improper Price Action / Fair Value Gaps on The Chart As traders continue to search for the best trading indicators to guide their investments, the I mbalance / I mproper P rice A ction / F air V alue G ap I ndicator has become increasingly popular. This indicator helps to identify opportunities for taking profit . The indicator begins
Round Number Drawer
William Jidekene Igwe
The Round Number Drawer is an indicator that automatically draw lines or zones at the psychological levels (00 or 50) as the market moves.  New lines are drawn as the market moves while the old lines are deleted. This ensures that your chart is clutter-free. The user specifies the number of lines preferred on the chat, and the indicator keeps the number of lines constant. The indicator plots two types of levels, the Main Level (00 levels e.g. USDCAD 1.33000, 1.34000) and the Sub Level (50 levels
Vol 2 DPOC volume vol 2 DOC-dynamic horizontal volume indicator for any time periods Main settings of the indicator: Volume Source -selecting data for volumes (tick or real) DPOCOn -enabling / disabling the indicator DPOCFrom -calculation start date DPOCTo -settlement end date The indicator allows you to manually select areas on the chart to analyze changes in the maximum volume over time. You can do this by using vertical lines and moving them along the chart. Or by setting specific dates
This indicator is based on the ICCI. If a long pattern is detected, the indicator displays a buy arrow. If a short pattern is detected, the indicator displays a sell arrow. Settings CCI Period - default set to (14) Features Works on all currency pairs and timeframes Draws Arrows on chart Colors Line Color Line Width Line Style Arrow Color This tool can help you analyse the market and indicates market entry.
MarketOpenSessions is an indicator helps as a visual clue for which market session is at the time being. If you consider killzone, market open/close as important factor, this indicator would help you reduce effort in converting from one time zone to another. It has the following features 2 display styles: section (as colored line), and histogram 4 major configurable market sessions i.e. Asia, London, New York, and London-Close session. In additional to end of trading session of the day. Female s
AutoSignals Trend
Aurelio Miguel Machado Da Silva
The indicator tracks the trend in 5 different chart times for the same asset, based on 6 signals for each chart time. The main objective of the indicator is to show us the majority trend of the financial asset in which it was placed. The system transmits the information of the trends in several graphic times, in this way the user is able to have a broad view of the movement of the asset, this type of tool makes the user have a higher hit rate by helping the operator to execute orders in favor
This is a simple arrow system based on Engulfing Candlestick Pattern. It gives you alerts on your smartphone when there is an engulfing candlestick pattern happens. Which type of alerts available? 1. It paints on chart Up/Down Arrows. 2. Popup message and sound alert in trading terminal window. 3. Push notification or Alert on your Android and IOS mobile phones (requires MT4 or MT5 app installed!) *Note: Use it on higher timeframes like H4 (4 hours), D1 (1 Day) then find trade opportunities on s
Utilities
Douglas Lucio De Araujo
Indicator with 3 features - Clock : Clock independent of the chart, counting continues even when the market is closed. - Template : After setting up a configuration in any graphic, be it color patterns, indicators, zoom ... The configuration will be copied to all active graphics. - TimeFrame : Set the TimeFrame on a chart, and with just one click all the active charts will be changed to the same TimeFrame.
JPYTraderSR
Courage Sampson Orji
JPYTraderSR est un simple indicateur de support et de résistance spécifiquement pour le JPYTrader Expert Advisor . Il fournit des confirmations supplémentaires au conseiller expert en indiquant les niveaux de support et de résistance qui façonnent la structure du marché à un moment donné. Il n'y a pas de paramètres fournis pour cet indicateur car son seul but est de fournir plusieurs critères de confluence pour JPYTrader .
This useful tool helps to draw rectangle - range of price between two points of time for many days. For all trading instruments. User set start time (Start Hour, Start Min), end time (End Hour, End Min) and number of days to draw a rectangle. Indicator draw a rectangle marking highest and lowest price in set period of time. Below the rectangle it shows range between MAXprice and MINprice in pp. This tool is almost irreplaceable when you play strategy based on overnight price move (for example
Flag MT5
Dmitry Fedoseev
An indicator of patterns #21, #22, #23 ("Flag") from Encyclopedia of Chart Patterns by Thomas N. Bulkowski. Parameters: Alerts - show alert when an arrow appears Push - send a push notification when an arrow appears (requires configuration in the terminal) PeriodBars - period in bars K - an additional parameter that influences the accuracy of pattern shape recognition. The influence of the parameter will be visible if not all of the pattern variants are enabled (not all three parameters Expandin
Hasbrouck follows up on Kyle’s and Amihud’s ideas, and applies them to estimating the price impact coefficient based on trade-and-quote (TAQ) data. Consistent with most of the literature, Hasbrouck recommends 5-minute time-bars for sampling ticks.  This indicator is based on Advances in Financial Machine Learning 2018 - Marcos Lopez de Prado book, Page 289. --- This code can run slow when using big timeframes, it use copytick to get dollar volume, in a next version I will implement a temporary i
Go Ferramentas
Fabio Oliveira Magalhaes
This product is a set of tools that help the trader to make decisions, bringing information from different categories that complement each other: trend, support / resistance and candle patterns. It also has a panel with information about the balance. The trend has two different calculations and is shown as colored candles. Strategy 1 is longer, having 3 different states: up, down and neutral trend. Strategy 2 has a faster response and has only 2 states: up and down trend. Support and resistance
Market Screener for MT5
Sergey Batudayev
4 (1)
Ce filtre vous permet d'identifier les actifs qui sont plus que d'habitude surachetés (% d'augmentation) ou survendus (% de baisse) au cours d'une période de temps sélectionnée (intervalle de temps). Le marché est régi par la loi, achetez moins cher, vendez plus, mais sans scanner automatique, il vous sera très difficile d'identifier les devises / actions qui sont surachetées ou survendues plus que d'habitude, disons, au cours de la semaine en cours, ou du courant heure ou mois. Il peut y avoir
MT5 Inside Bar Indicator
Muhammad Shamsuddeen Muhammad
This indicator paints any Inside Bar found on the attached chart in a Dark Gray Colour with Black Borders and Wicks. If there are multiple consecutive Inside Bars, then they would also be successively painted Dark Grey with Black Borders and Wicks as well. You may opt to change the colours set by default in order to better contrast with your chosen background and chart colours. I made this Indicator out of necessity as my trading required it. But I know there may be others out there who may need
Les acheteurs de ce produit ont également acheté
Atomic Analyst MT5
Issam Kassas
5 (14)
Tout d'abord, il convient de souligner que cet indicateur de trading n'est ni repainting, ni redrawing et ne présente aucun délai, ce qui le rend idéal à la fois pour le trading manuel et automatisé. Manuel de l'utilisateur : réglages, entrées et stratégie. L'Analyste Atomique est un indicateur d'action sur les prix PA qui utilise la force et le momentum du prix pour trouver un meilleur avantage sur le marché. Équipé de filtres avancés qui aident à éliminer les bruits et les faux signaux, et à
Tout d'abord, il convient de souligner que ce système de trading est un indicateur non repeint, non redessiné et non retardé, ce qui le rend idéal pour le trading manuel et automatisé. Cours en ligne, manuel et téléchargement de préréglages. Le "Système de Trading Smart Trend MT5" est une solution de trading complète conçue pour les traders débutants et expérimentés. Il combine plus de 10 indicateurs premium et propose plus de 7 stratégies de trading robustes, ce qui en fait un choix polyvalent
Quantum Trend Sniper
Bogdan Ion Puscasu
4.91 (43)
Présentation       Quantum Trend Sniper Indicator   , l'indicateur révolutionnaire MQL5 qui transforme la façon dont vous identifiez et négociez les inversions de tendance ! Développé par une équipe de traders expérimentés avec une expérience commerciale de plus de 13 ans,       Indicateur Quantum Trend Sniper       est conçu pour propulser votre parcours de trading vers de nouveaux sommets grâce à sa manière innovante d'identifier les inversions de tendance avec une précision extrêmement élevée
FX Power MT5 NG
Daniel Stein
5 (5)
Obtenez votre mise à jour quotidienne du marché avec des détails et des captures d'écran via notre Morning Briefing ici sur mql5 et sur Telegram ! FX Power MT5 NG est la nouvelle génération de notre très populaire indicateur de force des devises, FX Power. Et qu'est-ce que ce compteur de force de nouvelle génération offre ? Tout ce que vous avez aimé de l'original FX Power PLUS Analyse de la force de l'OR/XAU Des résultats de calcul encore plus précis Périodes d'analyse configurables individuel
Trend Screener Pro MT5
STE S.S.COMPANY
4.88 (64)
Indicateur de tendance, solution unique révolutionnaire pour le trading et le filtrage des tendances avec toutes les fonctionnalités de tendance importantes intégrées dans un seul outil ! Il s'agit d'un indicateur multi-période et multi-devises 100 % non repeint qui peut être utilisé sur tous les symboles/instruments : forex, matières premières, crypto-monnaies, indices et actions. Trend Screener est un indicateur de suivi de tendance efficace qui fournit des signaux de tendance fléchés avec des
Tout d'abord, il convient de souligner que cet outil de trading est un indicateur non repeint, non redessiné et non retardé, ce qui le rend idéal pour le trading professionnel. Cours en ligne, manuel utilisateur et démonstration. L'indicateur Smart Price Action Concepts est un outil très puissant à la fois pour les nouveaux et les traders expérimentés. Il regroupe plus de 20 indicateurs utiles en un seul, combinant des idées de trading avancées telles que l'analyse du trader Inner Circle et
FX Volume MT5
Daniel Stein
4.94 (17)
Obtenez votre mise à jour quotidienne du marché avec des détails et des captures d'écran via notre Morning Briefing ici sur mql5 et sur Telegram ! FX Volume est le PREMIER et SEUL indicateur de volume qui fournit un VRAI aperçu du sentiment du marché du point de vue d'un courtier. Il fournit des informations impressionnantes sur la façon dont les acteurs institutionnels du marché, comme les courtiers, sont positionnés sur le marché des changes, bien plus rapidement que les rapports COT. Voir c
Reversal First Impulse levels (RFI)      INSTRUCTIONS        RUS       -       ENG              R ecommended to use with an indicator   -   TREND PRO -  Version MT4                 A key element in trading is zones or levels from which decisions to buy or sell a trading instrument are made. Despite attempts by major players to conceal their presence in the market, they inevitably leave traces. Our task was to learn how to identify these traces and interpret them correctly. Main functions:: Di
Bill Williams Advanced
Siarhei Vashchylka
5 (5)
Bill Williams Advanced is designed for automatic chart analysis using Bill Williams' "Profitunity" system. The indicator analyzes four timeframes at once. Manual (Be sure to read before purchasing) Advantages 1. Automatically analyzes the chart using the "Profitunity" system of Bill Williams. The found signals are placed in a table in the corner of the screen. 2. Equipped with a trend filter based on the Alligator indicator. Most of the system signals are recommended to be used only accordi
TPSproTREND PrO MT5
Roman Podpora
4.88 (8)
TPSpro TRENDPRO  - is a trend indicator that automatically analyzes the market and provides information about the trend and each of its changes, as well as giving signals for entering trades without redrawing! The indicator uses each candle, analyzing them separately. referring to different impulses - up or down impulse. Exact entry points into transactions for currencies, crypto, metals, stocks, indices!  -  Version MT4               DETAILED DESCRIPTION               R ecommended to use with
AW Trend Predictor MT5
AW Trading Software Limited
4.78 (58)
La combinaison des niveaux de tendance et de panne dans un seul système. Un algorithme d'indicateur avancé filtre le bruit du marché, détermine la tendance, les points d'entrée, ainsi que les niveaux de sortie possibles. Les signaux indicateurs sont enregistrés dans un module statistique, qui vous permet de sélectionner les outils les plus appropriés, montrant l'efficacité de l'historique des signaux. L'indicateur calcule les marques Take Profit et Stop Loss. Manuel et instruction ->   ICI   / v
ICT, SMC, SMART MONEY CONCEPTS, SMART MONEY, Smart Money Concept, Support and Resistance, Trend Analysis, Price Action, Market Structure, Order Blocks, BOS/CHoCH,   Breaker Blocks ,  Momentum Shift,   Supply&Demand Zone/Order Blocks , Strong Imbalance,   HH/LL/HL/LH,    Fair Value Gap, FVG,  Premium  &   Discount   Zones, Fibonacci Retracement, OTE, Buy Side Liquidity, Sell Side Liquidity, BSL/SSL Taken, Equal Highs & Lows, MTF Dashboard, Multiple Time Frame, BigBar, HTF OB, HTF Market Structure
Easy By Sell is a market indicator for opening and closing positions. It becomes easy to track market entries with alerts. It indicates trend reversal points when a price reaches extreme values ​​and the most favorable time to enter the market. it is as effective as a Fibonacci to find a level but it uses different tools such as an algorithm based on ATR indicators and Stochastic Oscillator. You can modify these two parameters as you wish to adapt the settings to the desired period. My othe
Le profit de la structure du marché change à mesure que le prix s'inverse et recule. L'indicateur d'alerte d'inversion de la structure du marché identifie le moment où une tendance ou un mouvement de prix approche de l'épuisement et est prêt à s'inverser. Il vous avertit des changements dans la structure du marché qui se produisent généralement lorsqu'un renversement ou un recul majeur est sur le point de se produire. L'indicateur identifie initialement les cassures et la dynamique des prix,
The Volume by Price Indicator for MetaTrader 5 features Volume Profile and Market Profile TPO (Time Price Opportunity). Volume and TPO histogram bar and line charts. Volume Footprint charts. TPO letter and block marker collapsed and split structure charts. Session filtering and grouping. Static, dynamic and flexible range segmentation and compositing methods with relative and absolute visualizations. Graphical layering, positioning and styling options to suit the user's analytic and aesthetic n
Top indicator for MT5   providing accurate signals to enter a trade without repainting! It can be applied to any financial assets:   forex, cryptocurrencies, metals, stocks, indices .  Watch  the video  (6:22) with an example of processing only one signal that paid off the indicator! MT4 version is here It will provide pretty accurate trading signals and tell you when it's best to open a trade and close it. Most traders improve their trading results during the first trading week with the help of
"Piranha" - an autonomous trading system that determines overbought and oversold levels on the chart. Red and blue zones represent overbought and oversold levels respectively. Entry points are marked with arrows: a downward arrow in the red zone for "sell" and an upward arrow in the blue zone for "buy". The Take profit level is indicated by the green moving average. Key features: Adjusting the Take profit level as the green moving average changes position. Averaging ability when a new market e
Quantum Heiken Ashi PRO MT5
Bogdan Ion Puscasu
4.5 (8)
Présentation du   Quantum Heiken Ashi PRO Conçues pour fournir des informations claires sur les tendances du marché, les bougies Heiken Ashi sont réputées pour leur capacité à filtrer le bruit et à éliminer les faux signaux. Dites adieu aux fluctuations de prix déroutantes et bonjour à une représentation graphique plus fluide et plus fiable. Ce qui rend le Quantum Heiken Ashi PRO vraiment unique, c'est sa formule innovante, qui transforme les données traditionnelles des chandeliers en barres col
Legacy of Gann for MT5
Pavel Zamoshnikov
5 (6)
The indicator very accurately determines the levels of the possible end of the trend and profit fixing. The method of determining levels is based on the ideas of W.D.Gann, using an algorithm developed by his follower Kirill Borovsky. Extremely high reliability of reaching levels (according to K. Borovsky  - 80-90%) Indispensable for any trading strategy – every trader needs to determine the exit point from the market! Precisely determines targets on any timeframes and any instruments (forex, met
** All Symbols x All Timeframes scan just by pressing scanner button ** ***Contact me after purchase to send you instructions and add you in "123 scanner group" for sharing or seeing experiences with other users. After 17 years of experience in the markets and programming, Winner indicator is ready. I would like to share with you! Introduction The 123 Pattern Scanner indicator with a special enhanced algorithm is a very repetitive common pattern finder with a high success rate . Interestingly,
Advanced Supply Demand MT5
Bernhard Schweigert
4.53 (15)
La meilleure solution pour tout commerçant débutant ou expert ! Cet indicateur est un outil de trading unique, de haute qualité et abordable car nous avons intégré un certain nombre de fonctionnalités propriétaires et une nouvelle formule. Avec cette mise à jour, vous pourrez afficher des zones à double horaire. Vous pourrez non seulement afficher un TF plus élevé, mais afficher les deux, le graphique TF, PLUS le TF supérieur : AFFICHAGE DES ZONES NICHÉES. Tous les traders Supply Demand vont ado
IX Power MT5
Daniel Stein
5 (3)
IX Power   apporte enfin la précision imbattable de FX Power aux symboles non-Forex. Il détermine avec précision l'intensité des tendances à court, moyen et long terme de vos indices, actions, matières premières, ETF et même crypto-monnaies préférés. Vous pouvez   analyser tout ce que   votre terminal a à offrir. Essayez-le et découvrez comment   votre timing s'améliore considérablement   lors de vos transactions. Caractéristiques principales d'IX Power Résultats de calcul précis à 100 %,
L'indicateur d'inversion ADR vous montre en un coup d'œil où le prix se négocie actuellement par rapport à sa fourchette quotidienne moyenne normale. Vous recevrez des alertes instantanées par pop-up, e-mail ou push lorsque le prix dépasse sa fourchette moyenne et les niveaux supérieurs de votre choix afin que vous puissiez sauter rapidement dans les reculs et les inversions. L'indicateur trace des lignes horizontales sur le graphique aux extrêmes de la fourchette quotidienne moyenne ainsi que
Gartley Hunter Multi
Siarhei Vashchylka
5 (7)
Gartley Hunter Multi - An indicator for searching for harmonic patterns simultaneously on dozens of trading instruments and on all possible timeframes. Manual (Be sure to read before purchasing) | Version for MT4 Advantages 1. Patterns: Gartley, Butterfly, Shark, Crab. Bat, Alternate Bat, Deep Crab, Cypher 2. Simultaneous search for patterns on dozens of trading instruments and on all possible timeframes 3. Search for patterns of all possible sizes. From the smallest to the largest 4. A
La meilleure solution pour tout débutant ou trader expert ! Cet indicateur est un outil de trading unique, de haute qualité et abordable car nous avons incorporé un certain nombre de caractéristiques exclusives et une nouvelle formule. Avec seulement UN graphique, vous pouvez lire la force de la devise pour 28 paires Forex ! Imaginez comment votre trading va s'améliorer parce que vous êtes capable de repérer le point de déclenchement exact d'une nouvelle tendance ou d'une opportunité de scalp
Fractal Advanced MT5
Siarhei Vashchylka
5 (3)
Fractal Advanced - displays Fractal and Alligator indicators on the price chart. Has wide options for settings and customization. It is also equipped with alerts and a hotkey system. Manual (Be sure to read before purchasing) | Version for MT4 Advantages 1. The indicator does not fill the entire chart with fractals, but allows you to display only relevant signals. 2. The number of fractals is adjusted by scrolling the mouse while holding down the Shift key. 3. Instantly show/hide the Alligator
FxaccurateLS
Shiv Raj Kumawat
WHY IS OUR FXACCCURATE LS MT5 THE PROFITABLE ? PROTECT YOUR CAPITAL WITH RISK MANAGEMENT Gives entry, stop and target levels from time to time. It finds Trading opportunities by analyzing what the price is doing during established trends. POWERFUL INDICATOR FOR A RELIABLE STRATEGIES We have made these indicators with a lot of years of hard work. It is made at a very advanced level. Established trends provide dozens of trading opportunities, but most trend indicators completely ignore them!
TPA True Price Action indicator reveals the true price action of the market makers through 100% non-repainting signals strictly at the close of a candle! TPA shows entries and re-entries, every time the bulls are definitely stronger than the bears and vice versa. Not to confuse with red/green candles. The shift of power gets confirmed at the earliest stage and is ONE exit strategy of several. There are available now two free parts of the TPA User Guide for our customers. The first "The Basics"
Ce tableau de bord affiche les derniers   modèles harmoniques   disponibles pour les symboles sélectionnés, ce qui vous permettra de gagner du temps et d'être plus efficace /   version MT4 . Indicateur gratuit:   Basic Harmonic Pattern Colonnes de l'indicateur Symbol :   les symboles sélectionnés apparaissent Trend   :   haussière ou baissière Pattern :   type de motif (gartley, papillon, chauve-souris, crabe, requin, cypher ou ABCD) Entry:   prix d'entrée SL:   prix du stop loss TP1:   1
Nouvelle génération de zones d'approvisionnement et de demande automatisées. Algorithme nouveau et innovant qui fonctionne sur n'importe quel graphique. Toutes les zones sont créées dynamiquement en fonction de l'action des prix du marché. DEUX TYPES D'ALERTES --> 1) QUAND LE PRIX ATTEINT UNE ZONE 2) QUAND UNE NOUVELLE ZONE SE FORME Vous n'obtenez pas un indicateur inutile de plus. Vous obtenez une stratégie de trading complète avec des résultats prouvés.     Nouvelles fonctionnali
Plus de l'auteur
Good day, ladies and gentlemen. What I offer is a pane that allows trading in any direction with a single mouse click, as well as setting stop loss and take profit automatically without your interference according to predefined values (this function can be disabled). The pane is implemented as an Expert Advisor, the buttons are located on the right part of the chart. The pane will be useful for scalpers that trade with different risk level and for intraday traders. The pane has been tested on li
As the name suggests, the utility collects ticks and uploads them to a file. Each symbol receives its own folder. A directory in the symbol folder is created for each date so that you can find ticks of a necessary symbol and date quickly and easily. The collector is made as fast as possible within MQL. One collector is sufficient for each symbol. Timeframe does not matter. The utility features the function for displaying ticks collected in a file on a chart. You can also navigate ticks using a k
Filtrer:
Aucun avis
Répondre à l'avis
Version 1.3 2022.09.04
добавлен второй способ расчета графиков. настройка Differential = true включает именно его.
Version 1.2 2017.10.23
Changed the calculation of the main line.
Version 1.1 2013.07.15
Fixed the error of buffer processing (the indicator could disappear from the window).