Market Scanner Baks
- Indicateurs
- Andrey Kozak
- Version: 1.0
- Activations: 5
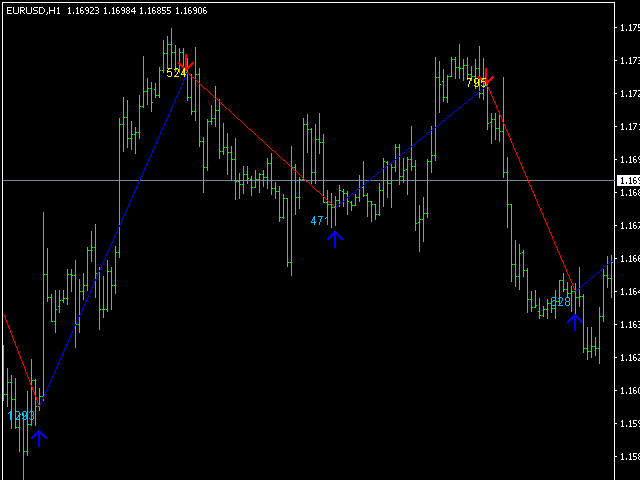
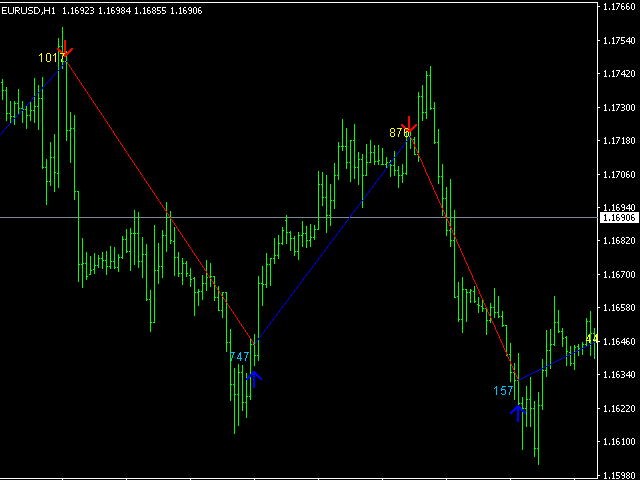
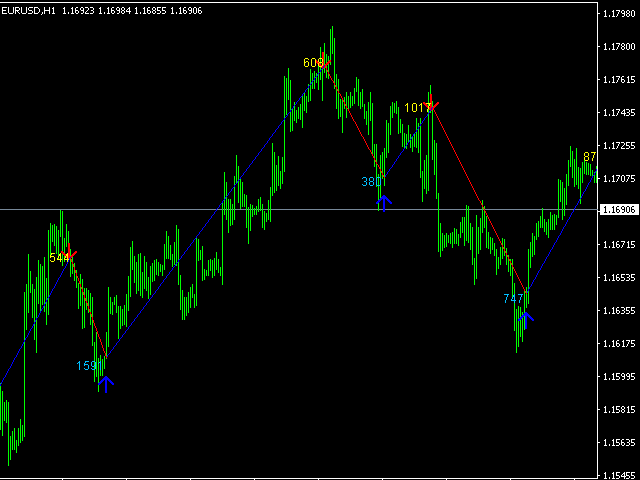
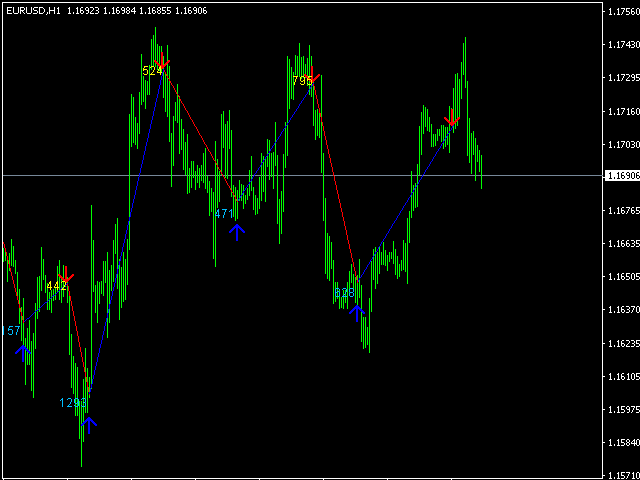
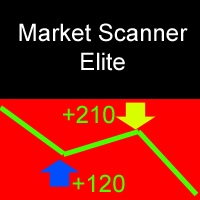
Market Skanner Baks is a new indicator of market scanner. This indicator is equipped with a new algorithm for determining the trend. Now the trader does not need to analyze dozens of different indicators to determine the direction of the price movement. It is enough to place on the Market Scanner Baks chart and see where the arrow shows on the big and small timeframes. Thus, one can understand the short-term and long-term potential price movement. In addition, the indicator on the completion of the movement shows how many points the price has passed in the forecast direction. In the same way, the indicator displays the total profit / loss in points at the trader's wish on the screen.
How to work with this indicator?
We recommend using this indicator to determine the possible price movement. To do this, you need to analyze where the arrow shows on the H1 timeframe and after the arrow appeared in the same direction on the M5 timeframe - open the order in the direction of the arrow. We close the order for TakeProfit and Stoploss. Takeprofit and Stoploss should be set depending on your broker.
Indicator settings:
- period - indicator period.
- bars - the number of bars on which the indicator will be displayed.
- logo - displays the information bar of the indicator on the chart.
