Fibo Bands
- Indicateurs
- Igor Semyonov
- Version: 1.22
- Mise à jour: 25 juillet 2024
- Activations: 7
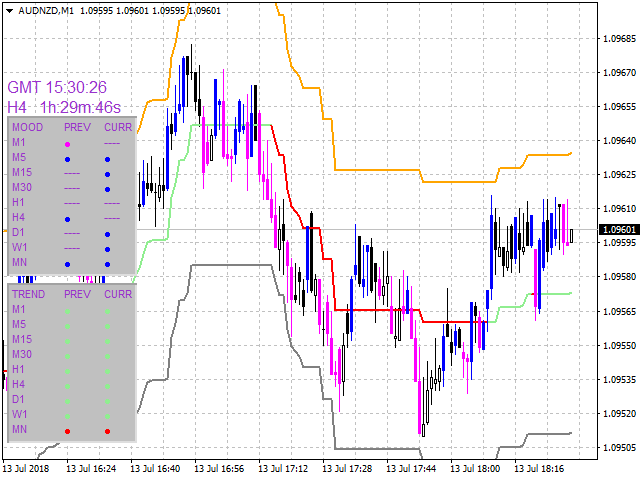
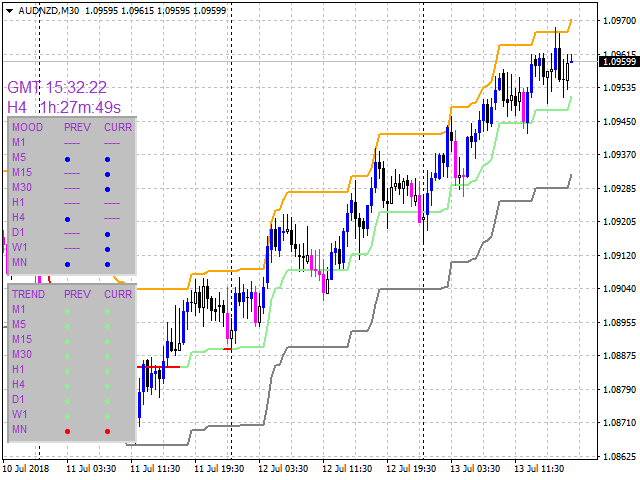
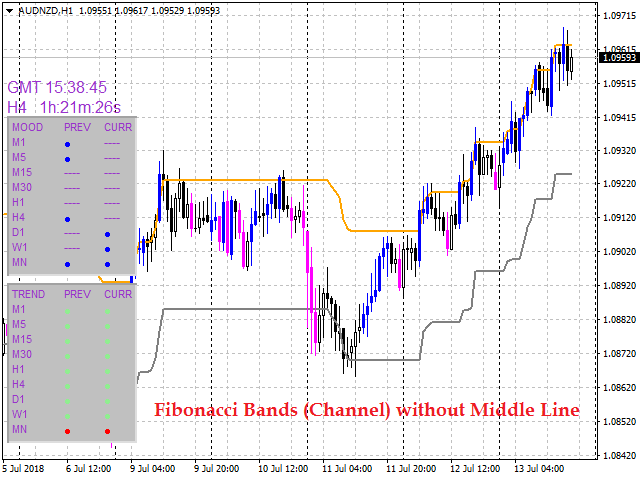
Fibo Bands is an innovative indicator and an analyzer for trading in the current trend direction. The indicator builds a Fibonacci channel (bands), and consists of a trend line (middle line), channel bands, colored bars and reference information.
After completion of the current bar, the trend line, the channel and the color of the bar are not redrawn. However, the channel width can be changed after a reset or restart of the indicator depending on volatility.
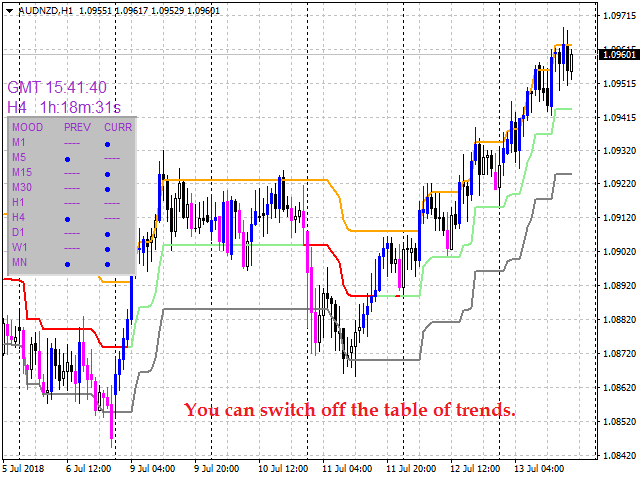
The channel is built in accordance with the Fibonacci expansion, which can be set individually for each timeframe. Channel borders can serve as a take profit target.
Change of market sentiment can be calculated based on one of the fourteen basic indicators included in the standard package of MT4, it affects the color of the trend line.
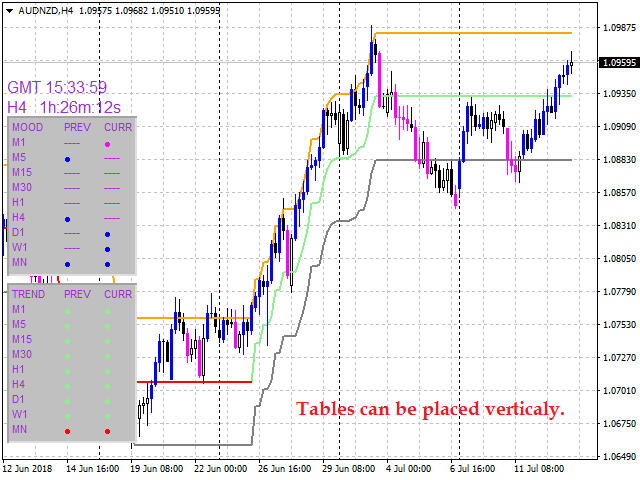
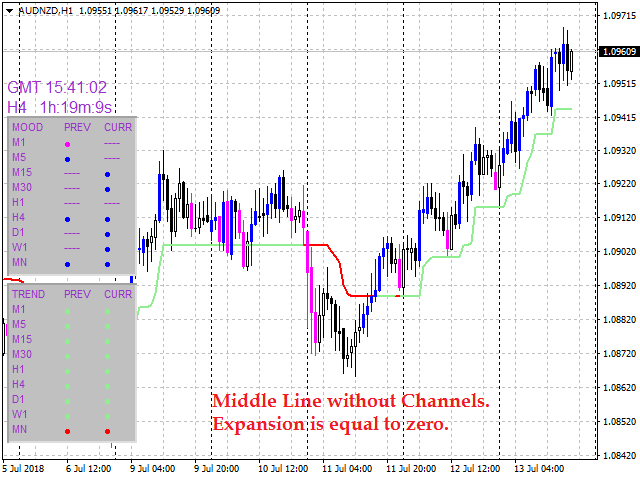
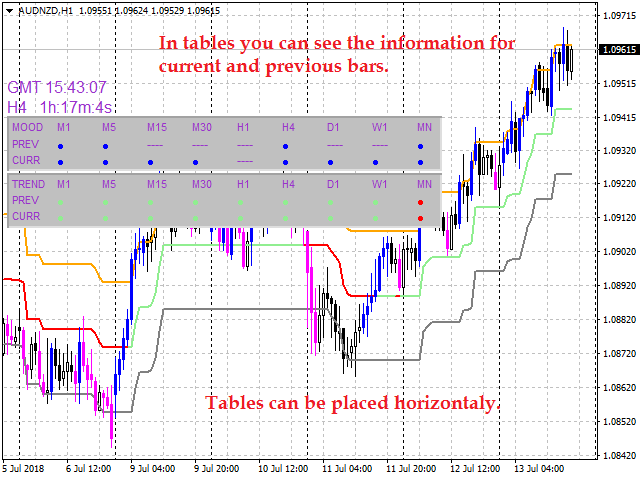
The tables of reference information contain data on the bar color and the middle line on the last two bars on all timeframes. The colors of bars and the middle line characterize the mood of the market.
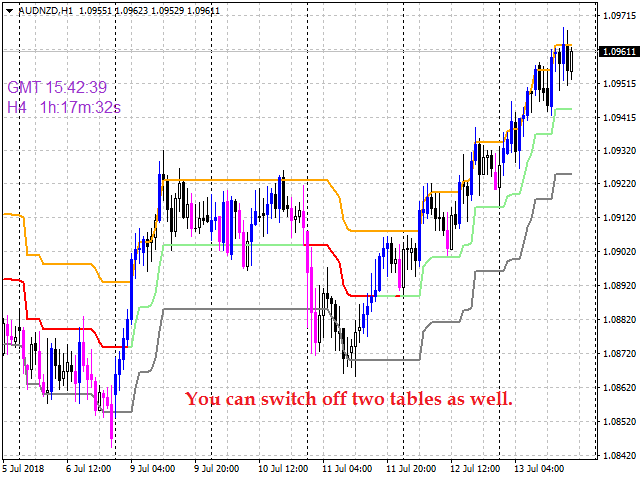
Optionally colored bars, middle line, bands and reference information can be shown on the chart or hidden, as shown in screenshots.
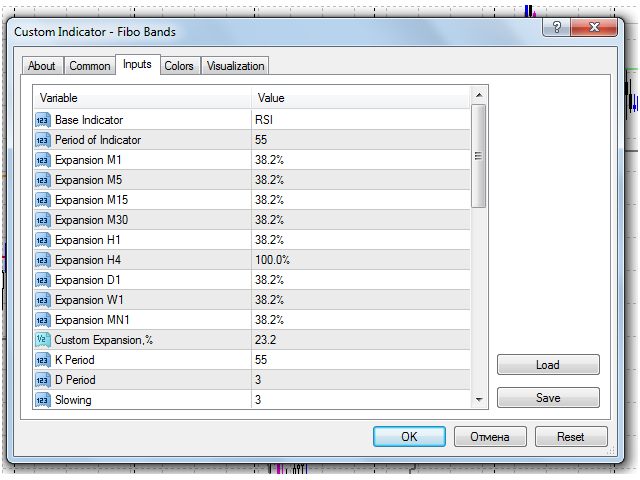
Input parameters
- Base Indicator — the basic indicator used;
- Period of Indicator — calculation period for the basic indicator;
- Expansion M1... MN1 — Fibonacci expansion settings for different timeframes;
- Custom Expansion,% — custom expansion value;
- K Period — Stochastic parameters;
- D Period — Stochastic parameters;
- Slowing — Stochastic parameters;
- Stochastic Price Type — Stochastic calculation price;
- Price Field — averaging method for the Stochastic signal line;
- MA Fast Period — fast moving average period for the basic indicator;
- MA Slow Period — slow moving average period for the basic indicator;
- MA Signal Period — signal line period for the basic indicator;
- Applied Price — price used for the calculation of the basic indicator;
- MA Method — the averaging method of the basic indicator's moving average;
- Mode Line — basic indicator's line index;
- Candlesticks Painting — coloring of bars;
- Corner Type — the chart corner to show information;
- Corner X Distance — table coordinate along the X axis in pixels;
- Corner Y Distance — table coordinate along the Y axis in pixels;
- Middle Line Drawing — display of the middle line;
- GMT — show current GMT time value;
- Time of H4 Next Bar — time left until completion of the H4 bar;
- Table for Candlesticks Scanning — this table scans color of bars;
- Table for Middle Line Scanning — this table scans colors of the middle line;
- Vertical Table — the table display method;
- Information Color — color for the information;
- Bullish Color of Candlesticks — color of bullish bars;
- Bearish Color of Candlesticks — color of bearish bars;
- Bullish Color of Middle Line — bearish color for the middle line;
- Bearish Color of Middle Line — bullish color for the middle line.
Purpose
The indicator can be used for manual or automated trading within an Expert Advisor. Values of indicator buffers of the double type can be used for automated trading:
- The middle line of the bullish trend — buffer 0;
- The middle line of the bearish trend — buffer 1;
- Upper channel border — buffer 2;
- Lower channel border — buffer 3;
- Bar coloring — any of the buffers 4, 5, 6 or 7.
Indicator buffers must not be equal to EMPTY_VALUE.









Nice product if you learn how to use it. Congrats to author.