Supporta MT4
- Indicateurs
- Alexey Isavnin
- Version: 1.0
- Activations: 20
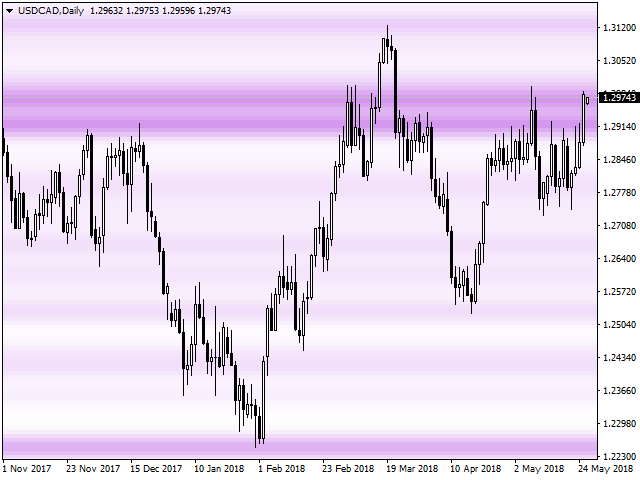
Supporta is a trading indicator that automatically identifies support and resistance levels and their strengths from price movements and draws them on price charts. The instrument supports both the MetaTrader 4 and MetaTrader 5 terminals and can be used on any financial instrument and any timeframe. The MetaTrader 5 version is available on the market as Supporta MT5. For full documentation and quick start, please refer to the official guidebook which is available for download in the comments section.
The concept of support and resistance applied to financial markets describes levels or areas of price charts, which serve as barriers for price movements: a support level does not let the price drop below it while a resistance level does not let the price rise above it. Formation of such zones is largely a collective psychological effect exhibited by market participants. Support and resistance levels are formed by multiple repetitive touches and reversals of the price off certain price areas. Eventually these levels get broken, which is a signature of a moving or trending market. Once a resistance level is broken it often becomes a support level and vice versa.
These price levels offer opportunities for entering a trade with a small risk since often the price makes substantial moves bouncing off a level or breaking through it. The exact direction of the price movement from a support/resistance level has to be forecasted by other means, for instance, by price action analysis. Therefore, as the name of this indicator suggests, it is supposed to act a supporting tool in trader's decisions (supporta - supporter, assistant, French). It removes subjectivity and human factor from level plotting and replaces it with strict mathematical rules.
Supporta is controlled by five simple parameters:
- Number of historical bars adjusts the number of bars used to scan for support and resistance levels. For instance, 400 bars on a D1 chart would mean 400 days, and 2000 bars on an H1 chart would mean 2000 hours. Supporta is recalculated on each new bar using this amount of historical bars.
- Number of horizontal stripes adjusts the amount of stripes used scan for support/resistance levels. The width of a stripe is defined by the difference between maximal and minimal price during the number of historical bars divided by the number of stripes. A large number of scanning stripes makes each individual stripe narrower and thus makes the scanning algorithm more granular.
- Smoothing parameter adjusts the smoothing of the levels. By increasing this parameter the levels are allowed to be more fuzzy as more extrema lying further from them are making input in level strength.
Number of horizontal stripes and smoothing parameter together control the resolution of the scanning algorithm.
- Level detection method switch allows you to choose between two methods of extrema scanning. The first method - high & low prices - uses Highs and Lows to search for price extrema and thus to search for levels. The second method - close prices - uses close prices. Using close prices might be a good decision to analyze timeframes where the close price of a bar can have an underlying psychological effect on a market. For instance, on the W1 timeframe, traders often seek to close the deals before the end of the week and hence the close price of a W1 bar might be more important than its High/Low.
- Color sets the color of the levels. The strength of the level is indicated by the brightness its color.


L'utilisateur n'a laissé aucun commentaire sur la note