Folding meter 4 Trend Lines
- Indicateurs
- Alexander Shienkov
- Version: 4.2
- Mise à jour: 4 janvier 2024
- Activations: 10
Folding rule of 4 trend lines
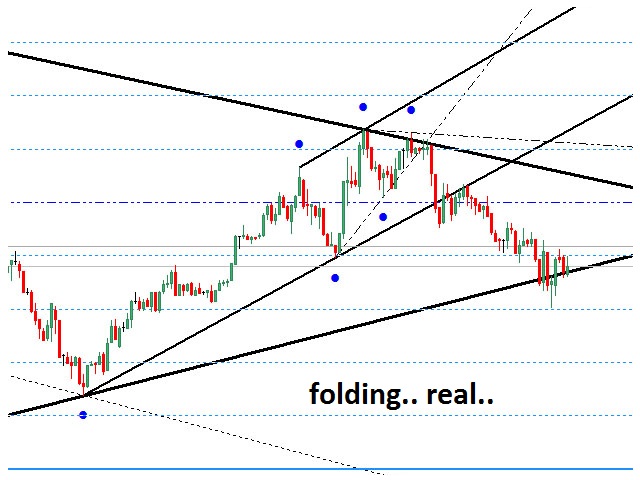
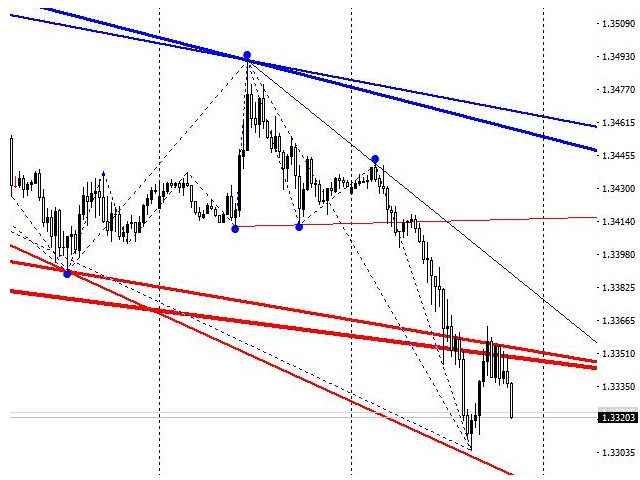
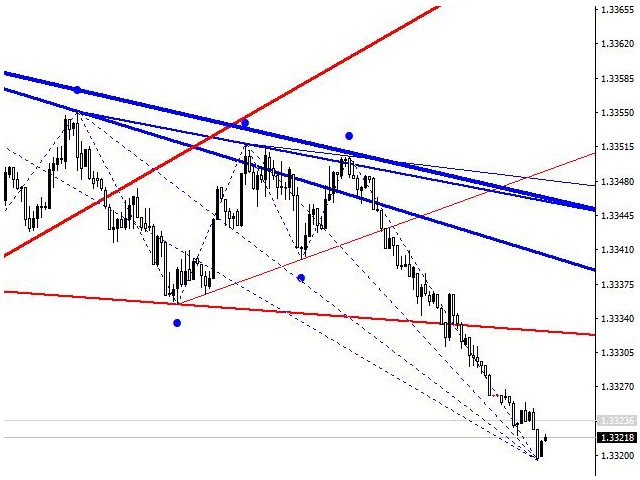
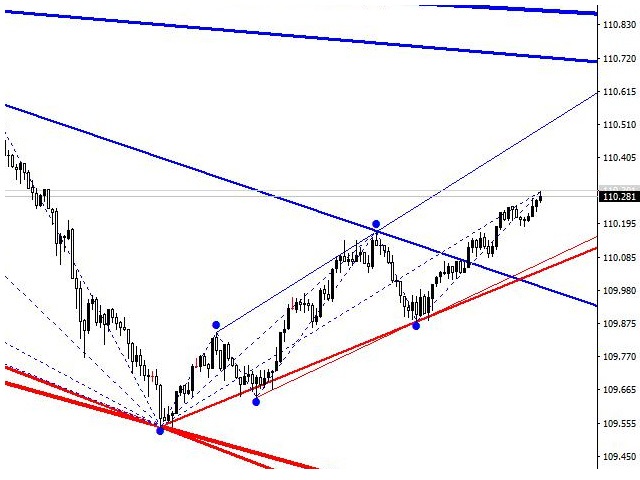
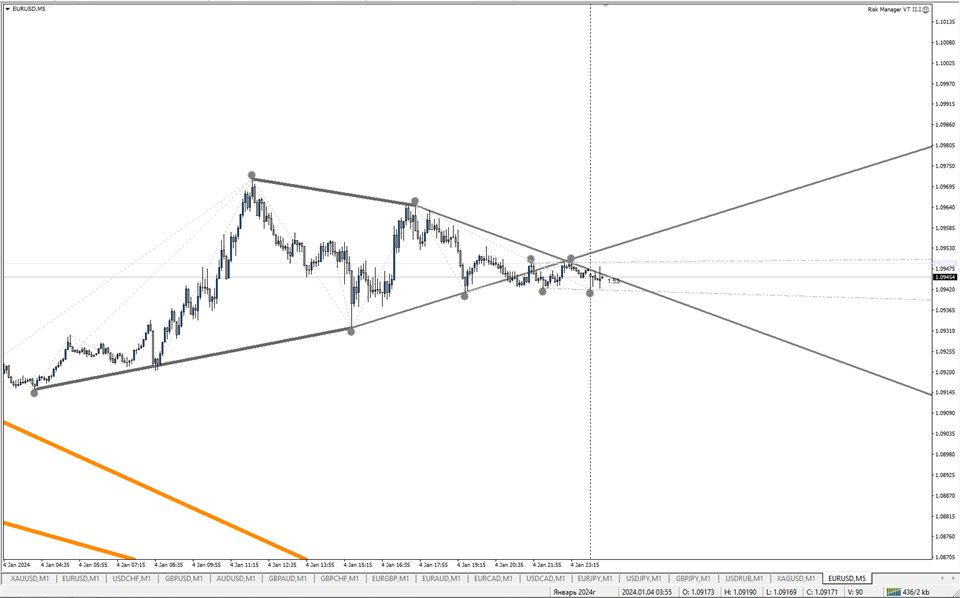
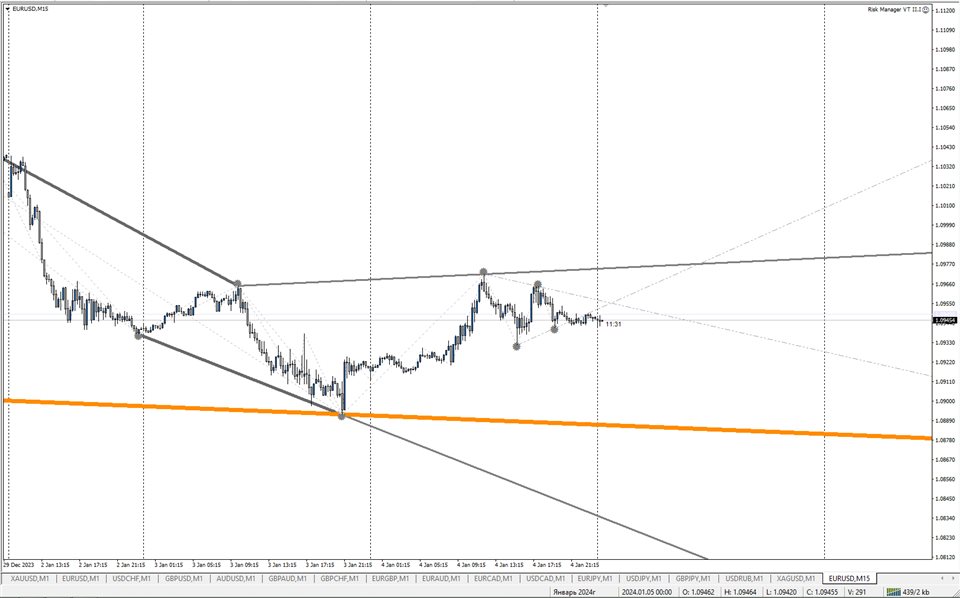
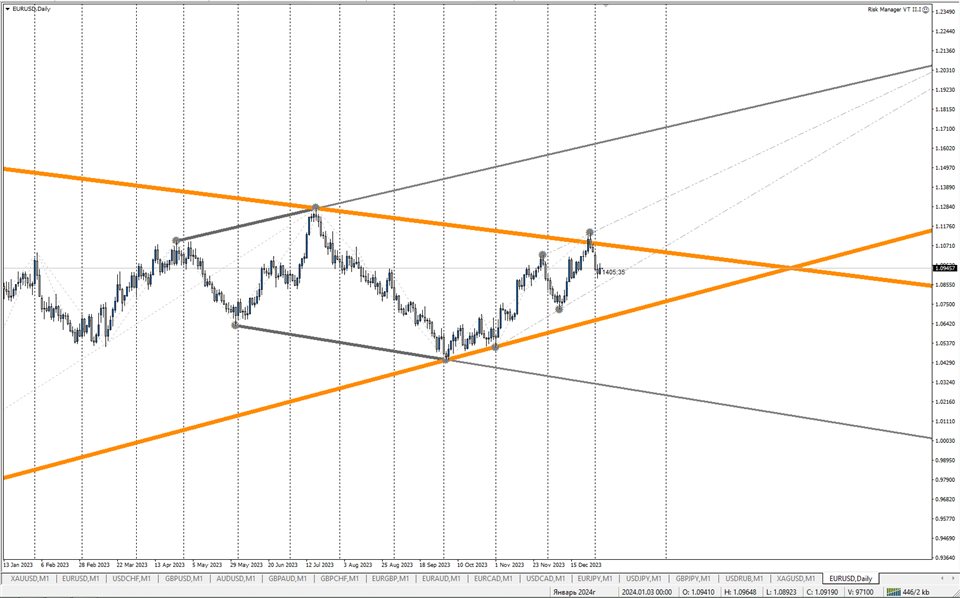
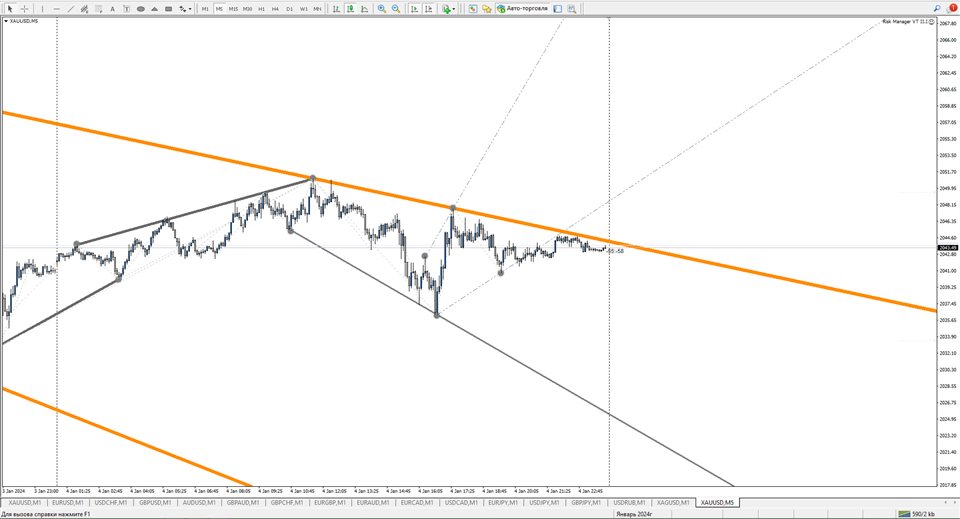
The indicator has been created based on the "Folding rule" trading strategy. It shows four pairs of inclined resistance and support lines.
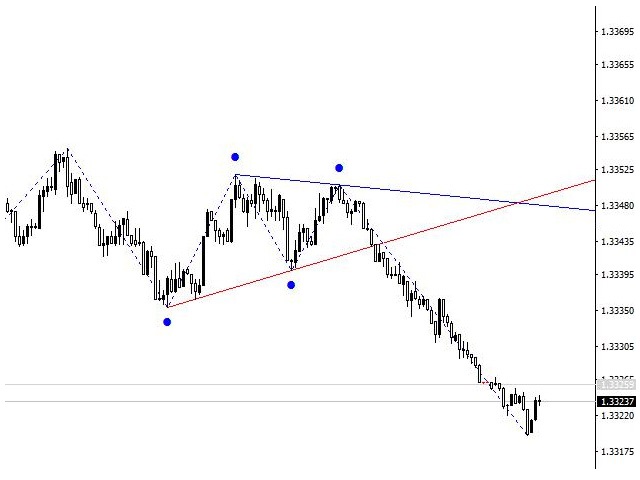
These lines are plotted based on the nearest High and Low of the ZigZag technical indicator with four given input parameters.
The indicator draws dots above and below the price extremums that have been used for plotting the trend lines.
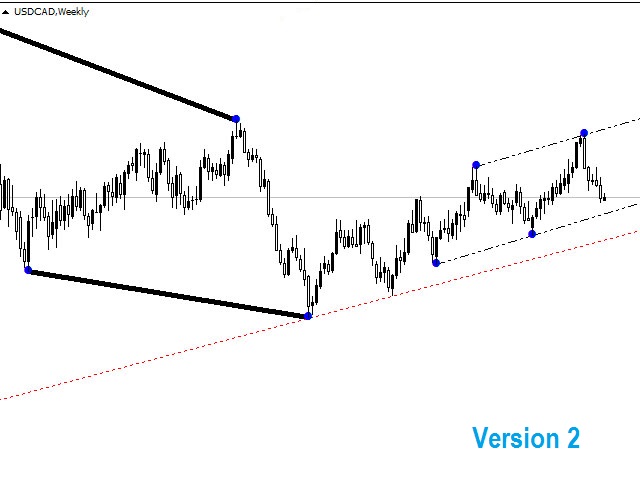
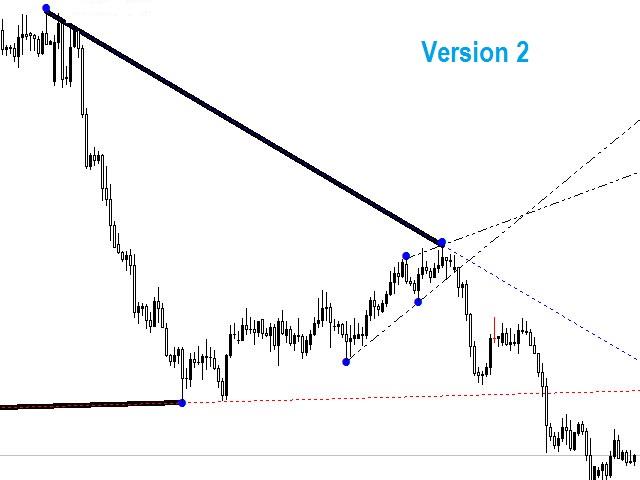
The indicator of trend lines facilitates the plotting of trend lines, channels and technical patterns (such as "Triangle", "Wedge" and the like), which are formed by the price of the currency pair. Traders actively look for these formations on the charts and use them when working in the currency and stock markets to determine the movement exhaustion, to search for trade signals.
This indicator allows obtaining a variety of trading signals:
- Global trend and intraday trend
- Technical figures: "Channel", "Diverging, Converging Wedge", "Triangles";
- Determining the price Highs and Lows using the built-in "Zigzag" lines;
- Visualization of the price acceleration;
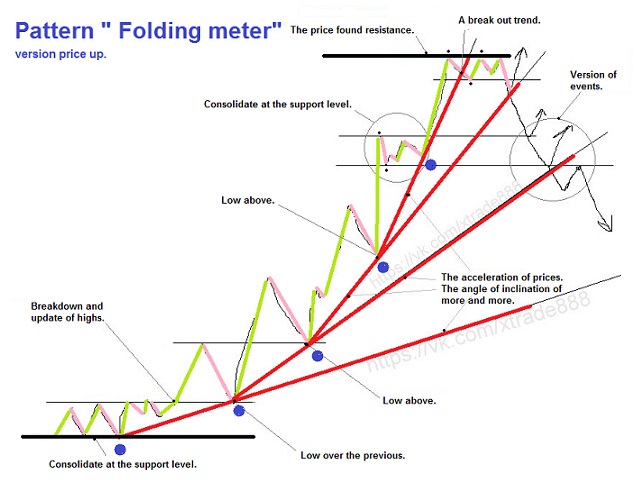
Brief description of the "Folding rule" strategy
Folding rule is a unique pattern created from trend lines. To understand the pattern, it is necessary to notice the movement of the price in three or more phases, namely the origination of the trend, its movement and active acceleration. After passing all three or four phases, the trend usually starts depleting, which leads to a new price reversal. Naturally, you will be unable to immediately determine if a new trend has formed or it is merely a correction. However, making a profit on a new reversal movement is possible in case a support trend line is broken during (red by default) during an ascending movement, or in case a resistance trend line (blue by default) is broken during a descending price movement.
Note: if you are not familiar with the "Folding rule" strategy, you can find more information about it on the Internet or printed literature on trading.
The indicator provides the ability to:
- change the colors and thickness of trend lines;
- change the color of the icons indicating the highs or lows used for plotting the lines;
- change the appearance of the icons of highs and lows;
- change the color of the ZigZag plot lines;
- disable all objects of the indicator of the chart;
Default inputs of the indicator
- Show Lines 1;2;3;4 - enable/disable trend lines of support and resistance. Default: true; false; false; false.
- ExtDepth1, ExtDeviation1, ExtBackstep1 - ZigZag plot parameters for the first trend lines. Default: 12,5,3.
- ExtDepth2, ExtDeviation2, ExtBackstep2 - ZigZag plot parameters for the second trend lines. Default: 24,10,6.
- ExtDepth3, ExtDeviation3, ExtBackstep3 - ZigZag plot parameters for the third trend lines. Default: 48,20,12.
- ExtDepth4, ExtDeviation4, ExtBackstep4 - ZigZag plot parameters for the fourth trend lines. Default: 12,5,3.
- Color support trend line 1;2;3;4 - colors of the resistance trend lines. Default: Blue.
- Color resistance trend line 1;2;3;4 - colors of the support trend lines Default: Red.
- Widch trend line 1;2;3;4 - widths of the trend lines. Default: 1,2,3,4.
- Show dot building all levels - enable/disable icons indicating the highs and lows for plotting the trend lines. Default: true (enabled).
- Сode icon dot - code of plot icons. Default: 159.
- Widch Dot icon - width of icons. Default: 3.
- Color Dot icon - color of icons. Default: Blue.
- The indent of the dot - offset of the icons from the price extremums used for plotting the trend lines. Default: 20.
- Show technical zigzag - show/hide the lines of the ZigZag technical indicator. Default: show.
- Color ZigZag - ZigZag color. Default: Blue.
- Width ZigZag - width of the ZigZag lines. Default: 1.
A few tips for traders
- Before use, it is recommended to study the "Folding rule" strategy and technical figures.
- Wait for confirmation (candle close above or below the horizontal and inclined lines, levels).







Purchased after thorough testing. It's a solid indicator, I use it for scalping. Mixed with proper S&R becomes very powerful but standalone is fine.