DeMarker Alerts MT5
- Indicateurs
- Yurij Izyumov
- Version: 1.1
- Mise à jour: 26 novembre 2021
- Activations: 20
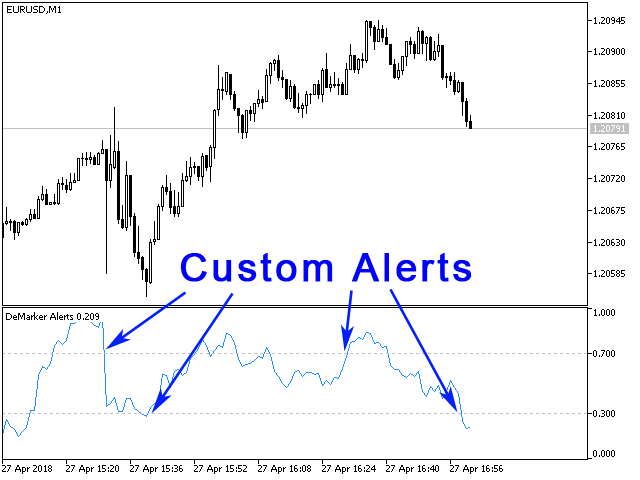
You can avoid constant monitoring of computer screen waiting for the DeMarker signal while receiving push notifications to a mobile terminal or a sound alert on the screen about all required events, by using this indicator - DeMarker Alerts. In fact, it is the replacement of the standard indicator with which you will never miss the oscillator signals.
If you don't know the benefits of DeMarker or how to use it, please read here. If you need signals of a more popular RSI indicator, use RSI Alerts. If you need the version for MetaTrader 4, see DeMarker Alerts.
Currently supported events
- Indicator crossing down the upper signal level (default is 0.7) - a sell signal.
- Indicator crossing up the upper signal level (default is 0.7) - a buy signal, or better wait.
- Indicator crossing down the lower signal level (default is 0.3) - a buy signal, or better wait.
- Indicator crossing up the lower signal level (default is 0.3) - a buy signal.
You can also edit the values of these levels using the Max signal level and Min signal level variables.
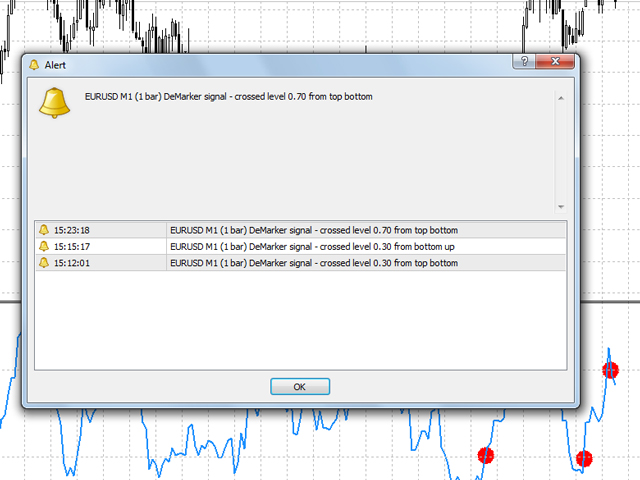
Available Alerts
- Sound signal with a pop-up message box - Alert.
- A push notification to a mobile terminal (smartphones and tablets) - Push.
If you want to enable push notifications with DeMarker signals, you should indicate MetaQuotes ID (how to do it).
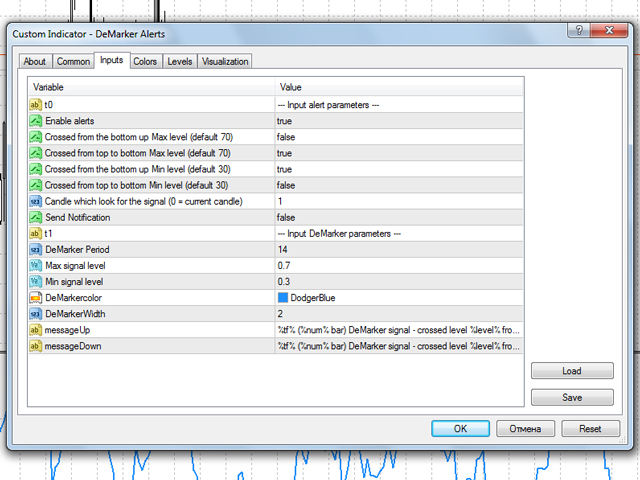
Indicator Parameters
- Enable alerts - allow sound alerts and message display on the screen.
- Crossed from the bottom up Max level (default 0.7) - enable alert for the indicator crossing Max signal level from bottom up
- Crossed from top to bottom Max level (default 0.7) - enable alert for the indicator crossing Max signal level from top down
- Crossed from the bottom up Min level (default 0.3) - enable alert for the indicator crossing Min signal level from bottom up
- Crossed from top to bottom Min level (default 0.3) - enable alert for the indicator crossing Min signal level from top to bottom
- Candle which look for the signal (0 = current candle) - the number of the candlestick, on which the signal is used (0 - current candle, 1 - previous).
- Send Notification - allow sending Push notifications to your mobile terminal.
- DeMarker Period - DeMarker indicator period
- Max signal level - upper signal level
- Min signal level - lower signal level
- DeMarkercolor - indicator color
- DeMarkerWidth - indicator line width
- messageUp - message template for upward crossing
- messageDown - message template for downward crossing
It is also possible to change the text in the message. In variables messageUp and messageDown:
- %level% mean the level crossed by the indicator
- %tf% mean the timeframe from which the signal is received.
- %num% mean the number of the candlestick from which the signal is received.
If this indicator is lacking functionality you want, be welcome to write me.