• Aperçu
  • Avis (6)
  • Commentaires (18)
  • Nouveautés

Candle patterns scanner with trend filter MT5

5

Cet indicateur à plusieurs périodes et à plusieurs symboles recherche les barres à épingles, les étoiles du matin/soir, les engloutissements, les pinces à épiler, les frappes à trois lignes, les barres intérieures, les fanions et les triangles. L'indicateur peut également être utilisé en mode graphique unique. Veuillez en savoir plus sur cette option dans le produit blogue. Combiné à vos propres règles et techniques, cet indicateur vous permettra de créer (ou d'améliorer) votre propre système puissant.

Caractéristiques

  • Peut surveiller tous les symboles visibles dans votre fenêtre Market Watch en même temps. Appliquez l'indicateur à un seul graphique et surveillez instantanément l'ensemble du marché.
  • Surveille chaque période, de M1 à MN, et vous envoie une alerte en temps réel (pop-up, push ou mail) lorsqu'un modèle est identifié.
  • Peut utiliser les bandes RSI et Bollinger comme filtre pour les formations pin bar, étoile du matin/soir , engloutissant et pince à épiler afin d'identifier correctement les inversions potentielles.
  • Peut utiliser la moyenne mobile comme filtre de tendance majeur et ADX comme filtre de volatilité.
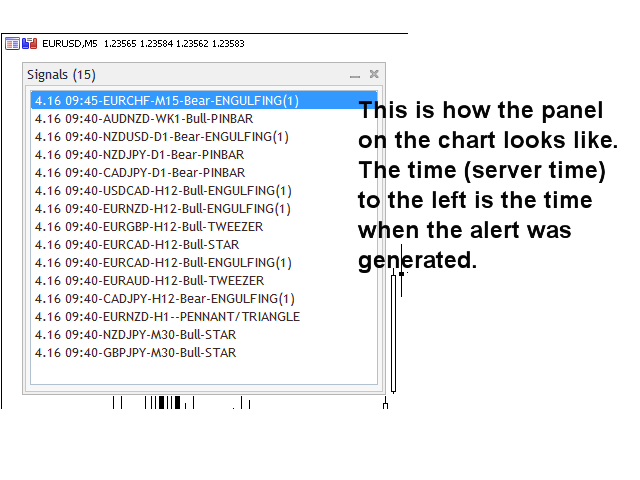
  • L'indicateur comprend un panneau interactif. Lorsque vous cliquez sur un élément, un nouveau graphique s'ouvrira avec le symbole et la période en question.
  • L'indicateur peut écrire les signaux dans un fichier qui peut être utilisé par un Expert Advisor pour le trading automatique. Par exemple ce produit.

Le balayage Pennant et Triangles identifie les modèles de cassure à haute probabilité. Pour ce faire, il identifie des fanions et des triangles forts et symétriques. Ce modèle n'apparaît pas très souvent sur des délais plus longs. Mais quand c'est le cas, c'est une configuration à très haute probabilité. S'il te plait regarde captures d'écran ici.

Paramètres d'entrée

S'il vous plaît trouver la description et l' explication des paramètres d'entrée ici.

Important

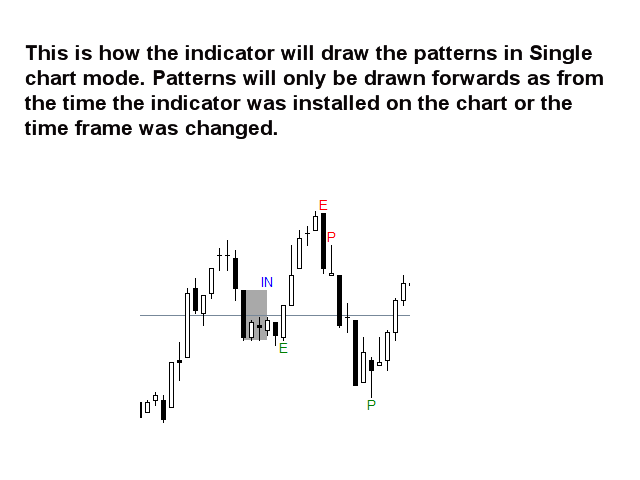
Veuillez noter qu'en raison de la multifonctionnalité, ni les conseils d'achat et de vente ni les lignes et les flèches ne seront tracés sur le graphique où l'indicateur a été installé. Des lignes indiquant les barres intérieures et les formations et flèches Pennant et Triangles pour les autres modèles de bougies seront dessinées sur le graphique qui s'ouvre lorsque vous cliquez sur un singal dans le panneau graphique.

Il est fortement conseillé de placer l'indicateur sur un graphique propre (vide) sans aucun autre indicateur ou conseiller expert dessus qui pourrait interférer avec le scanner.

Avis 6
tunck
1194
tunck 2023.04.08 02:44 
 

SL/TP for patterns?

Kayhan
62
Kayhan 2021.09.07 16:25 
 

I was looking forward to seeing this kind of indicator. Thank you very much.

smmfx
80
smmfx 2020.11.05 16:07 
 

An amazing indicator that gives me very accurate signals based on my strategy. I thank Jan for answering my challenging questions before I buy it. The coding and details that saw looks very professional.

Produits recommandés
Cet indicateur de tableau de bord de divergence multi périodes et multi symboles envoie une alerte lorsqu'une ou deux divergences différentes ont été identifiées sur plusieurs périodes et non sur des divergences uniques. Il peut être utilisé avec toutes les plages horaires de M1 à MN. Un maximum de 9 périodes peuvent être affichées dans le tableau de bord en même temps. Il est possible d'activer le filtre de tendance de la moyenne mobile, du RSI ou des bandes de Bollinger pour filtrer uniquement
Cet indicateur de tendance à plusieurs périodes et à plusieurs symboles envoie une alerte lorsqu'une forte tendance ou un renversement de tendance a été identifié. Il peut le faire en choisissant de construire le tableau de bord à l'aide de la moyenne mobile (simple ou double (crossover MA)), RSI, bandes de Bollinger, ADX, indice composite (Constance M. Brown), Awesome (Bill Williams), MACD (ligne de signal ), Heiken Ashi lissé, moyenne mobile de Hull, croisements stochastiques, Gann HiLo Activa
Cet indicateur à plusieurs périodes et à plusieurs symboles identifie les formations haut/bas doubles ou triples ou une cassure de décolleté suivante (haut/bas confirmé). Il offre des filtres RSI, pin bar, engloutissant, pince à épiler, étoile du matin/soir ainsi que des options de filtre de divergence qui permettent de filtrer uniquement les configurations les plus fortes.       L'indicateur peut également être utilisé en mode graphique unique. Veuillez en savoir plus sur cette option dans le p
Utilities
Douglas Lucio De Araujo
Indicator with 3 features - Clock : Clock independent of the chart, counting continues even when the market is closed. - Template : After setting up a configuration in any graphic, be it color patterns, indicators, zoom ... The configuration will be copied to all active graphics. - TimeFrame : Set the TimeFrame on a chart, and with just one click all the active charts will be changed to the same TimeFrame.
Kill Zones MT5
Diego Arribas Lopez
MT4 Version Kill Zones Kill Zones allows you to insert up to 3 time zones in the chart. The visual representation of the Kill Zones in the chart together with an alert and notification system helps you to ignore fake trading setups occurring outside the Kill Zones or specific trading sessions. Using Kill Zones in your trading will help you filter higher probability trading setups. You should select time ranges where   the market   usually reacts with high volatility. Based on   EST time zone, f
Bar Sequential
Maximiliano Frisione Figueroa
This indicator can help you clearly identify trend changes in both bullish and bearish markets. The indicator compares the closing price of the last candle with the closing price of the candle "X" periods ago (input parameter). In an uptrend, an initial number '1' is plotted if a candle closes higher than the closing of a candle "X" periods ago. In a downtrend, an initial number '1' is plotted if a candle closes below the closing of a candle "X" periods ago. Subsequent numbers are plotted when e
FREE
I recommend you to read the  product's blog  (manual) from start to end so that it is clear from the beginning what the EA offers. This Expert Advisor (EA) is designed to trade on a rapid price movement following a news event. The EA trades multiple symbols from one single chart which must be a EURUSD H1 chart. It it advisable to remove all symbols you don't trade from the Market Watch to reduce the overall data demand. The 'Auto settings' input parameter value True must only be used you have s
Moving pivot Average Fibonacci The  indicator compares the selected period with its counterpart from the previous period. The indicator determines the moving Fibonacci levels for the day or any time interval to assess the price movement range from the time average. The indicator helps predict the expected high or low for the day based on historical time data. The pivot line can be considered an average trend line and use it in a variety of trading strategies. If you have any question about t
KT DMA is a modified and advanced version of the classic Displaced Moving Averages with buy/sell crossover alerts and a Multi-Timeframe scanner that shows DMA's direction across each real-time time frame. A Displaced Moving Average is a simple moving average that moves ahead or backward in a time frame (either short-term or long-term). It also allows you to predict price movement more accurately. Features Depicts the trend direction using the alignment of three moving averages. Buy/Sell signa
My Point MT5
Claudia Ramona Angerer
Diagnosis of major and minor pivot Trend detection with many signals Can be used in all symbols Can be used in all time frames Settings: Back Show: The number of candles it displays If you need any adjustments, or have any questions or suggestions, message me How to trade: Blue: sell signal Red: buy signal Blue and red at the same time: no signal Exit signal: Opposite signal
Aussenstab Markttechnik
Alexander Josef Zeidler
This indicator shows external bars ("Aussenstäbe") in the chart in candle form. The colors of the candles can be set individually. Also different colors for bearish and bullish bars are possible. In addition, the color of the wicks or outlines is also adjustable. Outside bars are mentioned e.g. by Michael Voigt in the book "Das große Buch der Markttechnik". All other candles are inner bars.
Optimistic trader may enter the market when the price crosses the Aqua line. More reliable entry will be when the price crosses the Blue line. When the price comes back and crosses the Red line you can open a position in the course of price movements.
Fibonacci automatically draws Fibonacci retracement, Because Fibonacci automatically draws Fibonacci retracement, you can know at a glance the price to buy at a push or sell back. Therefore, you can trade in favorable conditions in a trending market. We are live-streaming the actual operation of the system. Please check for yourself if it is usable. Please check it out for yourself. https://www.youtube.com/@ganesha_forex We do not guarantee your investment results. Investments should be mad
CET INDICATEUR, BASÉ SUR L'INTELLIGENCE ARTIFICIELLE, identifie les points de retournement possibles du marché en lisant l'empreinte, et signale À L'AVANCE les petits mouvements du marché avant qu'ils ne se produisent. Contrairement aux indicateurs de prix et de volume, qui génèrent des entrées « tardives », c'est-à-dire lorsqu'une confirmation de prix ou de volume a déjà eu lieu sur un changement de direction, et donc souvent le mouvement est déjà terminé, cet indicateur signale, en fonction d
SMARTMASS INDICATOR This indicator is different from all known volume indicators. It has a significant distinction; it is an algorithm that relates price movement to volume, attempting to find proportionality and efficient movement while filtering out noise and other movements that are more random and do not follow a trend or reversal. Ultimately, it reveals the true strength of the movement, indicating whether it has genuine support from bulls or bears or if it's merely a high-volume movemen
Introducing the 'No Nonsense Reversal Megaprofits' indicator for MetaTrader 5 (MT5), your ultimate tool for identifying trend reversals with precision and confidence. This powerful indicator is designed to cut through the noise of the markets and pinpoint crucial turning points with ease. Powered by advanced algorithms, 'No Nonsense Reversal Megaprofits' analyzes price action and key market dynamics to accurately detect when a trend is about to reverse. Whether you're a novice trader or a season
The 4 headed dragon is an indicator that has two functions. 1) Set the background trend. 2) Mark the predominant trend. By combining these two indicator signals, we will be able to trade for or against the trend, adapting the signals to your reading of the market. You can download the demo and test it yourself. 1) Set the background trend.    Define four possibilities of trend that are the four heads of the dragon, marked by colors on the indicator, marking a) Powerful buying trend. b)
Candle Good Setup
Kibalo Alain Kabissa
You ask yourself the question every time you open your charts: how to win in trading? Will using a lot of indicators work? well know that I also asked myself the same questions when I first started trading. After testing many indicators, I realized that winning trading is simple and accurate trading. after several months of thinking and optimizing I was able to find my solution: Candle Good Setup Candle Good setup is a trend and entry timing indicator analyzing the market in multi-frame to give
Cet indicateur multi-temps et multi-symboles identifie les motifs double haut/bas, tête et épaule, fanion/triangle et drapeau. Il est également possible de configurer des alertes uniquement lorsqu'une cassure de décolleté/triangle/mât de drapeau s'est produite (rupture de décolleté = signal confirmé pour le haut/les bas et la tête et les épaules).       L'indicateur peut également être utilisé en mode graphique unique. Veuillez en savoir plus sur cette option dans le produit   blogue . Combiné à
Despite the apparent simplicity of the indicator, inside it has complex analytical algorithms with which the system determines the moments of inputs. The indicator gives accurate and timely signals to enter and exit the transaction that appear on the current candle. The main purpose of this indicator is to determine the moments of entry and exit from transactions, therefore, the Trend Revers indicator will display only the trend line and entry points, that is, displays the entry points to the
Zigzag X Fibo
Ian David Emmanuel Bello
The ZigZag indicator's main objective is to highlight significant price movements by filtering out minor price fluctuations. It enables the visualization of trends by eliminating market "noise," which can assist traders in making more informed decisions. Adding the Fibonacci indicator, which is a powerful tool for identifying potential support and resistance levels in financial markets.
I  recommend you to read the   product's blog  (manual) from start to end so that it is clear from the beginning what the indicator offers. This multi time frame and multi symbol indicator scans for engulfing and tweezer formations.  The indicator can also be used in single chart mode. Combined with your own rules and techniques, this indicator will allow you to create (or enhance) your own powerful system. Features Can monitor all symbols visible in your Market Watch window at the same time. A
High And Low MT5
Dmitriy Parfenovich
On the current chart, this indicator displays candlestick highs and lows of another time frame. Input Parameters: TimeFrame - chart time frame whose data will be displayed on the current price chart (by default, H12). Time Zone - shift of the indicator by time zone relative to the broker's time (by default, Broker-1). If the broker's time zone is UTC+1 and the Time Zone parameter is set to Broker-1, the bends of the indicator will be plotted in multiples of Greenwich Time. Indicator buffer value
Seasonal Pattern Trader
Dominik Patrick Doser
Disclaimer : Keep in mind that seasonal patterns are not always reliable. Therefore, thoughtful risk management is crucial to minimize losses.  Seasonal patterns in the financial world are like a well-guarded secret that successful investors use to their advantage. These patterns are recurring price movements that occur during specific periods or around special events. Additionally, there are also intraday patterns that repeat. For example, Uncle Ted from Forex Family suggests examining previou
DM IND Exclusive
Sergio Vidal Prado
Indicador Para Opções Binarias. Indicator for Binary Options Usa dois gales. Instalar em mt5 Esse indicador é para ser usado no tempo de vela de 5 minutos e em M5. Este também funciona em M1, porém é mais eficiente em M5. Só descompactar e copiar os arquivos na pasta de dados do seu MT5. Arquivos indicator na pasta MQL5 - Indicator. Baixe também a Media Movel totalmente gratis: https://www.mql5.com/pt/market/product/50400 Esse Indicador é para a próxima vela. Apareceu a seta, só aguardar a pr
Immortal MT5
Paranchai Tensit
The EA is based on   trend trading strategy . Mechanism " trend trading strategy " is a tendency of a financial market price to move in a particular direction over time. If there is a turn contrary to the trend, This mechanism will exit and wait until the turn establishes itself as a trend in the opposite direction, and re-enter when the trend re-establishes. This EA has been back tested for 4 years of real tick data (2019-2022), consistent with the latest trading accounts. Immortal MT4:   https
"Battles between bulls and bears continue to influence price development long after the combat has ended, leaving behind a messy field that observant technicians can use to manage risk and find opportunities. Apply "trend mirror" analysis to examine these volatile areas, looking for past action to impact the current trend when price turns and crosses those boundaries." RSI Mirrors and Reflections is a robust technique using multiple RSI periods, mirrors and reflections based on RSI values to ind
Gann Rooster V15
Ehsan Kariminasab
Gann 9Sq expert version 15, using artificial intelligence, mathematical algorithms, Fibonacci, 9 Gann and Fibonacci square strategy, which enables us to have win rate of 200% profit per month. Initial investment for minimum capital of $100 to $1000, you are able to adjust the volume, date, hour, day and profit limit. adjustable profit limit in both buy and sell positions. Able to place orders in all time frames from 5 minutes to a week. further adjustment enables you to open the position accor
Special time limited offer: BUY for 70 USD. Be a market analyst, not just a trader! Stop wasting time by round-the-clock market mionitoring. Do your market analysis, set trading range and market sentiment for a day session and let this EA trade for you! It was created to help all day traders using price action to distance themselves from the emotional influence caused by instant market monitoring and routine decisions to open and close trades which is the source of most trading mi
Les acheteurs de ce produit ont également acheté
Atomic Analyst MT5
Issam Kassas
4.5 (16)
Tout d'abord, il convient de souligner que cet indicateur de trading n'est ni repainting, ni redrawing et ne présente aucun délai, ce qui le rend idéal à la fois pour le trading manuel et automatisé. Manuel de l'utilisateur : réglages, entrées et stratégie. L'Analyste Atomique est un indicateur d'action sur les prix PA qui utilise la force et le momentum du prix pour trouver un meilleur avantage sur le marché. Équipé de filtres avancés qui aident à éliminer les bruits et les faux signaux, et à
Tout d'abord, il convient de souligner que ce système de trading est un indicateur non repeint, non redessiné et non retardé, ce qui le rend idéal pour le trading manuel et automatisé. Cours en ligne, manuel et téléchargement de préréglages. Le "Système de Trading Smart Trend MT5" est une solution de trading complète conçue pour les traders débutants et expérimentés. Il combine plus de 10 indicateurs premium et propose plus de 7 stratégies de trading robustes, ce qui en fait un choix polyvalent
TPSpro RFI Levels MT5
Roman Podpora
4.63 (8)
Reversal First Impulse levels (RFI)      INSTRUCTIONS        RUS       -       ENG              R ecommended to use with an indicator   -   TPSpro  TREND PRO -  Version MT4                 A key element in trading is zones or levels from which decisions to buy or sell a trading instrument are made. Despite attempts by major players to conceal their presence in the market, they inevitably leave traces. Our task was to learn how to identify these traces and interpret them correctly. Main functi
TPSproTREND PrO MT5
Roman Podpora
4.89 (9)
TPSpro TREND PRO  - is a trend indicator that automatically analyzes the market and provides information about the trend and each of its changes, as well as giving signals for entering trades without redrawing! The indicator uses each candle, analyzing them separately. referring to different impulses - up or down impulse. Exact entry points into transactions for currencies, crypto, metals, stocks, indices!  Version MT4               DETAILED DESCRIPTION               R ecommended to use with an
Quantum Trend Sniper
Bogdan Ion Puscasu
4.91 (44)
Présentation       Quantum Trend Sniper Indicator   , l'indicateur révolutionnaire MQL5 qui transforme la façon dont vous identifiez et négociez les inversions de tendance ! Développé par une équipe de traders expérimentés avec une expérience commerciale de plus de 13 ans,       Indicateur Quantum Trend Sniper       est conçu pour propulser votre parcours de trading vers de nouveaux sommets grâce à sa manière innovante d'identifier les inversions de tendance avec une précision extrêmement élevée
Gold Stuff mt5
Vasiliy Strukov
4.9 (125)
Gold Stuff mt5 est un indicateur de tendance conçu spécifiquement pour l'or et peut également être utilisé sur n'importe quel instrument financier. L'indicateur ne se redessine pas et ne traîne pas. Délai recommandé H1. Contactez-moi immédiatement après l'achat pour obtenir les réglages et un bonus personnel !   Vous pouvez obtenir une copie gratuite de notre indicateur Strong Support et Trend Scanner, veuillez envoyer un message privé. moi!   RÉGLAGES Dessiner la flèche - on off. dessine
Top indicator for MT5   providing accurate signals to enter a trade without repainting! It can be applied to any financial assets:   forex, cryptocurrencies, metals, stocks, indices .  Watch  the video  (6:22) with an example of processing only one signal that paid off the indicator! MT4 version is here It will provide pretty accurate trading signals and tell you when it's best to open a trade and close it. Most traders improve their trading results during the first trading week with the help of
FX Power MT5 NG
Daniel Stein
5 (4)
Obtenez votre mise à jour quotidienne du marché avec des détails et des captures d'écran via notre Morning Briefing ici sur mql5 et sur Telegram ! FX Power MT5 NG est la nouvelle génération de notre très populaire indicateur de force des devises, FX Power. Et qu'est-ce que ce compteur de force de nouvelle génération offre ? Tout ce que vous avez aimé de l'original FX Power PLUS Analyse de la force de l'OR/XAU Des résultats de calcul encore plus précis Périodes d'analyse configurables individuel
Trend Screener Pro MT5
STE S.S.COMPANY
4.86 (56)
Indicateur de tendance, solution unique révolutionnaire pour le trading et le filtrage des tendances avec toutes les fonctionnalités de tendance importantes intégrées dans un seul outil ! Il s'agit d'un indicateur multi-période et multi-devises 100 % non repeint qui peut être utilisé sur tous les symboles/instruments : forex, matières premières, crypto-monnaies, indices et actions. Trend Screener est un indicateur de suivi de tendance efficace qui fournit des signaux de tendance fléchés avec des
Tout d'abord, il convient de souligner que cet outil de trading est un indicateur non repeint, non redessiné et non retardé, ce qui le rend idéal pour le trading professionnel. Cours en ligne, manuel utilisateur et démonstration. L'indicateur Smart Price Action Concepts est un outil très puissant à la fois pour les nouveaux et les traders expérimentés. Il regroupe plus de 20 indicateurs utiles en un seul, combinant des idées de trading avancées telles que l'analyse du trader Inner Circle et
Golden Spikes Premium
Kwaku Bondzie Ghartey
Golden Spikes Detector Acknowledgement and Dedications:  The name of this indicator was Inspired by an Original; Mr Grant Koopman; a Knowledgeable and experienced Synthetics trader. I dedicate this indicator to Mr Grant.  Overview: The Golden Spikes Premium is a groundbreaking trading indicator meticulously crafted for the Boom and Crash indices on the Deriv market. Tailored to meet the needs of discerning traders, this powerful tool operates exclusively on the one-minute timeframe, providin
FX Volume MT5
Daniel Stein
5 (12)
Obtenez votre mise à jour quotidienne du marché avec des détails et des captures d'écran via notre Morning Briefing ici sur mql5 et sur Telegram ! FX Volume est le PREMIER et SEUL indicateur de volume qui fournit un VRAI aperçu du sentiment du marché du point de vue d'un courtier. Il fournit des informations impressionnantes sur la façon dont les acteurs institutionnels du marché, comme les courtiers, sont positionnés sur le marché des changes, bien plus rapidement que les rapports COT. Voir c
Maintenant 147 $ (augmentant à 499 $ après quelques mises à jour) - Comptes illimités (PCS ou Mac) Manuel d'utilisation RelicusRoad + Vidéos de formation + Accès au groupe Discord privé + Statut VIP UNE NOUVELLE FAÇON DE REGARDER LE MARCHÉ RelicusRoad est l'indicateur de trading le plus puissant au monde pour le forex, les contrats à terme, les crypto-monnaies, les actions et les indices, offrant aux traders toutes les informations et tous les outils dont ils ont besoin pour rester renta
Trend Hunter MT5
Andrey Tatarinov
5 (1)
Trend Hunter est un indicateur de tendance pour travailler sur les marchés du Forex, des cryptomonnaies et des CFD. Une particularité de l'indicateur est qu'il suit la tendance avec confiance, sans changer le signal lorsque le prix dépasse légèrement la ligne de tendance. L'indicateur n'est pas redessiné; un signal d'entrée sur le marché apparaît après la fermeture de la barre. Lorsque vous suivez une tendance, l'indicateur affiche des points d'entrée supplémentaires dans la direction de la t
The Smart Liquidity Profile is color-coded based on the importance of the traded activity at specific price levels, allowing traders to identify significant price levels such as support and resistance levels, supply and demand zones, liquidity gaps, consolidation zones, Buy-Side/Sell-Side Liquidity and so on.  Smart Liquidity Profile allows users to choose from a number of different time periods including 'Auto,' 'Fixed Range,' 'Swing High,' 'Swing Low,' 'Session,' 'Day,' 'Week,' 'Month,' 'Quart
Vous recherchez un puissant indicateur de trading forex qui peut vous aider à identifier facilement des opportunités de trading rentables ? Ne cherchez pas plus loin que le Beast Super Signal. Cet indicateur basé sur les tendances facile à utiliser surveille en permanence les conditions du marché, en recherchant de nouvelles tendances en développement ou en sautant sur celles existantes. Le Beast Super Signal donne un signal d'achat ou de vente lorsque toutes les stratégies internes s'alignent
Advanced Supply Demand MT5
Bernhard Schweigert
4.46 (13)
La meilleure solution pour tout commerçant débutant ou expert ! Cet indicateur est un outil de trading unique, de haute qualité et abordable car nous avons intégré un certain nombre de fonctionnalités propriétaires et une nouvelle formule. Avec cette mise à jour, vous pourrez afficher des zones à double horaire. Vous pourrez non seulement afficher un TF plus élevé, mais afficher les deux, le graphique TF, PLUS le TF supérieur : AFFICHAGE DES ZONES NICHÉES. Tous les traders Supply Demand vont ado
Matrix Arrow Indicator MT5
Juvenille Emperor Limited
5 (10)
Matrix Arrow Indicator MT5   est une tendance unique 10 en 1 suivant un indicateur multi-période   100% non repeint   qui peut être utilisé sur tous les symboles/instruments:   forex ,   matières premières ,   crypto-monnaies ,   indices ,  actions .  Matrix Arrow Indicator MT5  déterminera la tendance actuelle à ses débuts, en rassemblant des informations et des données à partir d'un maximum de 10 indicateurs standard, qui sont: Indice de mouvement directionnel moyen (ADX) Indice de canal de m
Ce tableau de bord affiche les derniers   modèles harmoniques   disponibles pour les symboles sélectionnés, ce qui vous permettra de gagner du temps et d'être plus efficace /   version MT4 . Indicateur gratuit:   Basic Harmonic Pattern Colonnes de l'indicateur Symbol :   les symboles sélectionnés apparaissent Trend   :   haussière ou baissière Pattern :   type de motif (gartley, papillon, chauve-souris, crabe, requin, cypher ou ABCD) Entry:   prix d'entrée SL:   prix du stop loss TP1:   1
Gartley Hunter Multi
Siarhei Vashchylka
5 (8)
Gartley Hunter Multi - An indicator for searching for harmonic patterns simultaneously on dozens of trading instruments and on all possible timeframes. Manual (Be sure to read before purchasing) | Version for MT4 Advantages 1. Patterns: Gartley, Butterfly, Shark, Crab. Bat, Alternate Bat, Deep Crab, Cypher 2. Simultaneous search for patterns on dozens of trading instruments and on all possible timeframes 3. Search for patterns of all possible sizes. From the smallest to the largest 4. A
XQ Indicator MetaTrader 5
Marzena Maria Szmit
2 (1)
Step into the realm of Forex trading with confidence and precision using XQ, a cutting-edge Forex indicator designed to elevate your trading game to unprecedented heights. Whether you're a seasoned trader or just stepping into the world of currency exchange, XQ Forex Indicator empowers you with the insights and signals needed to make informed trading decisions. The signal conditions are a combination of three indicators, and XQ Forex Indicator only display  medium and long-term trends . The ind
Native Channels
BeeXXI Corporation
5 (1)
This indicator recognizes all support and resistance levels. A number of unique high-performance techniques have been applied, which made the existence of this indicator possible. All formed channels are naturally visible: horizontal linear linear parabolic cubic (Polynomial 3 degrees - Wave) This is due to a bundle of approximating channels. The formed channels form "standing waves" in a hierarchical sequence. Thus, all support and resistance levels are visible. All parameter management is
Blahtech Supply Demand MT5
Blahtech Limited
4.54 (13)
Was: $299  Now: $99   Supply Demand uses previous price action to identify potential imbalances between buyers and sellers. The key is to identify the better odds zones, not just the untouched ones. Blahtech Supply Demand indicator delivers functionality previously unavailable on any trading platform. This 4-in-1 indicator not only highlights the higher probability zones using a multi-criteria strength engine, but also combines it with multi-timeframe trend analysis, previously confirmed swings
AW Trend Predictor MT5
AW Trading Software Limited
4.71 (45)
La combinaison des niveaux de tendance et de panne dans un seul système. Un algorithme d'indicateur avancé filtre le bruit du marché, détermine la tendance, les points d'entrée, ainsi que les niveaux de sortie possibles. Les signaux indicateurs sont enregistrés dans un module statistique, qui vous permet de sélectionner les outils les plus appropriés, montrant l'efficacité de l'historique des signaux. L'indicateur calcule les marques Take Profit et Stop Loss. Manuel et instruction ->   ICI   / v
Was: $249  Now: $99   Market Profile defines a number of day types that can help the trader to determine market behaviour. A key feature is the Value Area, representing the range of price action where 70% of trading took place. Understanding the Value Area can give traders valuable insight into market direction and establish the higher odds trade. It is an excellent addition to any system you may be using. Inspired by Jim Dalton’s book “Mind Over Markets”, this indicator is designed to suit the
Owl Smart Levels MT5
Sergey Ermolov
3.7 (20)
Version MT4   |  FAQ L' indicateur Owl Smart Levels est un système de trading complet au sein d'un seul indicateur qui comprend des outils d'analyse de marché populaires tels que les fractales avancées de Bill Williams , Valable ZigZag qui construit la structure d'onde correcte du marché et les niveaux de Fibonacci qui marquent les niveaux exacts d'entrée. sur le marché et les endroits où prendre des bénéfices. Description détaillée de la stratégie Mode d'emploi de l'indicateur Conseiller-Assis
Gold Pointer est le meilleur indicateur de tendance. L'algorithme unique de l'indicateur analyse le mouvement du prix de l'actif, en prenant en compte les facteurs de l'analyse technique et mathématique, détermine les points d'entrée les plus rentables et donne un signal pour ouvrir un ordre d'ACHAT ou de VENTE. Les meilleurs signaux de l'indicateur: - Pour la VENTE = ligne de tendance rouge + indicateur TF rouge + flèche de signalisation jaune dans la même direction. - Pour l'ACHAT = ligne
Order Block Hunter MT5
Noha Mohamed Fathy Younes Badr
Order block hunter indicator is the best indicator for  hunt the order blocks that area where there has been a large concentration of limit orders waiting to be executed Order blocks are identified on a chart by observing previous price action and looking for areas where the price experienced significant movement or sudden changes in direction .This indicator does that for you by using very complicated codes and helps you to take the best areas To buy and sell because it make marks at the best a
Présentation       Quantum Breakout PRO   , l'indicateur révolutionnaire MQL5 qui transforme la façon dont vous négociez les zones d'évasion ! Développé par une équipe de traders expérimentés avec une expérience commerciale de plus de 13 ans,       Évasion quantique PRO       est conçu pour propulser votre parcours commercial vers de nouveaux sommets grâce à sa stratégie de zone de discussion innovante et dynamique. Quantum Breakout Indicator vous donnera des flèches de signalisation sur le
TrendDecoder Premium MT5
Christophe Pa Trouillas
5 (3)
Identifiez les ranges et les tendances fortes  |  Obtenez les premiers signaux   |    Obtenez des TP et des sorties   clairs   |    Repérer les niveaux Fibo que le prix va tester   |  Indicateur qui ne retrace pas, non retardé - idéal pour le trading manuel et automatisé - adapté à tous les actifs et à toutes les unités de temps - 50% discount   pour le lancement - puis retour à >>   149 $ Après votre achat,   contactez-moi sur ce canal  pour obtenir les réglages recommandés. Version MT4 :   cli
Plus de l'auteur
Je vous recommande de lire le       blog du produit   (manuel) du début à la fin afin que       il est clair dès le début ce que propose l'EA. La stratégie principale de cet Expert advisor (EA) est de placer des trades lorsque 3 moyennes mobiles (MA) sont alignées consécutivement et à une certaine distance l'une de l'autre (elle peut être utilisée par exemple pour une stratégie peu connue utilisée par certains traders institutionnels , ce qui implique les MA 10, 20 et 30 sur la plage horaire D1
I recommend you to read the   product's blog  (manual) from start to end so that it is clear from the beginning what the indicactor offers. This multi time frame and multi symbol indicator can identify the following 5 crosses: when a fast moving average crosses a slow moving average line. when price has reached a single moving average (closed above/below or just bounced). when a triple moving average formation has appeared (all 3 MA:s in consecutive alignment) when the MACD main line crosses th
The indicator identifies when a divergence occurs between price and an indicator or oscillator. It identifies both regular and hidden divergences. Combined with your own rules and techniques, this indicator will allow you to create (or enhance) your own powerful system. Features Can detect divergences for the following oscillators/indicators:   MACD, OsMA, Stochastics, RSI, CCI, RVI, Awesome, ADX, ATR, OBV, Composite index, MFI and Momentum. Only one oscillator/indicator can be selected. Draws
FREE
Cet indicateur à plusieurs périodes et à plusieurs symboles vous avertit des changements de couleur Heiken Ashi Smoothed. En prime, il peut également rechercher les changements de couleur (tendance) de la moyenne mobile de la coque. Combiné à vos propres règles et techniques, cet indicateur vous permettra de créer (ou d'améliorer) votre propre système puissant. Caractéristiques Peut surveiller tous les symboles visibles dans votre fenêtre Market Watch en même temps. Appliquez l'indicateur à un
This multi time frame and multi symbol indicator identifies fractals patterns. As a bonus it can also scan for Parabolic SAR (pSAR) trend changes. Combined with your own rules and techniques, this indicator will allow you to create (or enhance) your own powerful system. Features Can monitor all symbols visible in your Market Watch window at the same time. Apply the indicator to just one chart and instantly monitor the entire market. Can monitor every time frame, from M1 to MN, and sends you a
Cet indicateur multi-temps et multi-symboles identifie les motifs double haut/bas, tête et épaule, fanion/triangle et drapeau. Il est également possible de configurer des alertes uniquement lorsqu'une cassure de décolleté/triangle/mât de drapeau s'est produite (rupture de décolleté = signal confirmé pour le haut/les bas et la tête et les épaules).       L'indicateur peut également être utilisé en mode graphique unique. Veuillez en savoir plus sur cette option dans le produit   blogue . Combiné à
Je vous recommande de lire le   blog (manuel) du produit   du début à la fin afin que ce soit clair dès le début ce que propose EA. Cet Expert Advisor identifie lorsqu'une divergence se produit entre le prix et un oscillateur/indicateur. Il identifie à la fois les divergences régulières/classiques (inversion de tendance) et cachées (poursuite de la tendance). Il propose des options de zone offre/demande, RSI, Bollinger, stochastique, moyenne mobile (MA régulière et Hull MA), ADX et filtre de vo
L'indicateur identifie quand une divergence se produit entre le prix et un oscillateur/indicateur. Il identifie à la fois les divergences régulières et cachées. Il dispose d'une option de filtre RSI qui permet de filtrer uniquement les configurations les plus puissantes. L'indicateur offre également des options pour attendre une formation engloutissante, une cassure du canal Donchian ou que le prix croise une moyenne mobile   (voir capture d'écran #3)       pour confirmer la divergence avant de
Cet indicateur de tableau de bord de divergence multi périodes et multi symboles envoie une alerte lorsqu'une ou deux divergences différentes ont été identifiées sur plusieurs périodes et non sur des divergences uniques. Il peut être utilisé avec toutes les plages horaires de M1 à MN. Un maximum de 9 périodes peuvent être affichées dans le tableau de bord en même temps. Il est possible d'activer le filtre de tendance de la moyenne mobile, du RSI ou des bandes de Bollinger pour filtrer uniquement
L'indicateur identifie lorsqu'une divergence se produit entre le prix et un oscillateur/indicateur. Il identifie à la fois les divergences haussières et baissières. Il dispose d'une option de filtre RSI qui permet de filtrer uniquement les configurations les plus fortes. L'indicateur offre également des options pour attendre une cassure du canal Donchian ou que le prix croise une moyenne mobile (voir capture d'écran #3) pour confirmer la divergence avant de signaler l'opportunité commerciale. Co
Please if possible consider the  paid version  which I will continue to develop (there will be no future updates for this free version). This Expert Advisor identifies when a divergence occurs between price and an oscillator/indicator. It identifies both regular/classical (trend reversal) and hidden (trend continuation) divergences. It has RSI, bollinger, stochastics, moving average and ADX filter options which makes it possible to filter out only the strongest setups. The default settings ar
FREE
I recommend you to read the   product's blog  (manual) from start to end so that it is clear from the beginning what the indicactor offers. This multi time frame and multi symbol supply and demand zone dashboard indicator sends alerts when the price has reached a supply/demand zone. It is also possible to use it to be alerted about regular double tops/bottoms instead of zones. It can be used with all time frames from M1 to MN. It is possible to use RSI, divergence (MACD, OsMA, RSI or Awesome) a
Divergence dashboard
Jan Flodin
4.64 (11)
I recommend you to read the   product's blog  (manual) from start to end so that it is clear from the beginning what the indicactor offers. This multi time frame and multi symbol divergence dashboard indicator sends an alert when one or two different divergences have been identified. It can be used with all time frames from M1 to MN. It is possible to enable moving average or RSI trend filter to filter out only the strongest setups. Combined with your own rules and techniques, this indicator wi
This multi indicator/oscillator (hereafter indicator), multi time frame and multi symbol indicator identifies when a divergence occurs between price and one, two or three indicators. It identifies both regular/classical (trend reversal) and hidden (trend continuation) divergences. It has RSI and MA trend filter options which makes it possible to filter out only the strongest setups. Combined with your own rules and techniques, this indicator will allow you to create (or enhance) your own powerfu
This indicator can send alerts when a Heiken Ashi Smoothed color change occurs. Combined with your own rules and techniques, this indicator will allow you to create (or enhance) your own powerful system. Features Can send all types of alerts. Option to delay the alert one or more bars in order to confirm the color (trend) change. Input parameters Candle shift for alert: Default is 1. Setting it to 0 will alert you on color change on the current candle. This should be regarded as a pending (uncon
FREE
This indicator can send alerts when a Heiken Ashi Smoothed color change occurs. Combined with your own rules and techniques, this indicator will allow you to create (or enhance) your own powerful system. Features Can send all types of alerts. Option to delay the alert one bar in order to confirm the color (trend) change. Input parameters Wait for candle close: 'true' or 'false'. Setting it to 'true' will delay the alert to the opening of the bar following the bar where the color change occurred.
FREE
The indicator identifies when a divergence occurs between price and an indicator or oscillator. It identifies bullish and bearish hidden or regular (classical) divergences. Combined with your own rules and techniques, this indicator will allow you to create (or enhance) your own powerful system. Features Can detect divergences for the following indicators/oscillators: MACD, OsMA (Moving average of Oscillator), Stochastics, RSI, CCI, RVI, Awesome (AO), ADX, ATR, OBV, MFI, Momentum and   Composi
FREE
I recommend you to read the  product's blog  (manual) from start to end so that it is clear from the beginning what the EA offers. This Expert Advisor (EA) is designed to trade on a rapid price movement following a news event. The EA trades multiple symbols from one single chart which must be a EURUSD H1 chart. It it advisable to remove all symbols you don't trade from the Market Watch to reduce the overall data demand. The 'Auto settings' input parameter value True must only be used you have s
Cet indicateur à plusieurs périodes et à plusieurs symboles identifie les formations haut/bas doubles ou triples ou une cassure de décolleté suivante (haut/bas confirmé). Il offre des filtres RSI, pin bar, engloutissant, pince à épiler, étoile du matin/soir ainsi que des options de filtre de divergence qui permettent de filtrer uniquement les configurations les plus fortes.       L'indicateur peut également être utilisé en mode graphique unique. Veuillez en savoir plus sur cette option dans le p
Cet indicateur de tableau de bord d'offre et de demande à plusieurs périodes et à plusieurs symboles envoie des alertes lorsque le prix a atteint une zone d'offre/demande. Il est également possible de l'utiliser pour être alerté des doubles hauts/bas réguliers au lieu des zones. Il peut être utilisé avec toutes les plages horaires de M1 à MN.       Un maximum de 9 périodes peuvent être affichées dans le tableau de bord en même temps.   Il est possible d'utiliser des filtres RSI, divergence (MACD
Veuillez si possible envisager d'acheter le       Version MT5   que je continuerai à développer (il n'y aura pas de futures mises à jour pour cette version MT4). Je vous recommande également de lire       blog du produit   (manuel) du début à la fin afin qu'il soit clair dès le début ce que propose l'EA. La stratégie principale de cet Expert advisor (EA) est de placer des trades lorsque 3 moyennes mobiles (MA) sont alignées consécutivement et à une certaine distance l'une de l'autre (elle peut
This multi indicator/oscillator (hereafter indicator), multi time frame and multi symbol indicator identifies when a divergence occurs between price and one, two or three indicators. It identifies both regular/classical (trend reversal) and hidden (trend continuation) divergences. It has RSI and MA trend filter options which makes it possible to filter out only the strongest setups. Combined with your own rules and techniques, this indicator will allow you to create (or enhance) your own powerfu
Cet indicateur à plusieurs périodes et à plusieurs symboles identifie les formations haut/bas doubles ou triples ou une cassure de décolleté suivante (haut/bas confirmé). Il offre des filtres RSI, pin bar, engloutissant, pince à épiler, étoile du matin/soir ainsi que des options de filtre de divergence MACD, Awesome (AO) ou RSI qui permettent de filtrer uniquement les configurations les plus fortes.       L'indicateur peut également être utilisé en mode graphique unique. Veuillez en savoir plus
Cet indicateur multi-périodes et multi-symboles identifie le moment où la ligne de signal stochastique croise la ligne principale stochastique. Comme alternative, il peut également alerter lorsque la stochastique quitte (sans ligne de signal traversant la ligne principale) une zone de surachat/survente. En prime, il peut également rechercher les bandes de Bollinger et les croisements de surachat/survente RSI. Combiné avec vos propres règles et techniques, cet indicateur vous permettra de créer (
Features This is an indicator that recognizes a special type of Inside Bar formation which is formed by a Master candle followed by 4 smaller candles (please see the strategy explanation below). Plots buy/sell stop lines on the chart as well as well as take profit and stop loss levels. The TP/SL levels are based on the Average True Range (ATR) indicator. Object colors are changeable. Sends you a real-time alert when a Master candle formation is identified - sound / pop-up / email / push notifica
I recommend you to read the   product's blog  (manual) from start to end so that   it is clear from the beginning what the indicator offers. This multi oscillator, multi time frame and multi symbol indicator identifies when a divergence occurs between price and an oscillator/indicator. It identifies both regular/classical (trend reversal) and hidden (trend continuation) divergences. It has moving average, RSI/Bollinger, ADX, pin bar and engulfing filter options which makes it possible to filter
This multi symbol indicator has been designed to automatically identify when price reaches major psychological levels. Also known as round numbers, whole numbers or key levels. As a bonus it can also scan for pivot point level on one selected time frame. Combined with your own rules and techniques, this indicator will allow you to create (or enhance) your own powerful system. Features Can write the signals to a file which can be used by an Expert Advisor for auto trading. Can monitor all symbol
This multi time frame and multi symbol indicator identifies high-probability breakout patterns. It does this by identifying strong, symmetrical pennants and triangles. This pattern DOES NOT appear very often on higher time frames. But when it does, it is a very high-probability setup. The indicator also includes an Inside bars scanner. It can for example be used to detect a special type of Inside bars formation which is formed by a Master candle (MC) followed by 4 inside candles (please see the
Cet indicateur reconnaît un type spécial de formation de barre intérieure qui est formée d'une grande bougie principale suivie de 4 bougies plus petites (veuillez consulter l'explication de la stratégie ci-dessous). Caractéristiques Trace les lignes d'arrêt d'achat/vente sur le graphique ainsi que les niveaux de profit et d'arrêt de perte. Les niveaux TP/SL sont basés sur l'indicateur Average True Range (ATR). Les couleurs des objets sont modifiables. Vous envoie une alerte en temps réel lorsqu'
I recommend you to read the   product's blog  (manual) from start to end so that it is clear from the beginning what the indicactor offers. This multi time frame and multi symbol indicator scans for pin bars. Combined with your own rules and techniques, this indicator will allow you to create (or enhance) your own powerful system. Features Can monitor all symbols visible in your Market Watch window at the same time. Apply the indicator to just one chart and instantly monitor the entire market.
Filtrer:
tunck
1194
tunck 2023.04.08 02:44 
 

SL/TP for patterns?

Jan Flodin
122840
Réponse du développeur Jan Flodin 2023.04.08 13:45
Hello and many thanks for the review :-)
Engulfing, Tweezer and Three line strike:
The entry is typically at the high/low of the pattern. SL and risk level for trading can be placed at the swing high/low of the pattern. This makes it relatively easy for traders to target (TP) at least twice the distance of their stop loss, creating a 1:2 risk-to-reward ratio.
Pin bar:
Entry on break of pin bar high/low. SL at pin bar low/high. TP at previous swing point. For this purpose you can use Donchian channel (highest/lowest of last 20 bars). Please make sure that it will give at least R/R (risk/reward) of 1:2).
Inside bars and Pennants/triangles:
Will need to attach a document which is not possible here. I will send you a private message on MQL5 as soon as you have approved my Friends request (you have blocked sending private messages from non friends)
Kayhan
62
Kayhan 2021.09.07 16:25 
 

I was looking forward to seeing this kind of indicator. Thank you very much.

Delboyuk
81
Delboyuk 2020.12.29 18:22 
 

L'utilisateur n'a laissé aucun commentaire sur la note

smmfx
80
smmfx 2020.11.05 16:07 
 

An amazing indicator that gives me very accurate signals based on my strategy. I thank Jan for answering my challenging questions before I buy it. The coding and details that saw looks very professional.

Thomas
85
Thomas 2019.07.10 11:22 
 

Perfect. Get really good Signals. Thx Jan again.

Devonish
3007
Devonish 2018.11.21 20:23 
 

I've just rented this for a month and initial impressions are good. Its quite likely I may go on to purchase as scanning all assets on all time frames is not practical. It will be used to support existing strategies. The only reason its not 5 star is having the candle/s highlighted on the chart would be nice, but I accept its not possible.

June 2019 Update: I purchased this product and have been using it for six months. It compliments my strategies very well. Upgraded to 5 stars.

Répondre à l'avis
Version 2.1 2023.10.07
*** Please always make a backup of the existing indicator (the .ex5 file) before you make an update ***

Change log:
- bug fix for the panel which in some cases got minimized
- added an option to write the signals as global variables instead of to a file (to be used by an EA)
- added the possibility to set the colors in the panel
- added drawing of a rectangle to highlight Engulfings, Tweezers, Stars and Three line strikes
Version 2.0 2022.10.25
*** Please always make a backup of the existing indicator (the .ex5 file) before you make an update ***

- added an option to the engulfing scanning to set minimum amount of candles that must be engulfed. In this way it will be possible to scan for so called Outside bars.
Version 1.9 2021.12.15
- bug fix in the single chart function
Version 1.8 2021.12.08
*** Please always make a backup of the existing indicator (the .ex5 file) before you make an update ***

- added a possibility to use the indicator in single chart mode (checking only one symbol and time frame). It will then draw the patterns on the chart where the indicator is running. This option is in some ways limited though. More information in the product's blog.
- added the possibility to be alerted only when there has been a breakout from the Inside bars formation
- added the drawing of arrows for pin bar, engulfing, tweezer, star and three line strike patterns when the chart is opened from the panel
- added the possibility to add a custom text to the pop-up, push and mail alerts
- added the possibility to set a custom panel title
- added the engulfing option Size candle B engulfs body candle A
- added the possibility to use RSI trend filter in combinaton with Bollinger bands. Both must be on overbought/oversold area
Version 1.7 2019.11.20
- added the possibility to write the signals in the panel to a file. Could for instance be used by an Expert Advisor for automatical trading. For instance this product: https://www.mql5.com/en/market/product/43820
Version 1.6 2019.09.17
- added drawing of Tweezer and Three Line Strike formations in the strategy tester
- added moving average trend filter
- added ADX volality filter
Version 1.5 2019.08.13
- added scanning for Three Line Strike formations
Version 1.4 2019.07.15
- corrected bug fix for the change in version 1.3
Version 1.3 2019.07.15
- added the possibility to set a fixed time frame for the trend filter.
Version 1.2 2019.07.10
- added the possibility to ignore wicks on the inside bars candles
- added the possibility to set minimum and/or maximum candle size for the master (first) bar in a inside bars formation
- lines will now be drawn on Inside bars and Pennant/Triangles formations when opening a chart from the panel
- added a parameter for the line color of the line drawings mentioned above
Version 1.1 2019.06.20
- it is now possible to enable Tweezer separately without also having Engulfing enabled
- added the possibility to set the panel width
- added an option to use symbols from the Market Watch window
- added an additional average candle size filter for pin bars
- added an addiotinal midpoint filter for pin bars